. 2016 Apr 15:6:24515.
doi: 10.1038/srep24515.

INaP selective inhibition reverts precocious inter- and motorneurons hyperexcitability in the Sod1-G93R zebrafish ALS model

Affiliations

INaP selective inhibition reverts precocious inter- and motorneurons hyperexcitability in the Sod1-G93R zebrafish ALS model

Lorena Benedetti et al. Sci Rep. .

Abstract

The pathogenic role of SOD1 mutations in amyotrophic lateral sclerosis (ALS) was investigated using a zebrafish disease model stably expressing the ALS-linked G93R mutation. In addition to the main pathological features of ALS shown by adult fish, we found remarkably precocious alterations in the development of motor nerve circuitry and embryo behavior, and suggest that these alterations are prompted by interneuron and motor neuron hyperexcitability triggered by anomalies in the persistent pacemaker sodium current INaP. The riluzole-induced modulation of INaP reduced spinal neuron excitability, reverted the behavioral phenotypes and improved the deficits in motor nerve circuitry development, thus shedding new light on the use of riluzole in the management of ALS. Our findings provide a valid phenotype-based tool for unbiased in vivo drug screening that can be used to develop new therapies.
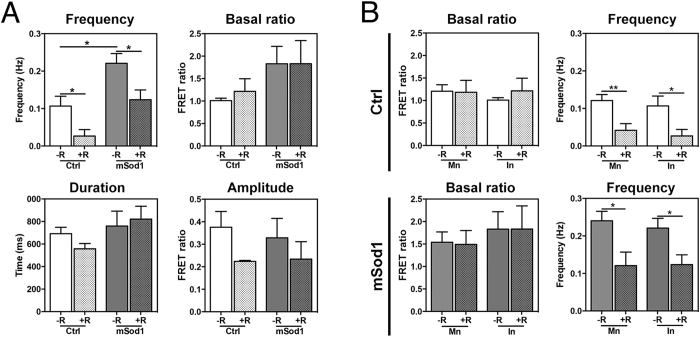

Figures

Figure 1
Figure 1. Spinal cord and lateral muscle histological analyses.
Each adult fish was transversely cut into five segments (S1–S5) using the fins as anatomical references (see Supp. Figure S2). (A) Hematoxylin & eosin-stained histological sections of the S2 segment of the spinal cord (upper panels; scale bar: 50 μm) and white muscle fibres (lower panels; scale bar: 25 μm) in control (Ctrl), wtSod1 and mSod1 zebrafish. Muscular atrophy and edema (*) with infiltrating cells (arrowhead) are visible in mSod1 lateral muscle. (B) The plots show the significant reduction in spinal cord area and the number of motor neurons throughout the spinal cord, and a significant reduction in the calibre of white muscle fibres along the mSod1 fish trunk. Each point in the plots shows the mean value ± SEM of the indicated parameter in each segment of seven animals for each genotype. The measures were statistically analyzed using two-way ANOVA, and corrected by means of Sidak’s multiple comparison test (*P < 0.05; **P < 0.01; ***P < 0.001).
Figure 2
Figure 2. Twelve-month-old mSod1 zebrafish show compromised lateral white muscle innervation.
(A) Maximum projections of confocal images of synaptic vesicle protein 2A (SV2A, green) and muscle acetylcholine receptors (AChRs, red) covering the entire thickness (20 μm) of a Ctrl and mSod1 zebrafish lateral muscle cryostat section. In the Ctrl zebrafish, each post-synaptic specialization enriched with acetylcholine receptors faces motor nerve terminals containing vesicle clusters, whereas many of the post-synaptic clusters in the mSod1 section lack an association with motor pre-synaptic terminals (white dashed boxes). Scale bar: 20 μm. (B) The percentage of innervation of post-synaptic specializations is significantly reduced in the mSod1 zebrafish (57.48 ± 8.69% vs 95.94 ± 0.84%), and three-dimensional co-localization analysis of z-stacks covering the entire thickness of the sections revealed a significant reduction in pre-synaptic cluster density (5.76 ± 0.09 vs 8.69 ± 0.06 × 10−4 clusters/μm2) but not in post-synaptic cluster density (9.96 ± 0.05 vs 9.04 ± 0.06 × 10−4 clusters/μm2). The columns in each graph indicate the mean value ± SEM of the indicated parameter in five Ctrl and six mSod1 zebrafish. The measures were statistically analyzed using an unpaired Student t-test (*P < 0.05; **P < 0.01).
Figure 3
Figure 3. Sod1 overexpression causes motor nerve alterations at 24 hpf.
(A) Confocal fluorescence maximum projection images showing SV2A signals (green) in the 12–16th somite region of the entire trunk of control (Ctrl), wtSod1 and mSod1 zebrafish embryos at 24 hpf (the same analysis was made in the 17–21st somite region with comparable results, data not shown). As synaptic vesicles travel the entire axonal length, it is possible to observe the length of embryonal motor axons and motor nerve branches. Scale bar: 25 μm. (B) Both wtSod1 (78.9 ± 2.8 μm) and mSod1 embryos (73.1 ± 3.5 μm) showed significantly shorter motor axons than the Ctrl (95.6 ± 2.4 μm) and a significant decrease in unbranched axonal length (55.0 ± 3.5 and 38.0 ± 4.3 μm vs 73.0 ± 2.8 μm), but only the mSod1 embryos showed a significant increase in the number of motor nerve branches: 3.8 ± 0.4 vs 1.9 ± 0.2 (Ctrl) and 2.4 ± 0.3 (wtSod1). The columns indicate the mean value ± SEM of the indicated parameter in at least five motor nerves of each of 25 Ctrl, 17 wtSod1, and 21 mSod1 embryos. The measures were statistically analyzed using one-way ANOVA or the Kruskal-Wallis test, respectively corrected by means of Tukey’s or Dunn’s multiple comparison test (*P < 0.05; ***P < 0.001).
Figure 4
Figure 4. mSod1 embryos and larvae show defects in the clustering of synaptic vesicles and the maturation of neuromuscular junctions.
(A) Confocal analysis of the 9–13th somite trunk region at 48 hpf. Scale bar: 25 μm. (B) There were no differences among the control (Ctrl), wtSod1 and mSod1 embryos and larvae in terms of motor axon length (respectively 147.2 ± 5.2 μm, 139.3 ± 4.6 μm, and 135.1 ± 5.5 μm), the number of branches (18.1 ± 2.5, 19.7 ± 2.1, and 22.1 ± 1.8), or unbranched axon length (28.9 ± 4.8 μm, 6.6 ± 2.1 μm, and 7.9 ± 2.2 μm) (data not shown). The measurements were made in at least four motor nerves of a minimum of 10 embryos for each genotype. Three-dimensional (3D) object-based co-localization analysis (numerical data given in Table 1) did not reveal any differences in the densities of total pre-synaptic or pre-synaptic co-localizing clusters, or in the densities of total post-synaptic or post-synaptic co-localizing clusters, but there was a significant increase in the area of pre-synaptic (but not post-synaptic) clusters in the mSod1 embryos. (C) Confocal analysis of the 10–15th somite trunk region at 96 hpf. Scale bar: 25 μm. (D) Although the mean area of the pre- and post-synaptic clusters in the different genotypes remained unchanged, 3D object-based co-localisation analysis showed a significant reduction in the density of presynaptic (but not post-synaptic) SV2A clusters in mSod1 NMJs, and a significant reduction in co-localizing pre- and post-synaptic clusters in mSod1 larvae (numerical data given in Table 1).
Figure 5
Figure 5. mSod1 larvae show a significant reduction in the calibre of muscle fibres with a preserved sarcomere ultrastructure.
(A) Maximum projection of myosin second harmonic generation (SHG) signal images in the 12–15th somite region of the trunk of mSod1 larvae. Scale bar: 25 μm. (B) Myosin SHG signal images of Ctrl, wtSod1 and mSod1 muscle fibres showing the endogenous myosin signal to quantify muscle fibre calibre (scale bar: 20 μm), which was significantly reduced in the mSod1 than in the control (Ctrl) or wtSod1 larvae (5.13 ± 0.16 μm vs 6.28 ± 0.26 μm and 5.82 ± 0.30 μm). The columns indicate the mean value ± SEM in 17 Ctrl, 15 wtSod1 and 18 mSod1 larvae. The data were statistically analyzed using one-way ANOVA and Tukey’s multiple comparison tests (**P < 0.01). (C) Detail of myosin SHG signal showing sarcomere organization in Ctrl, wtSod1 and mSod1 muscle fibres. Scale bar: 5 μm. No difference in the length of the sarcomeres in the Ctrl, wtSod1 and mSod1 fibres has been detected. (D) Electron micrographs showing the preserved sarcomere ultrastructure in Ctrl, wtSod1 and mSod1 larvae at 96 hpf. Lack of variation in sarcomeres length was confirmed by measuring 100 sarcomeres in two fish per genotype (respectively 1.89 ± 0.03 μm, 1.85 ± 0.03 μm, and 1.90 ± 0.04 μm). The measures were statistically analyzed using one-way ANOVA, corrected by means of Tukey’s post-test.
Figure 6
Figure 6. mSod1 embryos and larvae show increased locomotor activity.
(A) In comparison with controls (Ctrl), mSod1 embryos showed a significant increase in the frequency of spontaneous tail coiling behavior at 20 hpf. The mSod1 embryos showed a significantly higher percentage of both double and multiple coiling in comparison with the Ctrl and wtSod1 embryos. The Ctrl and wtSod1 embryos showed the same percentage of contralateral (C) and ipsilateral (I) bends of the entire body, whereas the mSod1 embryos showed a significant higher percentage of I coilings (numerical data given in Table 2). (B) The maximum angle of tail flexion (scale bar: 500 μm) and the duration of touch-evoked responses at 48 hpf. Touch-evoked tail coiling responses lasted significantly longer in the mSod1 embryos, and the maximum angle of tail flexion was significantly less (numerical data given in Table 3). (C) Schematic representation of the experimental set-up used to test touch-evoked swimming responses in larvae at 96 hpf, showing a representative response in red. The mSod1 larvae showed significantly longer-lasting evoked swimming responses and travelled significantly further; as these responses consisted of repeated consecutive burst swimming events, the average speed was significantly lower (numerical data given in Table 3).
Figure 7
Figure 7. Riluzole treatment reverts the motor phenotype and normalizes motor axon length in mSod1 embryos.
(A) Protocol used to correlate embryonic behavior (20 hpf) and spinal nerve morphology (24 hpf). Transgenic and non-transgenic embryos from heterozygous mSod1 adults (1) were placed in a petri dish, and spontaneous tail coiling was recorded with (+R) and without riluzole (−R) (2). The embryos were then stained for immunofluorescence, visualized by means of confocal microscopy (3), and PCR-genotyped in order to distinguish the transgenic and control fish (4). (B) Riluzole significantly reduced the frequency of spontaneous tail coiling, the percentage of double coiling, and the percentage of double and multiple coiling in both genotypes (Table 4), bringing the frequency of spontaneous coilings, the percentage of multiple tail coilings and the type of multiple tail coilings (the relative percentage of contralateral [C] and ipsilateral [I] tail bends [39.5% C and 60.5% I before and 46.13% C and 53.87% I after riluzole treatment]) to levels comparable with those of the control (Ctrl) embryos before riluzole administration. The columns in each graph indicate the mean value ± SEM of the indicated parameter in 28 Ctrl and 23 mSod1 embryos before and after riluzole treatment. (C) Riluzole treatment did not affect motor axon length (91.5 ± 3.3 μm before and 88.5 ± 3.6 μm after), unbranched axon length (68.6 ± 3.6 μm before and 57.9 ± 4.7 μm after) or the number of branches (2.0 ± 0.2 before and 1.9 ± 0.3 after) in the 12–16th somite trunk region of Ctrl embryos, but significantly increased motor axon length (71.44 ± 2.9 μm before and 82.4 ± 3.8 μm after) without affecting unbranched axon length (34.6 ± 2.9 μm before and 34.04 ± 3.4 μm after) or the number of branches (4.0 ± 0.2 before and 4.1 ± 0.3 after) in the same region of mSod1 embryos. The columns in each graph indicate the mean value ± SEM of the indicated parameter in 11 Ctrl and 22 mSod1 embryos treated with riluzole, and respectively 28 and 33 untreated embryos. The measures were statistically analyzed using an unpaired Student t-test (see Table 4).
Figure 8
Figure 8. Riluzole treatment reduces spontaneous high-frequency depolarizations in the spinal motor neurons of mSod1 embryos.
(A) Representative examples of spontaneous mean FRET ratio changes in a control (Ctrl) and mSod1 motor neuron during a one-minute recording (the biosensor FRET ratio increases when membrane potential increases). Insets: detailed morphology of two depolarizing events. (B) Representative traces showing the FRET ratio changes recorded in the same Ctrl and mSod1 motor neurons before and after five minutes’ riluzole administration. (C) In comparison with Ctrl, the mSod1 motor neurons showed a significant increase in the frequency of spontaneous depolarizations (Ctrl: 0.12 ± 0.02 Hz; mSod1: 0.24 ± 0.03 Hz), but there was no difference in the basal FRET ratio (Ctrl: 1.21 ± 0.14; mSod1: 1.54 ± 0.23), or the amplitude (Ctrl: 0.34 ± 0.05; mSod1: 0.34 ± 0.06) or duration of depolarization (Ctrl: 791 ± 44 ms; mSod1: 863 ± 86 ms). The statistical analyses showed that riluzole did not affect the motor neurons’ basal FRET ratio (Ctrl: 1.18 ± 0.26; mSod1: 1.49 ± 0.31), or the amplitude (0.22 ± 0.05 in Ctrl; mSod1 0.27 ± 0.06) or duration of periodic depolarizations (Ctrl: 889 ± 219 ms; mSod1: 1094 ± 215 ms), but significantly reduced the frequency of the depolarizing events (Ctrl 0.04 ± 0.02 Hz; mSod1 0.12 ± 0.02 Hz). The columns in each graph represent the mean value ± SEM of the indicated parameter in 12 Ctrl and 12 mSod1 motor neurons before and after riluzole administration. The measures were statistically analyzed using an unpaired Student t-test (*P < 0.05; **P < 0.01; ***P < 0.001).
Figure 9
Figure 9. Riluzole treatment reduces spontaneous high-frequency depolarizations in the spinal interneurons of mSod1 embryos.
(A) The basal FRET ratio, and the frequency amplitude and duration of the depolarizations recorded in type 1 interneurons (T1) in riluzole-treated (+R) and untreated (−R) Ctrl and mSod1 embryos. There were no differences in the basal FRET ratio of T1 in Ctrl and mSod1 embryos before (1.01 ± 0.05 vs 1.83 ± 0.39) or after riluzole administration (Ctrl: 1.22 ± 0.28; mSod1: 1.83 ± 0.52). Before riluzole treatment, the T1 in mSod1 embryos showed significantly higher-frequency spontaneous depolarizations than those in Ctrl embryos (0.22 ± 0.03 Hz vs 0.11 ± 0.03 Hz), but the frequency was reduced in both after riluzole treatment (mSod1: 0.12 ± 0.03 Hz; Ctrl 0.01 ± 0.01 Hz), although there was no difference in amplitude (Ctrl: 0.37 ± 0.07 [−R] and 0.22 ± 0.01 [+R]; mSod1: 0.33 ± 0.08 [−R] and 0.23 ± 0.07 [+R]) or duration (Ctrl: 692.4 ± 56.8 ms [−R] and 557.7 ± 47.02 ms [+R]; mSod1: 759.8 ± 131.9 ms [−R] and 821.4 ± 114.2 ms [+R]). (B) Comparison of the basal FRET ratio and spontaneous depolarization frequency recorded in embryonal spinal cord motor neurons (Mn) and interneurons (In). There was no difference in the basal Ctrl and mSod1 motor neuron and T1 interneuron ratio with (+R) or without riluzole (−R), and no difference between the motor neurons and interneurons of Ctrl and mSod1 embryos in spontaneous depolarization frequency or its reduction after treatment. The basal FRET ratio and frequency (Hz) of spontaneous depolarizations were measured in five Ctrl and 16 mSod1 T1 before and after riluzole administration, and their amplitude (FRET Ratio) and duration (ms) were measured in five Ctrl and five mSod1 T1 with (+R) or without riluzole (−R). The columns in each graph indicate the mean value ± SEM of the indicated parameter. The measures were statistically analyzed using an unpaired Student t-test (*P < 0.05; **P < 0.01).

References

    1. Simon N. G. et al. Quantifying Disease Progression in Amyotrophic Lateral Sclerosis. Ann Neurol. 76, 643–657 (2014). - PMC - PubMed
    1. Renton A. E., Chiò A. & Traynor B. J. State of play in amyotrophic lateral sclerosis genetics. Nat Neurosci. 17, 17–23 (2014). - PMC - PubMed
    1. Vucic S., Rothstein J. D. & Kiernan M. C. Advances in treating amyotrophic lateral sclerosis: insights from pathophysiological studies. Trends Neurosci. 37, 433–442 (2014). - PubMed
    1. Marangi G. & Traynor B. J. Genetic causes of amyotrophic lateral sclerosis: New genetic analysis methodologies entailing new opportunities and challenges. Brain Res. 1607, 75–93 (2015). - PMC - PubMed
    1. Bellingham M. C. A review of the neural mechanisms of action and clinical efficiency of riluzole in treating amyotrophic lateral sclerosis: what have we learned in the last decade? CNS Neurosci Ther. 17, 4–31 (2011). - PMC - PubMed

MeSH terms