. 2016 Apr 15:6:24395.
doi: 10.1038/srep24395.

Anatomy of Indian heatwaves

Affiliations

Anatomy of Indian heatwaves

J V Ratnam et al. Sci Rep. .

Abstract

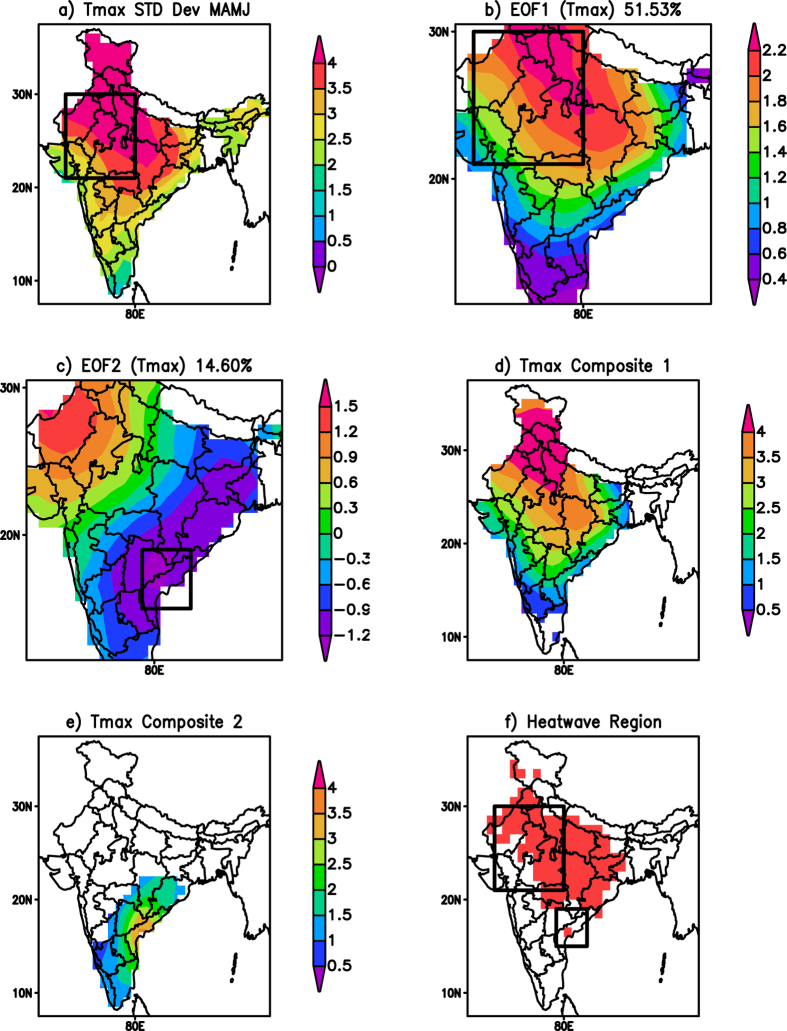
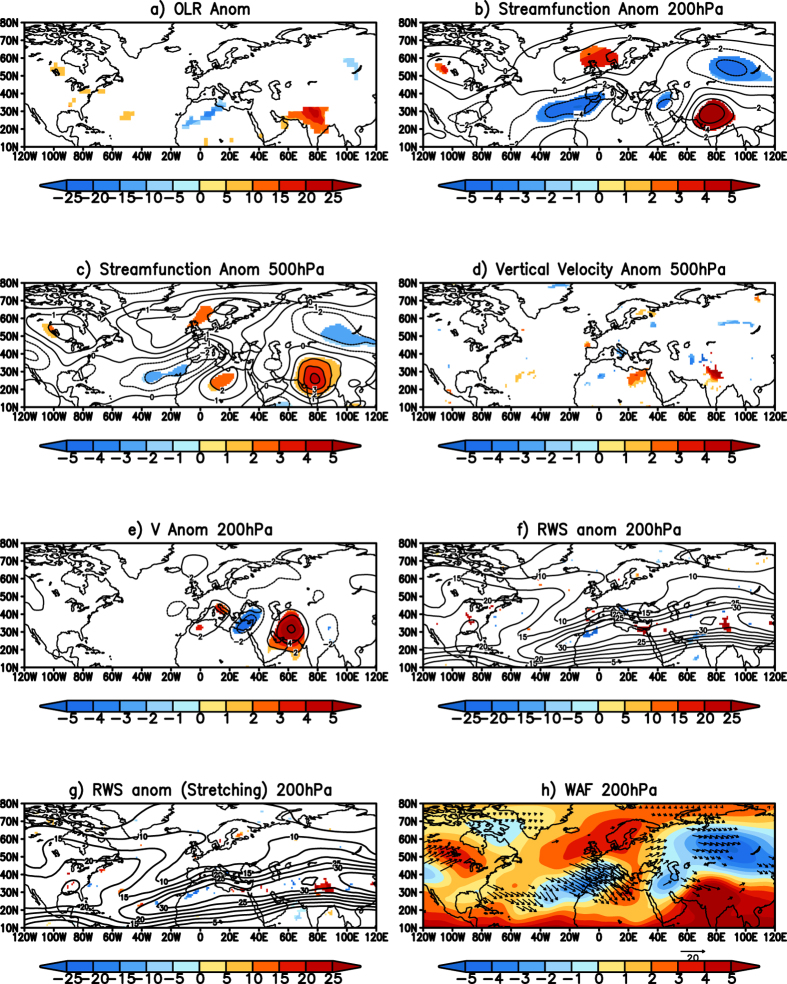
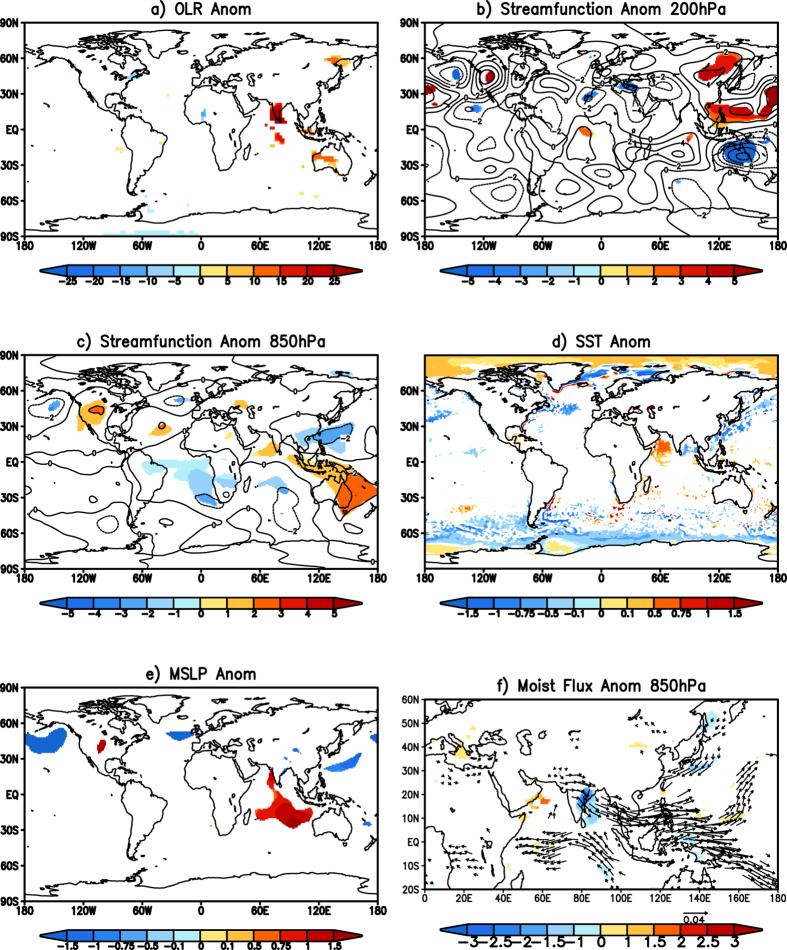
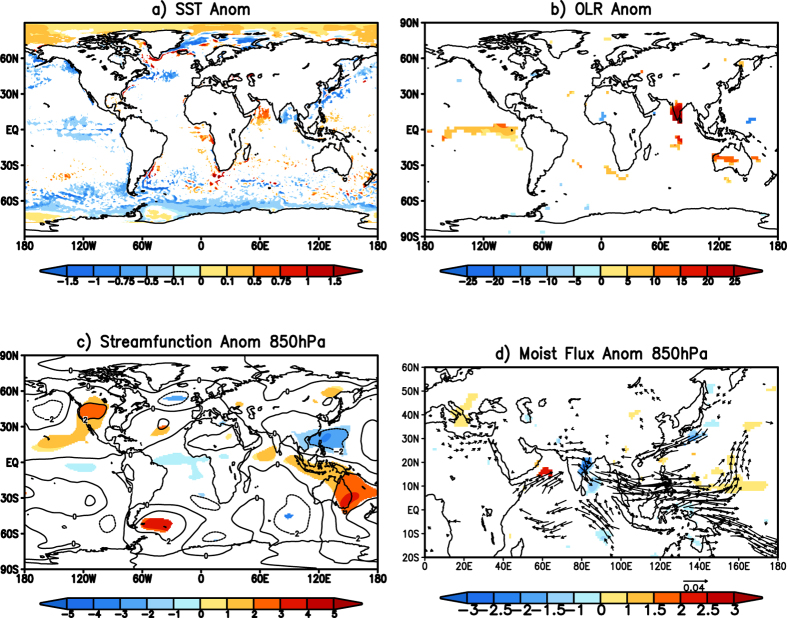
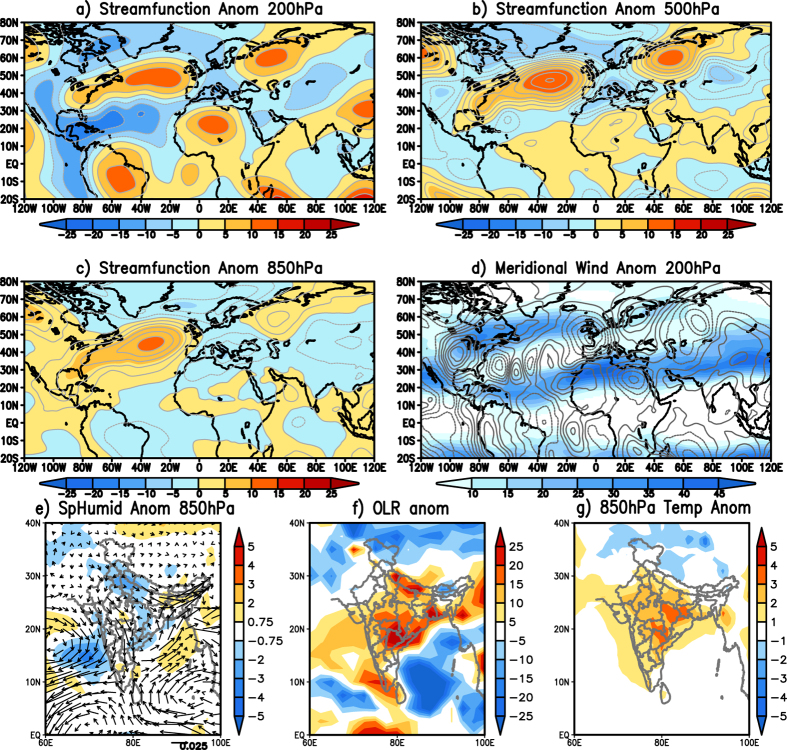
India suffers from major heatwaves during March-June. The rising trend of number of intense heatwaves in recent decades has been vaguely attributed to global warming. Since the heat waves have a serious effect on human mortality, root causes of these heatwaves need to be clarified. Based on the observed patterns and statistical analyses of the maximum temperature variability, we identified two types of heatwaves. The first-type of heatwave over the north-central India is found to be associated with blocking over the North Atlantic. The blocking over North Atlantic results in a cyclonic anomaly west of North Africa at upper levels. The stretching of vorticity generates a Rossby wave source of anomalous Rossby waves near the entrance of the African Jet. The resulting quasi-stationary Rossby wave-train along the Jet has a positive phase over Indian subcontinent causing anomalous sinking motion and thereby heatwave conditions over India. On the other hand, the second-type of heatwave over the coastal eastern India is found to be due to the anomalous Matsuno-Gill response to the anomalous cooling in the Pacific. The Matsuno-Gill response is such that it generates northwesterly anomalies over the landmass reducing the land-sea breeze, resulting in heatwaves.


Figures

Figure 1
Figure 1
(a) Standard deviation of the maximum temperature (Tmax). (b) First mode of EOF of Tmax anomalies (c) The second mode of EOF of Tmax anomalies. (d) The composite of the Tmax (°C) anomalies corresponding to the heat wave events over north and central India. (e) same as (d) but for events over the coastal eastern India. (f) Spatial distribution of heatwaves over India. Only significant (at 95% using Students 2 tailed t-test) values are shown in (d,e). The rectangular box in (ac,f) represents the region used to identify the heat wave events over India. (Figure was created using a free software Grid Analysis and Display System (GrADS) version 2.1.a3 (http://cola.gmu.edu/grads/downloads.php).
Figure 2
Figure 2
(a) Significant OLR (W/m2) anomalies of the composite of events over the north and central India. (b) same as (a) but for streamfunction (×106 m2s−1) anomalies at 200 hPa. (c) same as (b) but at 500 hPa level. (d,e) same as (a) but represent the vertical velocity anomalies (Pa s−1) at 500 hPa and the meridional wind (m/s) anomalies at 200 hPa respectively. (f) same (a) but represent Rossby wave source anomalies (shaded) and zonal wind at 200 hPa (g) same as (f) but represents the Rossby wave source (×10−11 s−2) anomalies (shaded) due to stretching term and zonal wind. (h) Significant wave activity flux anomalies at 200 hPa (vector) and the streamfunction anomalies are shaded for the heatwave events over the north and central India. (Figure was created using a free software Grid Analysis and Display System (GrADS) version 2.1.a3 (http://cola.gmu.edu/grads/downloads.php).
Figure 3
Figure 3
(a) Significant OLR (W/m2) anomalies of the composite of events over the east coast of India. (b,c) same as (a) but for streamfunction (×106 m2s−1) anomalies at 200 hPa and 850 hPa respectively. (d,e) same as (a) but for significant SST (°C) and Mean sea level pressure (mb) anomalies. (f) same as (a) but for the significant moisture flux (kg m−1 s−1) anomalies (vector) and the specific humidity (kg/kg) anomalies (shaded) at 850 hPa. (Figure was created using a free software Grid Analysis and Display System (GrADS) version 2.1.a3 (http://cola.gmu.edu/grads/downloads.php).
Figure 4
Figure 4
(a) Significant SST (°C) anomalies for the events over the east coast of India. (b) same as (a) but for OLR (W/m2) anomalies. (c) same as (a) but for streamfunction (×106 m2s−1) anomalies at 850 hPa. (d) Moisture flux (kg m−1 s−1) anomalies (vector) and specific humidity (kg/kg) anomalies (shaded) at 850 hPa. (Figure was created using a free software Grid Analysis and Display System (GrADS) version 2.1.a3 (http://cola.gmu.edu/grads/downloads.php).
Figure 5
Figure 5
(a) Eddy streamfunction (×106 m2s−1) anomalies at 200hPa averaged over 21st May2015 to 31 May 2015. (b,c) same as (a) but at 500 hPa and 850 hPa respectively. (d) 200 hPa meridional wind anomalies (contour) and zonal wind (shaded) averaged over 21st May 2015 to 31st May 2015. (e) same as (d) but 850 hPa specific humidity (Kg/Kg) anomalies (shaded) and moisture flux (kg m−1s−1) anomalies (vector). (f,g) same as (d) but OLR and 850 hPa temperature anomalies respectively. (Figure was created using a free software Grid Analysis and Display System (GrADS) version 2.1.a3 (http://cola.gmu.edu/grads/downloads.php).

References

    1. Confalonieri U. et al. Human health in Climate Change 2007: Impacts, Adaptation and Vulnerability. Contributions of working group II to the fourth assessment report of the intergovernmental panel on climate change (eds Parry M. L. et al. ), Ch. 8, 391–431 (Cambridge university press, 2007).
    1. Mishra V., Ganguly A. R., Nijssen B. & Lettenmaier D. P. Changes in observed climate extremes in global urban areas. Environ. Res. Lett. 10(2), 024005 10.1088/1748-9326/10/2/024005 (2015). - DOI
    1. IPCC, 2007: Summary for Policymakers In Climate Change 2007: The Physical Science Basis. Contribution of Working Group I to the Fourth Assessment Report of the Intergovernmental Panel on Climate Change (eds Solomon S. et al. ), 1–18 (Cambridge University Press, Cambridge, 2007).
    1. Murari K. K., Ghosh S., Patwardhan A., Daly E. & Salvi K. Intensification of future severe heat waves in India and their effect on heat stress and mortality. Reg. Environ Change 15, 569–579; 10.1007/s10113-014-0660-6 (2015). - DOI
    1. De U. S. & Mukhopadhyay R. K. Severe heat wave over Indian subcontinent in 1998 in a perspective of global climate. Current Science 75, 1308–1311 (1998).

Publication types

LinkOut - more resources