

Intermedin Restores Hyperhomocysteinemia-induced Macrophage Polarization and Improves Insulin Resistance in Mice
- PMID: 27080257
- PMCID: PMC4933280
- DOI: 10.1074/jbc.M115.702654
Intermedin Restores Hyperhomocysteinemia-induced Macrophage Polarization and Improves Insulin Resistance in Mice
Abstract
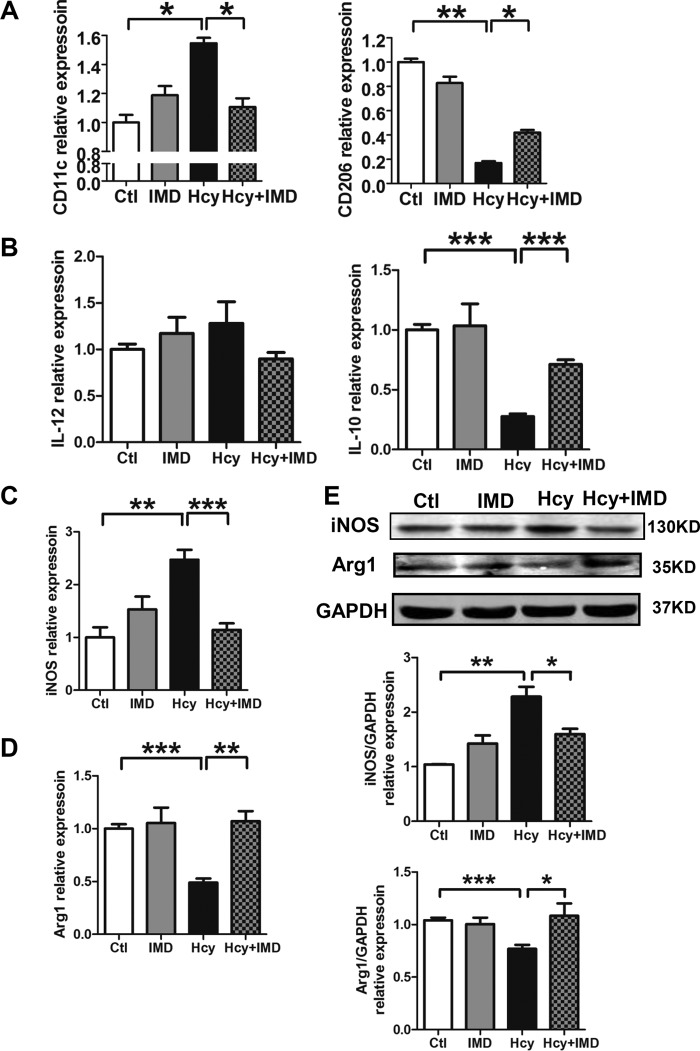
Hyperhomocysteinemia (HHcy) is a condition characterized by an abnormally high level of homocysteine, an inflammatory factor. This condition has been suggested to promote insulin resistance. To date, the underlying molecular mechanism remains largely unknown, and identifying novel therapeutic targets for HHcy-induced insulin resistance is of high priority. It is well known that intermedin (IMD), a calcitonin family peptide, exerts potent anti-inflammatory effects. In this study, the effects of IMD on HHcy-induced insulin resistance were investigated. Glucose tolerance and insulin tolerance tests were performed on mice treated with IMD by minipump implantation (318 ng/kg/h for 4 weeks) or adipocyte-specific IMD overexpression mice (Adipo-IMD transgenic mice). The expression of genes and proteins related to M1/M2 macrophages and endoplasmic reticulum stress (ERS) was evaluated in adipose tissues or cells. The expression of IMD was identified to be lower in the plasma and adipose tissues of HHcy mice. In both IMD treatment by minipump implantation and Adipo-IMD transgenic mice, IMD reversed HHcy-induced insulin resistance, as revealed by glucose tolerance and insulin tolerance tests. Further mechanistic study revealed that IMD reversed the Hcy-elevated ratio of M1/M2 macrophages by inhibiting AMP-activated protein kinase activity. Adipo-IMD transgenic mice displayed reduced ERS and lower inflammation in adipose tissues with HHcy. Soluble factors from Hcy-treated macrophages induced adipocyte ERS, which was reversed by IMD treatment. These findings revealed that IMD treatment restores the M1/M2 balance, inhibits chronic inflammation in adipose tissues, and improves systemic insulin sensitivity of HHcy mice.
Keywords: AMP-activated kinase (AMPK); adipose tissue; homocysteine; insulin resistance; macrophage.
© 2016 by The American Society for Biochemistry and Molecular Biology, Inc.
Figures


Similar articles
-
Hyperhomocysteinemia promotes insulin resistance by inducing endoplasmic reticulum stress in adipose tissue.J Biol Chem. 2013 Apr 5;288(14):9583-9592. doi: 10.1074/jbc.M112.431627. Epub 2013 Feb 17. J Biol Chem. 2013. PMID: 23417716 Free PMC article.
-
Hyperhomocysteinemia Promotes Insulin Resistance and Adipose Tissue Inflammation in PCOS Mice Through Modulating M2 Macrophage Polarization via Estrogen Suppression.Endocrinology. 2017 May 1;158(5):1181-1193. doi: 10.1210/en.2017-00039. Endocrinology. 2017. PMID: 28323956
-
The Prostaglandin E2 Receptor EP4 Regulates Obesity-Related Inflammation and Insulin Sensitivity.PLoS One. 2015 Aug 26;10(8):e0136304. doi: 10.1371/journal.pone.0136304. eCollection 2015. PLoS One. 2015. PMID: 26308623 Free PMC article.
-
Exercise mitigates the adverse effects of hyperhomocysteinemia on macrophages, MMP-9, skeletal muscle, and white adipocytes.Can J Physiol Pharmacol. 2014 Jul;92(7):575-82. doi: 10.1139/cjpp-2014-0059. Epub 2014 May 22. Can J Physiol Pharmacol. 2014. PMID: 24923386 Review.
-
Implication of Hyperhomocysteinemia in Blood Retinal Barrier (BRB) Dysfunction.Biomolecules. 2020 Jul 29;10(8):1119. doi: 10.3390/biom10081119. Biomolecules. 2020. PMID: 32751132 Free PMC article. Review.
Cited by
-
Improvement of Adipose Macrophage Polarization in High Fat Diet-Induced Obese GHSR Knockout Mice.Biomed Res Int. 2018 Jul 10;2018:4924325. doi: 10.1155/2018/4924325. eCollection 2018. Biomed Res Int. 2018. PMID: 30112394 Free PMC article.
-
Integrated Omics Reveal Dendrobium nobile Lindl.'s Anti-Diabetic Mechanisms via Arginine/Proline and Glycerophospholipid Pathways.Pharmaceuticals (Basel). 2025 Jul 18;18(7):1061. doi: 10.3390/ph18071061. Pharmaceuticals (Basel). 2025. PMID: 40732347 Free PMC article.
-
Inhibition of endoplasmic reticulum stress by intermedin1-53 attenuates angiotensin II-induced abdominal aortic aneurysm in ApoE KO Mice.Endocrine. 2018 Oct;62(1):90-106. doi: 10.1007/s12020-018-1657-6. Epub 2018 Jun 26. Endocrine. 2018. PMID: 29943223
-
The role of hypoxia-inducible factors in metabolic diseases.Nat Rev Endocrinol. 2018 Dec;15(1):21-32. doi: 10.1038/s41574-018-0096-z. Nat Rev Endocrinol. 2018. PMID: 30275460 Free PMC article. Review.
-
Adrenomedullin 2 Enhances Beiging in White Adipose Tissue Directly in an Adipocyte-autonomous Manner and Indirectly through Activation of M2 Macrophages.J Biol Chem. 2016 Nov 4;291(45):23390-23402. doi: 10.1074/jbc.M116.735563. Epub 2016 Sep 12. J Biol Chem. 2016. PMID: 27621315 Free PMC article.
References
-
- Roh J., Chang C. L., Bhalla A., Klein C., and Hsu S. Y. (2004) Intermedin is a calcitonin/calcitonin gene-related peptide family peptide acting through the calcitonin receptor-like receptor/receptor activity-modifying protein receptor complexes. J. Biol. Chem. 279, 7264–7274 - PubMed
-
- Takei Y., Hyodo S., Katafuchi T., and Minamino N. (2004) Novel fish-derived adrenomedullin in mammals: structure and possible function. Peptides 25, 1643–1656 - PubMed
-
- Li Y., Jiang C., Wang X., Zhang Y., Shibahara S., and Takahashi K. (2007) Adrenomedullin is a novel adipokine: adrenomedullin in adipocytes and adipose tissues. Peptides 28, 1129–1143 - PubMed
-
- Nomura I., Kato J., Tokashiki M., and Kitamura K. (2009) Increased plasma levels of the mature and intermediate forms of adrenomedullin in obesity. Regul. Pept. 158, 127–131 - PubMed
-
- Shimosawa T., Ogihara T., Matsui H., Asano T., Ando K., and Fujita T. (2003) Deficiency of adrenomedullin induces insulin resistance by increasing oxidative stress. Hypertension 41, 1080–1085 - PubMed
Publication types
MeSH terms
Substances
LinkOut - more resources
Full Text Sources
Other Literature Sources
