Review
. 2016 May;32(5):269-283.
doi: 10.1016/j.tig.2016.03.001. Epub 2016 Apr 12.

Evolution of Epigenetic Regulation in Vertebrate Genomes

Affiliations
Review

Evolution of Epigenetic Regulation in Vertebrate Genomes

Rebecca F Lowdon et al. Trends Genet. 2016 May.

Abstract

Empirical models of sequence evolution have spurred progress in the field of evolutionary genetics for decades. We are now realizing the importance and complexity of the eukaryotic epigenome. While epigenome analysis has been applied to genomes from single-cell eukaryotes to human, comparative analyses are still relatively few and computational algorithms to quantify epigenome evolution remain scarce. Accordingly, a quantitative model of epigenome evolution remains to be established. We review here the comparative epigenomics literature and synthesize its overarching themes. We also suggest one mechanism, transcription factor binding site (TFBS) turnover, which relates sequence evolution to epigenetic conservation or divergence. Lastly, we propose a framework for how the field can move forward to build a coherent quantitative model of epigenome evolution.

Keywords: epigenome evolution; gene regulation; vertebrate genomics.


Figures

Figure 1
Figure 1. Dynamic epigenetic interactions
Innovation in sequence resolution and identification of novel DNA-modifying mechanisms have provided novel opportunities to develop intricate techniques to explore epigenetic interactions. This review focuses on four unique, but usually complementary, epigenetic modifications that are universally shared across vertebrates. Different types of modifications can have processive function, allowing expression of genes, or recessive function, hindering gene expression, or an intermediate poised state that has potential to go either direction. The biological function of individual epigenetic marks has been widely studied but the combinatorial interactions across epigenetic modifications have still yet to be fully defined and understood. Here, we diagram simplified models to illustrate how results of epigenetics assays can be interpreted in the resolution of DNA-context and chromatin-context. [–104]
Figure 2
Figure 2. Genetic and epigenetic conservation correlation
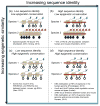
The degree of sequence or epigenetic similarity between syntenic loci each run on a continuum. Here we define epigenetic similarity as having the same epigenetic signal at orthologous loci between the two species. While there are many degrees of variation within each of these four possibilities, we offer this general framework and examples from the literature for each combination of extremes. (a) Loci with low sequence identity and low epigenetic similarity may represent lineage-specific loci and include non-orthologous regions. (b) A minority of orthologs demonstrate faster epi-mark divergence than sequence divergence. (c) Orthologs where the genome sequence is diverging faster than the epigenetic state represent loci that experienced enhancer turnover. Additionally, some marks are found in both fast and slowing evolving sequences, suggesting a mechanism for buffering genetic variation. (d) The majority of examples we can categorize exhibit both sequence conservation and epigenetic conservation. This is the status for most orthologs (inter- and intra-species) and represents the null hypothesis. Legend as in Figure 1; the intensity of shading of DNA strands represents the degree of sequence conservation.
Figure 3
Figure 3. TFBS turnover models and examples
Understanding TFBS turnover during evolution has been a non-trivial challenge. Since TFBS turnover is coupled with epigenetic changes, a null hypothesis that TFBS turnover is also associated with epigenetic evolution across species can be proposed. Although numerous examples of TFBS turnover has been documented, we propose two simple but powerful scenarios that can capture the process of TFBS turnover by comparing epigenetic signal across orthologous regions across species. The diagram illustrates an orthologous gene region across three species. This can be interpreted differently by varying the window size or synteny. First scenario represents loss-gain TFBS turnover where species 1 had a TFBS but species 2 lost the TFBS by a single mutation in the binding site. However, in species 3, another genomic region was mutated to recover the lost TFBS and become the new enhancer. The second scenario is a competitive model where species 2 gained a mutation that generated another TFBS that competed with the species 1 enhancer. After selection or mutation, the species 1 enhancer is lost and the novel enhancer becomes the sole cis-regulator for the gene in species 3. This mechanism may mediate lineage-specific epigenetic marks [21,72,75,76,78] or conserve epigenetic features as in (b) and (c) [47]. (b) and (c) are representative examples of TFBS turnover events mediating a conserved tissue-specific DNA hypomethylated regions (pink shaded boxes) between rat, mouse, and human (adapted from Zhou, unpublished). Tracks in blue are single-CpG DNA methylation levels from the given tissue in each species. In (b) the Erg motif is found at the same position in rat and mouse, but shifted by 84bp in human. The Erg motif conserved the blood-specific DMR at this locus and is an example of senario 1 depicted in (a). In (c), The Fli1 motif is in a slightly different position in the conserved blood-specific DMR in rat and mouse, but absent in human. Instead the Fli1 motif is found in a nearby blood-specific DMR in human. Importantly, the conserved DMRs in these examples show low sequence conservation, evidence that conserved DNA hypomethylated regions do not depend on sequence conservation.
Figure 4
Figure 4. Model for building a theory of epigenome evolution
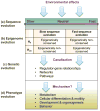
(a) Determining the rate of sequence evolution is now a straightforward process. (b) The expectation for epigenome evolution is different depending on the sequence evolution context. Completing this contingency table with specific examples is a challenge for the field. (c) Epigenetic gene regulation that is adaptive is genetically assimilated into the genome, codifying gene regulation and driving genetic evolution. (d) Genetic networks drive phenotypic evolution, all of which is motivated by environmental inputs.

References

    1. Montavon T, Duboule D. Chromatin organization and global regulation of Hox gene clusters. Philosophical Transactions of the Royal Society of London B: Biological Sciences. 2013;368:20120367–20120367. - PMC - PubMed
    1. Lukas J, et al. More than just a focus: The chromatin response to DNA damage and its role in genome integrity maintenance. Nat Cell Biol. 2011;13:1161–1169. - PubMed
    1. Okamoto I, et al. Eutherian mammals use diverse strategies to initiate X-chromosome inactivation during development. Nature. 2011;472:370–374. - PubMed
    1. Chow J, Heard E. X inactivation and the complexities of silencing a sex chromosome. Current Opinion in Cell Biology. 2009;21:359–366. - PubMed
    1. Leeb M, Wutz A. Establishment of epigenetic patterns in development. Chromosoma. 2012;121:251–262. - PMC - PubMed

LinkOut - more resources