

Unique fractal evaluation and therapeutic implications of mitochondrial morphology in malignant mesothelioma
- PMID: 27080907
- PMCID: PMC4832330
- DOI: 10.1038/srep24578
Unique fractal evaluation and therapeutic implications of mitochondrial morphology in malignant mesothelioma
Abstract
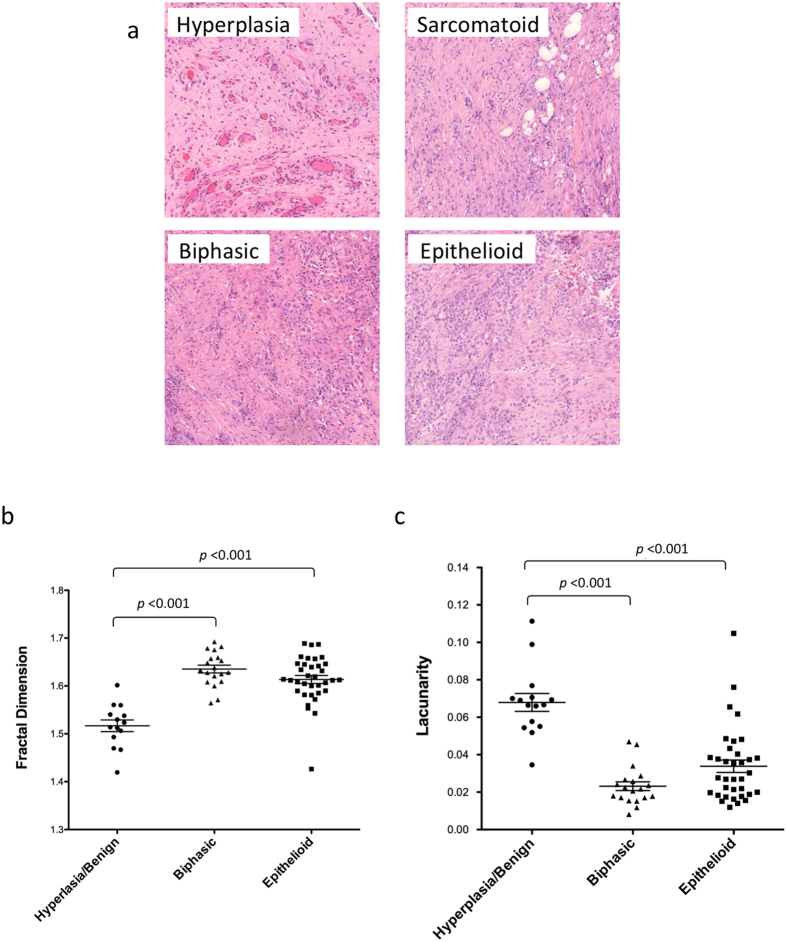
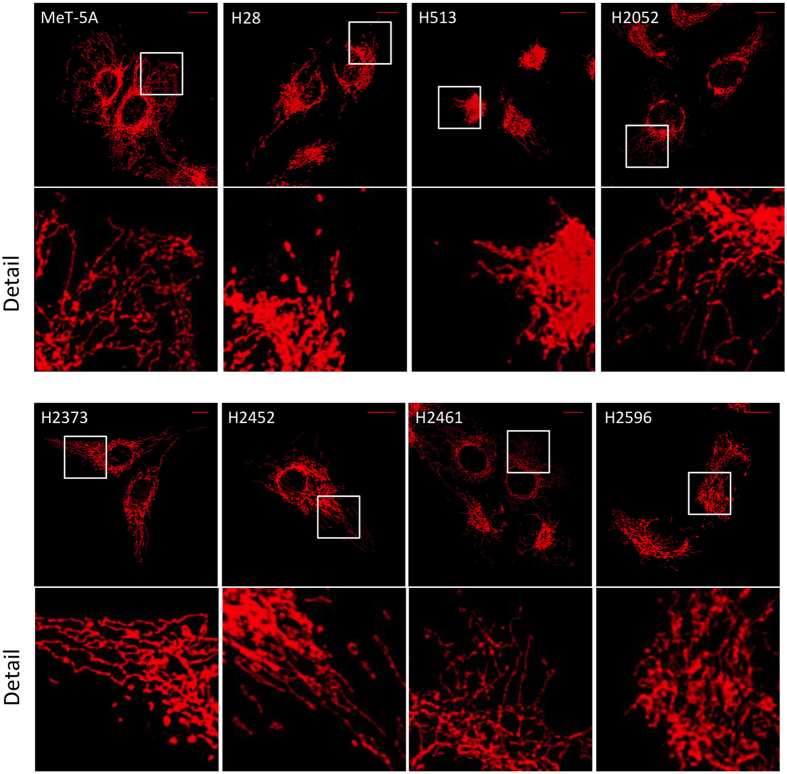
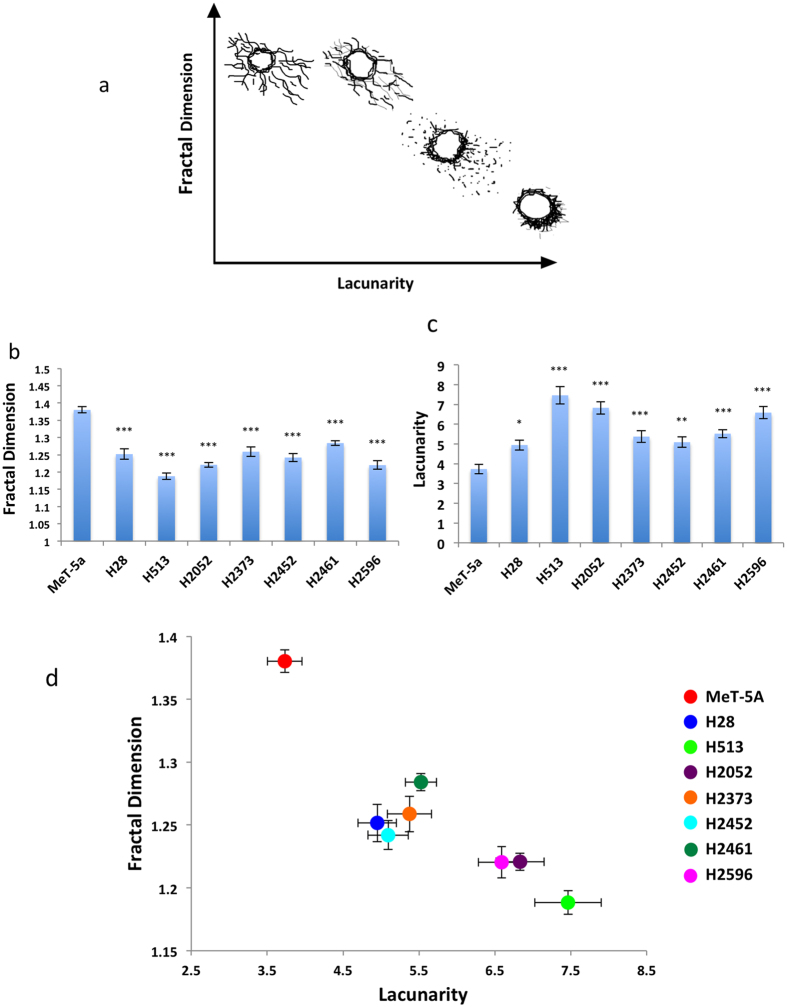
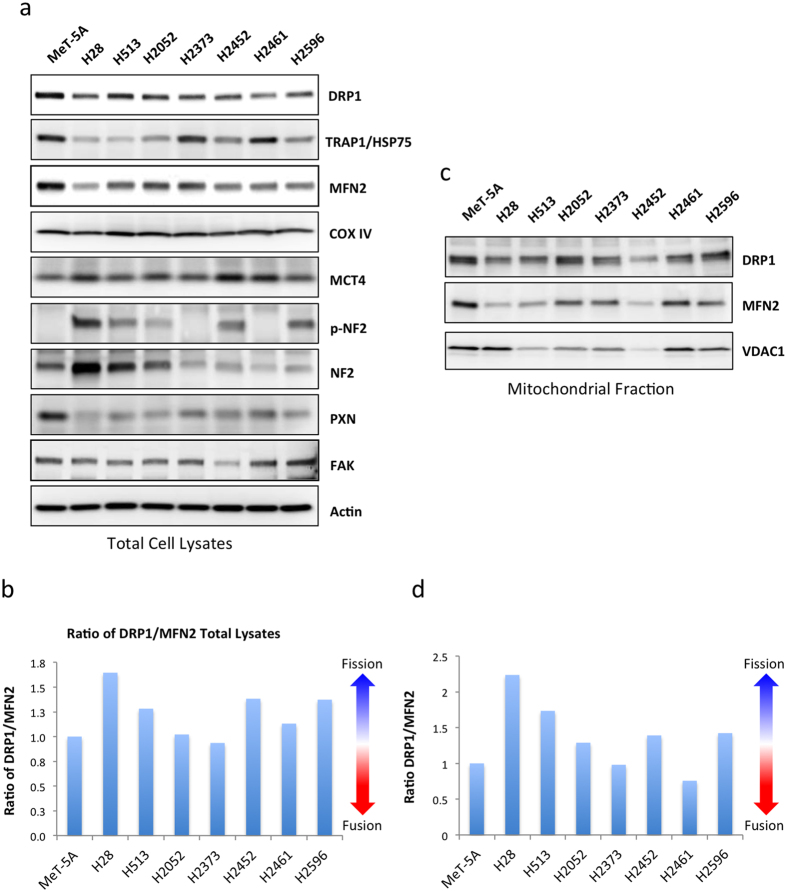
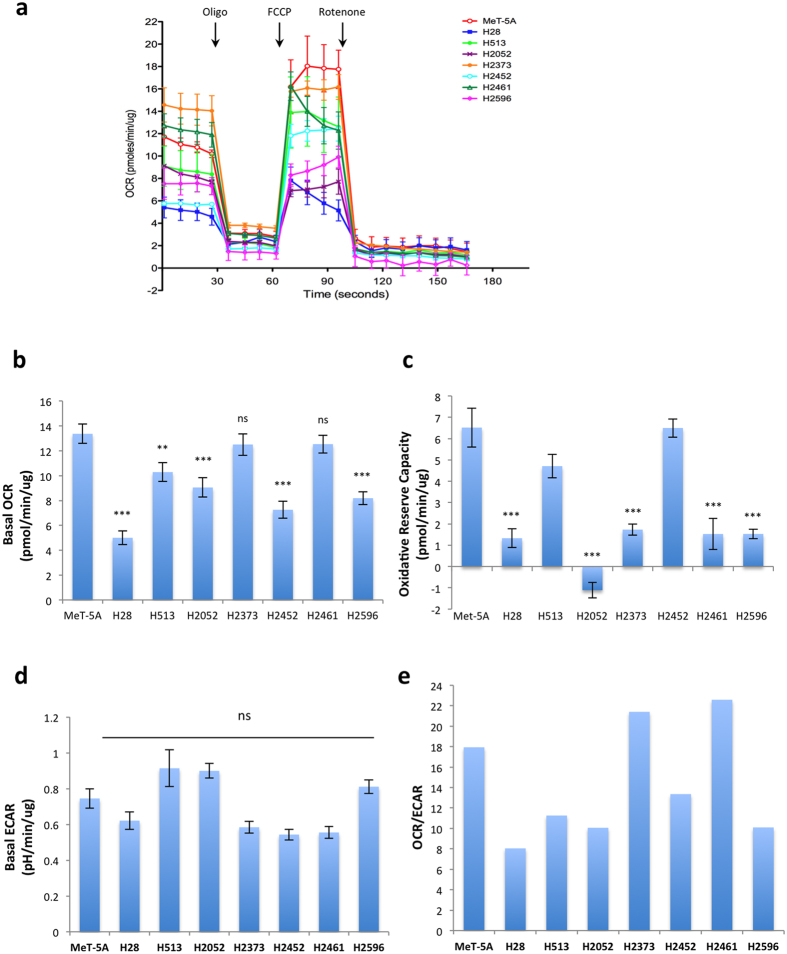
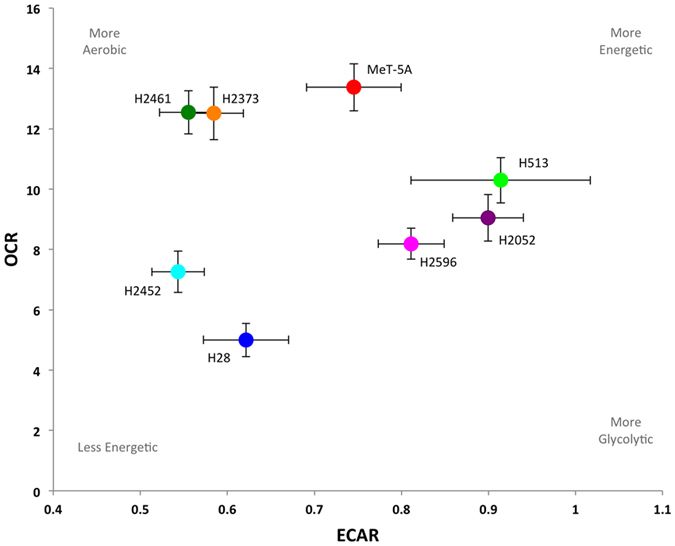
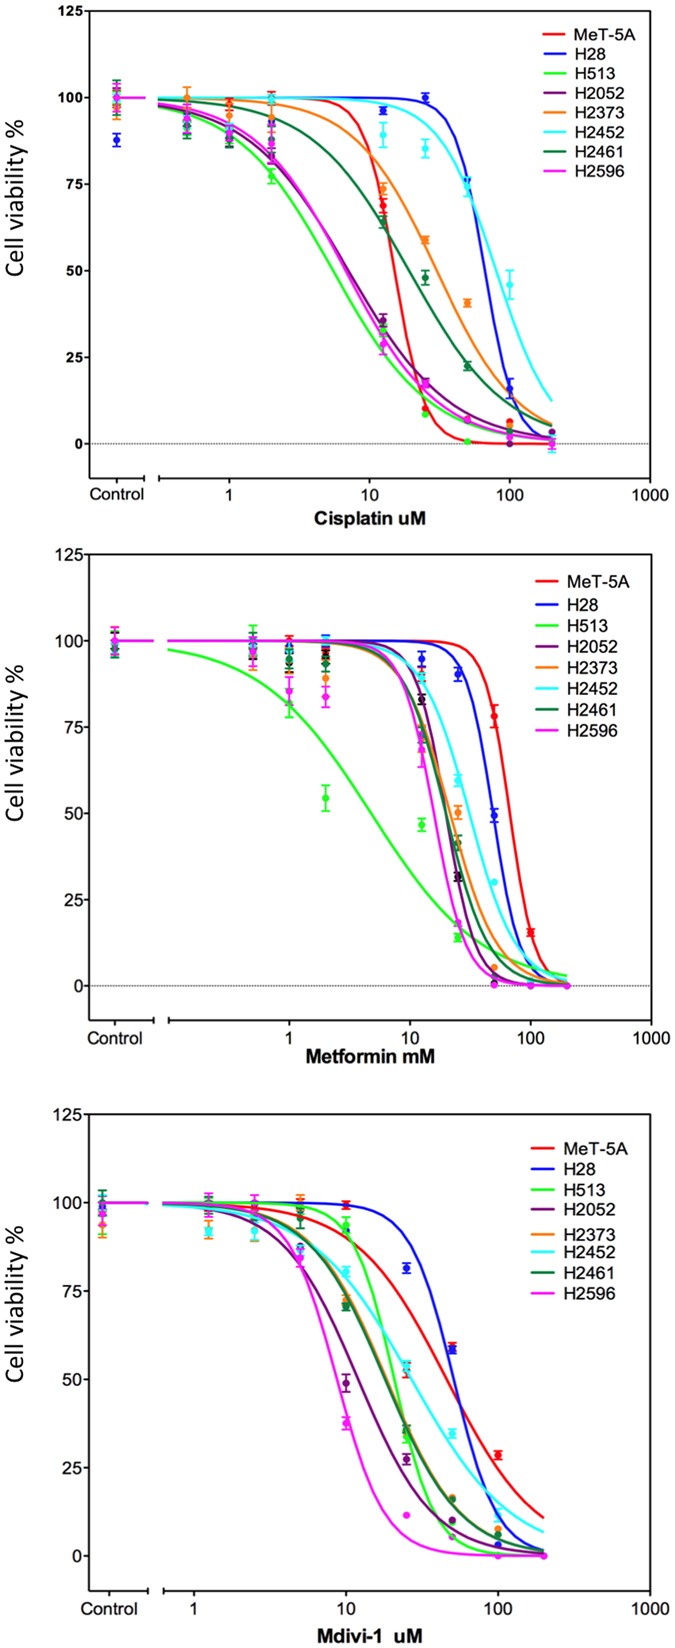
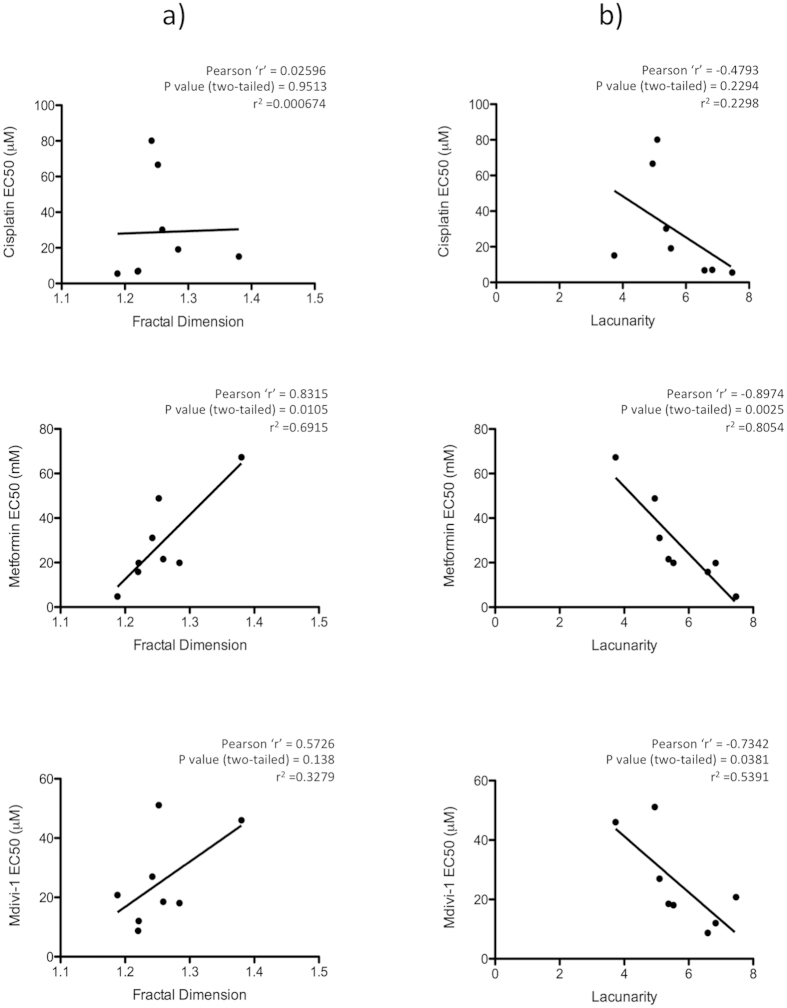
Malignant mesothelioma (MM), is an intractable disease with limited therapeutic options and grim survival rates. Altered metabolic and mitochondrial functions are hallmarks of MM and most other cancers. Mitochondria exist as a dynamic network, playing a central role in cellular metabolism. MM cell lines display a spectrum of altered mitochondrial morphologies and function compared to control mesothelial cells. Fractal dimension and lacunarity measurements are a sensitive and objective method to quantify mitochondrial morphology and most importantly are a promising predictor of response to mitochondrial inhibition. Control cells have high fractal dimension and low lacunarity and are relatively insensitive to mitochondrial inhibition. MM cells exhibit a spectrum of sensitivities to mitochondrial inhibitors. Low mitochondrial fractal dimension and high lacunarity correlates with increased sensitivity to the mitochondrial inhibitor metformin. Lacunarity also correlates with sensitivity to Mdivi-1, a mitochondrial fission inhibitor. MM and control cells have similar sensitivities to cisplatin, a chemotherapeutic agent used in the treatment of MM. Neither oxidative phosphorylation nor glycolytic activity, correlated with sensitivity to either metformin or mdivi-1. Our results suggest that mitochondrial inhibition may be an effective and selective therapeutic strategy in mesothelioma, and identifies mitochondrial morphology as a possible predictor of response to targeted mitochondrial inhibition.
Figures
Similar articles
-
Negative modulation of mitochondrial oxidative phosphorylation by epigallocatechin-3 gallate leads to growth arrest and apoptosis in human malignant pleural mesothelioma cells.Biochim Biophys Acta. 2013 Dec;1832(12):2085-96. doi: 10.1016/j.bbadis.2013.07.014. Epub 2013 Aug 2. Biochim Biophys Acta. 2013. PMID: 23911347
-
Pifithrin-μ induces necroptosis through oxidative mitochondrial damage but accompanies epithelial-mesenchymal transition-like phenomenon in malignant mesothelioma cells under lactic acidosis.Arch Pharm Res. 2019 Oct;42(10):890-901. doi: 10.1007/s12272-019-01181-6. Epub 2019 Aug 19. Arch Pharm Res. 2019. PMID: 31428976
-
Peroxiredoxin 3 levels regulate a mitochondrial redox setpoint in malignant mesothelioma cells.Redox Biol. 2014;3:79-87. doi: 10.1016/j.redox.2014.11.003. Epub 2014 Nov 18. Redox Biol. 2014. PMID: 25462069 Free PMC article.
-
Prognostic factors in malignant pleural mesothelioma.Hum Pathol. 2015 Jun;46(6):789-804. doi: 10.1016/j.humpath.2015.02.006. Epub 2015 Feb 28. Hum Pathol. 2015. PMID: 25824607 Review.
-
Novel therapies for malignant pleural mesothelioma.Lancet Oncol. 2018 Mar;19(3):e161-e172. doi: 10.1016/S1470-2045(18)30100-1. Lancet Oncol. 2018. PMID: 29508763 Review.
Cited by
-
Prognostic Significance of Lacunarity in Preoperative Biopsy of Colorectal Cancer.Pathol Oncol Res. 2020 Oct;26(4):2567-2576. doi: 10.1007/s12253-020-00851-x. Epub 2020 Jul 2. Pathol Oncol Res. 2020. PMID: 32617959
-
Universal fractality of morphological transitions in stochastic growth processes.Sci Rep. 2017 Jun 14;7(1):3523. doi: 10.1038/s41598-017-03491-5. Sci Rep. 2017. PMID: 28615671 Free PMC article.
-
Adhesion-mediated mechanosignaling forces mitohormesis.Cell Metab. 2021 Jul 6;33(7):1322-1341.e13. doi: 10.1016/j.cmet.2021.04.017. Epub 2021 May 20. Cell Metab. 2021. PMID: 34019840 Free PMC article.
-
Microtubule-Based Mitochondrial Dynamics as a Valuable Therapeutic Target in Cancer.Cancers (Basel). 2021 Nov 19;13(22):5812. doi: 10.3390/cancers13225812. Cancers (Basel). 2021. PMID: 34830966 Free PMC article. Review.
-
Inhibiting crosstalk between MET signaling and mitochondrial dynamics and morphology: a novel therapeutic approach for lung cancer and mesothelioma.Cancer Biol Ther. 2018;19(11):1023-1032. doi: 10.1080/15384047.2018.1472193. Epub 2018 Oct 12. Cancer Biol Ther. 2018. PMID: 30311833 Free PMC article.
References
-
- Mineo T. C. & Ambrogi V. Malignant pleural mesothelioma: factors influencing the prognosis. Oncology 26, 1164–1175 (2012). - PubMed
Publication types
MeSH terms
Substances
Grants and funding
LinkOut - more resources
Full Text Sources
Other Literature Sources
Medical
