. 2016 Apr 15;352(6283):366-70.
doi: 10.1126/science.aad9272.

Developing a pro-regenerative biomaterial scaffold microenvironment requires T helper 2 cells

Affiliations

Developing a pro-regenerative biomaterial scaffold microenvironment requires T helper 2 cells

Kaitlyn Sadtler et al. Science. .

Abstract

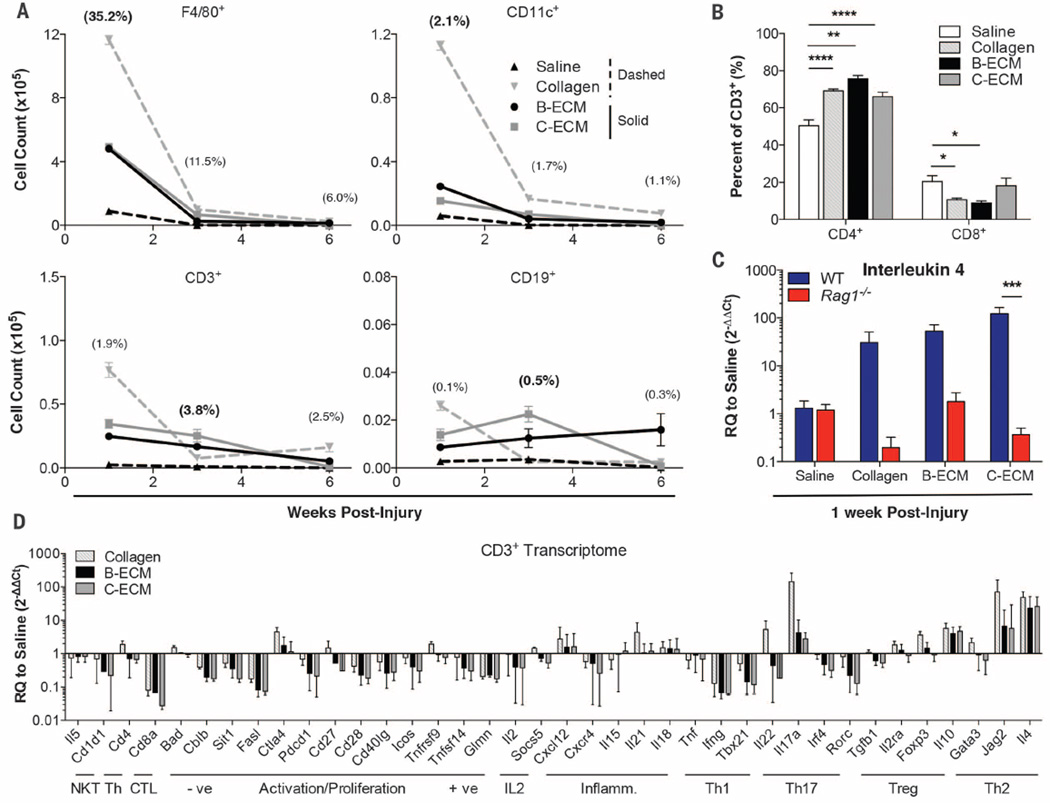
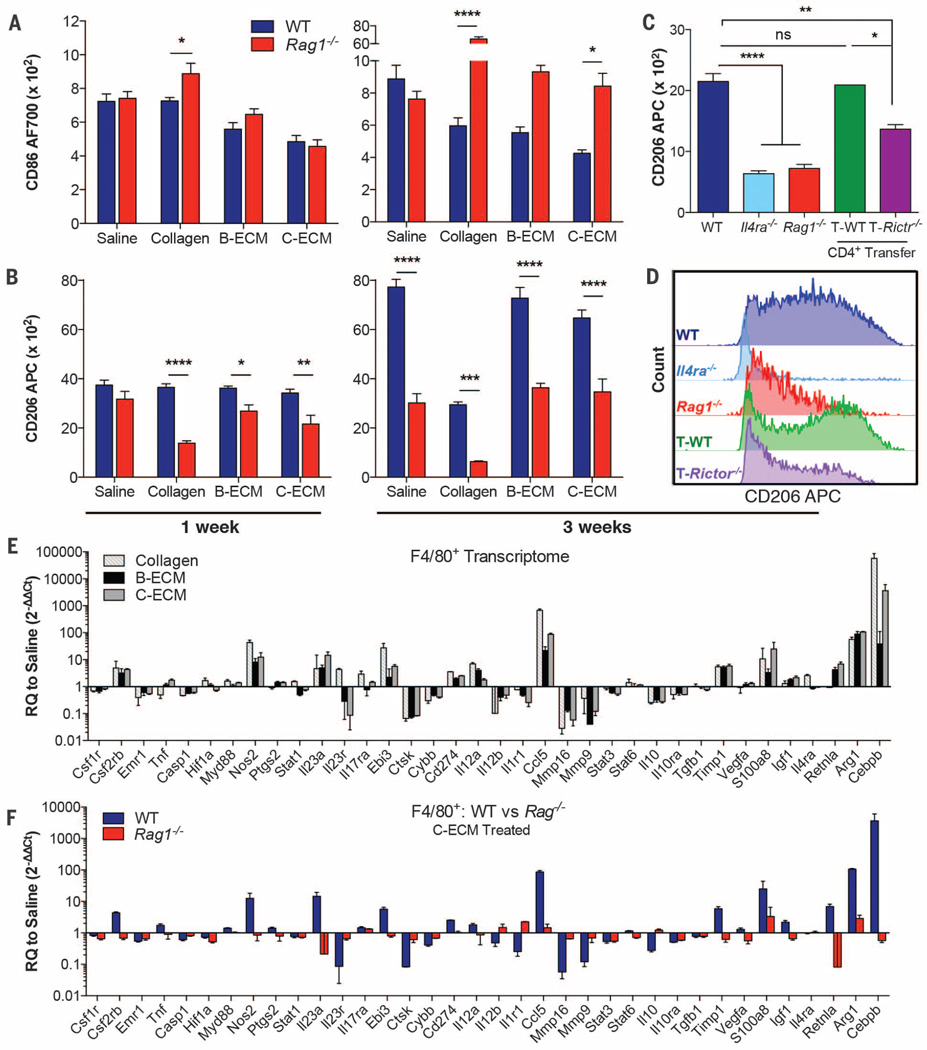
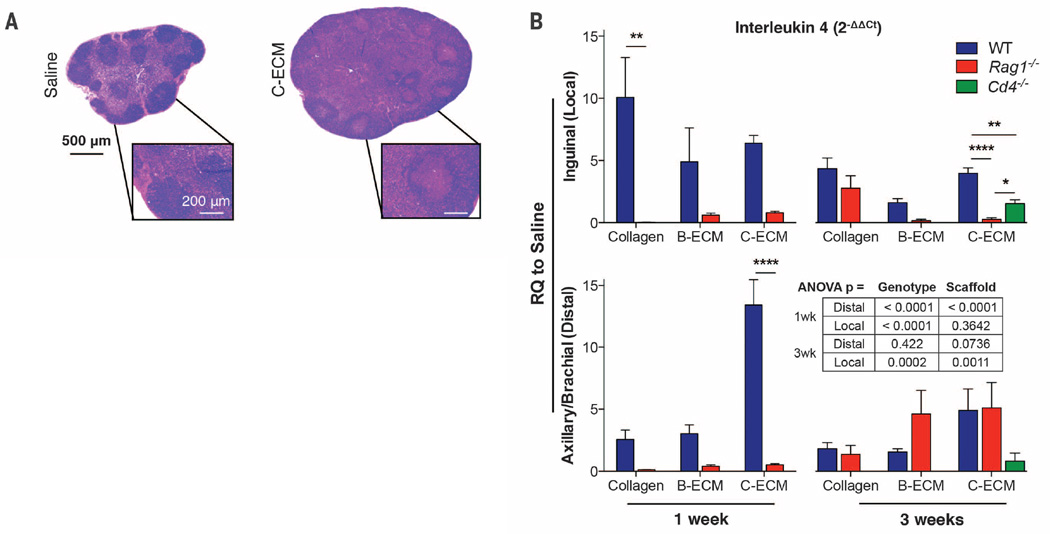
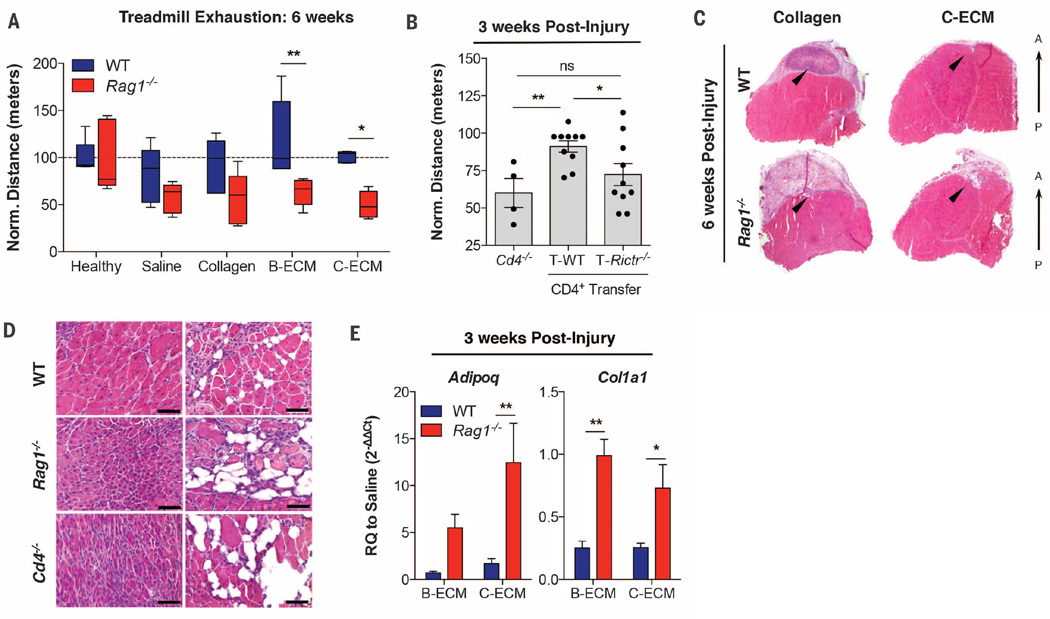
Immune-mediated tissue regeneration driven by a biomaterial scaffold is emerging as an innovative regenerative strategy to repair damaged tissues. We investigated how biomaterial scaffolds shape the immune microenvironment in traumatic muscle wounds to improve tissue regeneration. The scaffolds induced a pro-regenerative response, characterized by an mTOR/Rictor-dependent T helper 2 pathway that guides interleukin-4-dependent macrophage polarization, which is critical for functional muscle recovery. Manipulating the adaptive immune system using biomaterials engineering may support the development of therapies that promote both systemic and local pro-regenerative immune responses, ultimately stimulating tissue repair.


Figures

Fig. 1
Fig. 1. Biomaterial scaffolds induce a TH2 response in volumetric muscle wounds
C57BL/6 (WT) and Rag1−/− mice received a critical-size quadriceps muscle injury and were treated immediately with 0.05 ml of saline, particulate collagen, B-ECM, or C-ECM. (A) Proportions of myeloid (F4/80+ macrophages and CD11c+ dendritic cells) and lymphoid (CD3+ T cells and CD19+ B cells) cell populations in the WT wound environment, determined by flow cytometry (% = mean fraction of live cells across all treatments, with peak level shown in bold text). The greatest cell numbers were in scaffold-treated wounds. (B) Proportion of CD3+ T cells that are CD4+ TH cells or CD8+ cytotoxic T lymphocytes at 1 week after injury treated with saline, collagen, B-ECM, or C-ECM by flow cytometry. (C) qRT-PCR analysis of Il4 gene expression in WT and Rag1−/− mice at 1 week after injury. (D) One week after injury, transcriptome of CD3 cells sorted from wounded muscles treated with saline, collagen, B-ECM, or C-ECM, determined by qRT-PCR. Data are displayed as relative quantification (RQ) to saline-treated wounds. Data are means ± SEM, n = 4 mice (2 legs pooled per mouse, representative of at least two independent experiments), analysis of variance (ANOVA): ****P < 0.0001, ***P < 0.001, **P < 0.01, *P < 0.05.
Fig. 2
Fig. 2. M(IL-4) pro-regenerative myeloid polarization induced by scaffolds is TH2-dependent
(A and B) Macrophages in wounded muscle were characterized for CD86 (A) and CD206 (B) expression by flow cytometry at 1 and 3 weeks after injury in the presence of saline or ECM scaffold in WT (blue bars) and Rag1−/− (red bars) mice. The mean of fluorescence is shown. (C) CD206 expression at 3 weeks after injury in C-ECM–treated WT, Il4ra−/−, Rag1−/−, and Rag1−/− mice reconstituted with either WT CD4+ T cells (T-WT, n = 2) or Rictor−/− CD4+ T cells (T-Rictr−/−;TH2-deficient). (D) Representative comparison of CD206 expression between WT, Il4ra−/−, Rag1−/−, and Rag1−/− reconstituted with WT and Rictor−/− CD4+ T cells. (E) qRT-PCR gene expression analysis in cell-sorted macrophages from wounded muscles 1 week after injury and treated with collagen (light gray–striped bars), B-ECM (black solid bars), or C-ECM (gray solid bars) compared to saline control. RQ to saline = 2−ΔΔCt. (F) RQ to saline in WT and Rag1−/− mice when wounds were treated with C-ECM. The figure shows a loss of scaffold-mediated macrophage polarization in Rag1−/− mice. WT, blue bars; Rag1−/−, red bars. Data are means ± SEM, n = 4 mice unless otherwise stated (representative of one or two independent experiments); ANOVA [(A) and (B)] and Student’s t test (D): ****P <0.0001, ***P <0.001, **P <0.01, *P <0.05.
Fig. 3
Fig. 3. Systemic immune homeostasis is modified by application of biomaterial scaffolds
(A) Inguinal lymph node morphology at 1 week after injury in saline- (left) and C-ECM– (right) treated WT animals. Hematoxylin and eosin (H&E) staining is shown. (B) qRT-PCR analysis of Il4 gene expression in local draining lymph nodes (inguinal, top bar graphs) and distal lymph nodes (axillary/brachial, bottom bar graphs) in WT, Rag1−/−, and Cd4−/− mice at 1 and 3 weeks after wound treatment with collagen, B-ECM, or C-ECM. RQ to saline is 2−ΔΔCt. Data are means ± SEM, n = 4 mice (representative of at least two independent experiments), ANOVA: ****P < 0.0001, **P < 0.01, *P < 0.05.
Fig. 4
Fig. 4. TH2/M(IL-4) responses to biomaterial-treated muscle wound promote functional tissue regeneration
(A) Treadmill exhaustion assay of mice at 6 weeks after injury to test muscle function in WT (blue bars) and Rag1−/− (red bars) mice. Results are normalized to the distance run by an uninjured control (100 m). n = 5 mice per condition and genotype. (B) Treadmill exhaustion at 3 weeks in Cd4−/−, and Rag1−/− mice repopulated with WT (T-WT) or Rictor−/− (T-Rictr−/−; TH2 deficient) CD4+ T cells. n = 4 mice (Cd4−/−) or n = 10 mice (T-WT and T-Rictr−/−) (C) Transverse section of quadriceps muscle at 6 weeks after injury in collagen- and C-ECM–treated WT and Rag1−/− mice. The black arrowheads indicate the injury/treatment area. A, anterior, P, posterior, with H&E staining shown. (D) C-ECM–treated VML at 3 weeks after injury in WT, Rag1−/−, and Cd4−/− mice stained with H&E. Small muscle fibers and ectopic adipogenesis are present in Rag1−/− and Cd4−/− wounds. Scale bars, 50 µm. (E) Gene expression (qRT-PCR) of Adipoq (adipose marker) and Col1a1 (collagen I) showing increased adipose gene expression in Rag1−/− as well as increased collagen gene expression, suggesting alterations in connective tissue deposition and possible scarring. n = 4 mice unless otherwise stated (representative of at least two independent experiments). Data are means ± SEM; ANOVA [(A) and (D)] and Student’s t test (E): ****P <0.0001, ***P < 0.001, **P < 0.01, *P < 0.05.

Comment in

References

    1. Wynn TA, Chawla A, Pollard JW. Nature. 2013;496:445–455. - PMC - PubMed
    1. Matzinger P, Kamala T. Nat. Rev. Immunol. 2011;11:221–230. - PubMed
    1. Peng Y, et al. J Autoimmun. 2007;29:303–309. - PMC - PubMed
    1. Otis JS, et al. PLOS One. 2014;9:e92363. - PMC - PubMed
    1. Frantz S, Vincent KA, Feron O, Kelly RA. Circ. Res. 2005;96:15–26. - PubMed

Publication types

MeSH terms