. 2016 Sep;57(9):1413-9.
doi: 10.2967/jnumed.115.169417. Epub 2016 Apr 14.

Differential Receptor Tyrosine Kinase PET Imaging for Therapeutic Guidance

Affiliations

Differential Receptor Tyrosine Kinase PET Imaging for Therapeutic Guidance

Eric Wehrenberg-Klee et al. J Nucl Med. 2016 Sep.

Abstract

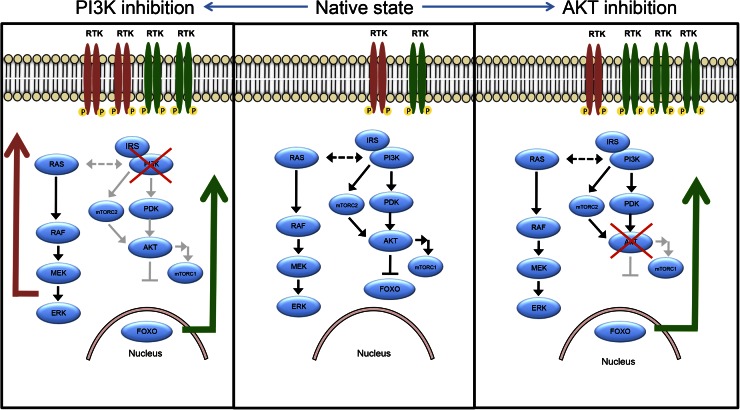
Inhibitors of the phosphatidylinositol 3-kinase/protein kinase B/mammalian target of rapamycin (PI3K/AKT/mTOR) pathway hold promise for the treatment of breast cancer, but resistance to these treatments can arise via feedback loops that increase surface expression of the receptor tyrosine kinases (RTK) epidermal growth factor receptor 1 (EGFR) and human epidermal growth factor receptor 3 (HER3), leading to persistent growth pathway signaling. We developed PET probes that provide a method of imaging this response in vivo, determining which tumors may use this escape pathway while avoiding the need for repeated biopsies.

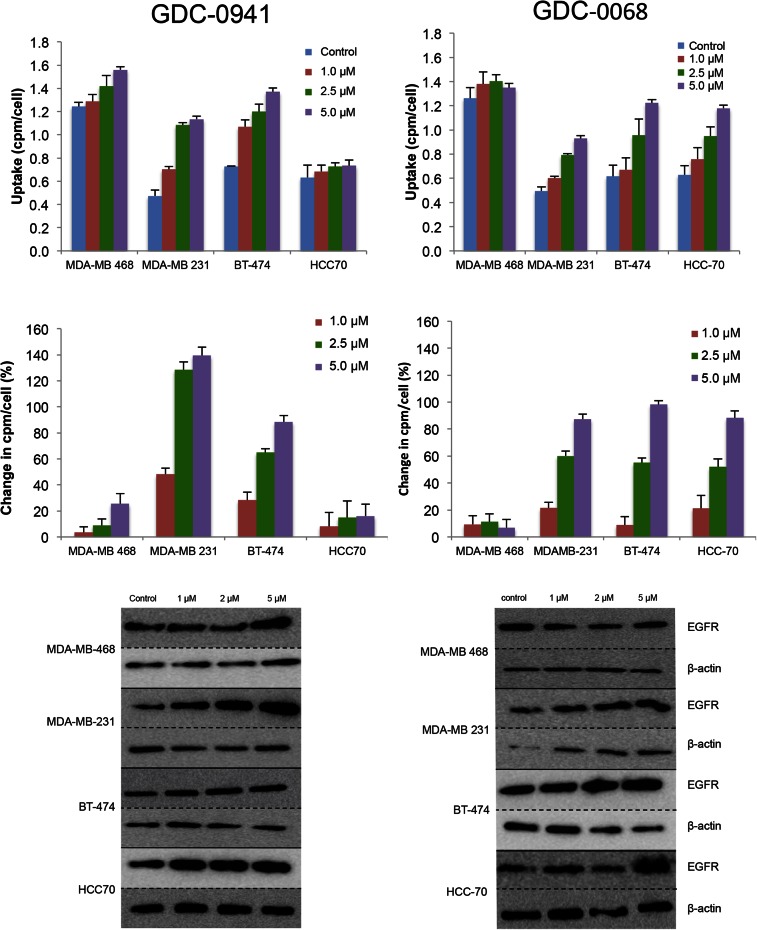
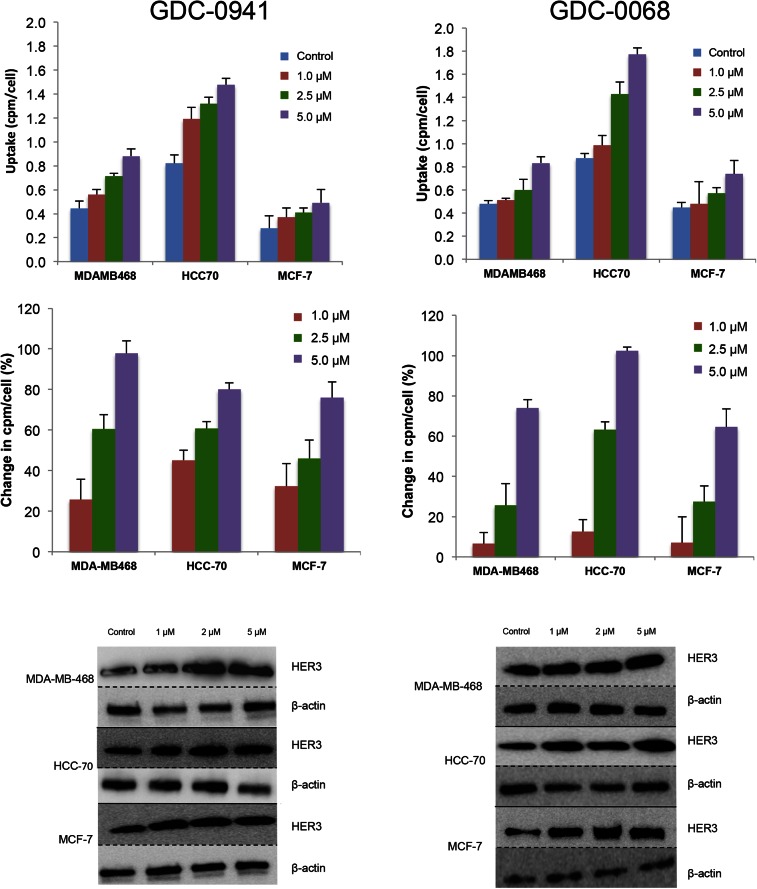
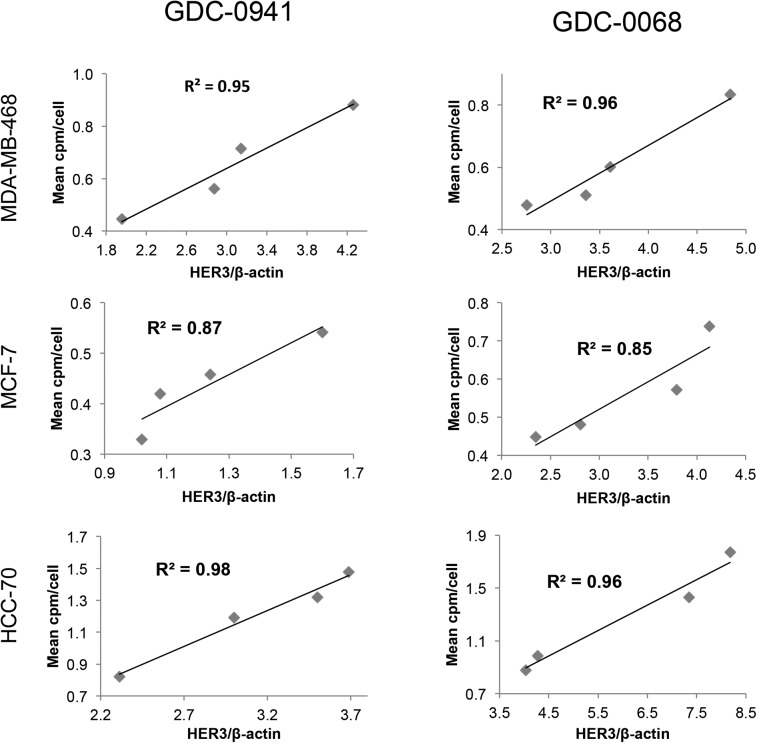
Methods: Anti-EGFR-F(ab')2 and anti-HER3-F(ab')2 were generated from monoclonal antibodies by enzymatic digestion, conjugated to DOTA, and labeled with (64)Cu. A panel of breast cancer cell lines was treated with increasing concentrations of the AKT inhibitor GDC-0068 or the PI3K inhibitor GDC-0941. Pre- and posttreatment expression of EGFR and HER3 was compared using Western blot and correlated to probe accumulation with binding studies. Nude mice xenografts of HCC-70 or MDA-MB-468 were treated with either AKT inhibitor or PI3K inhibitor and imaged with either EGFR or HER3 PET probe.

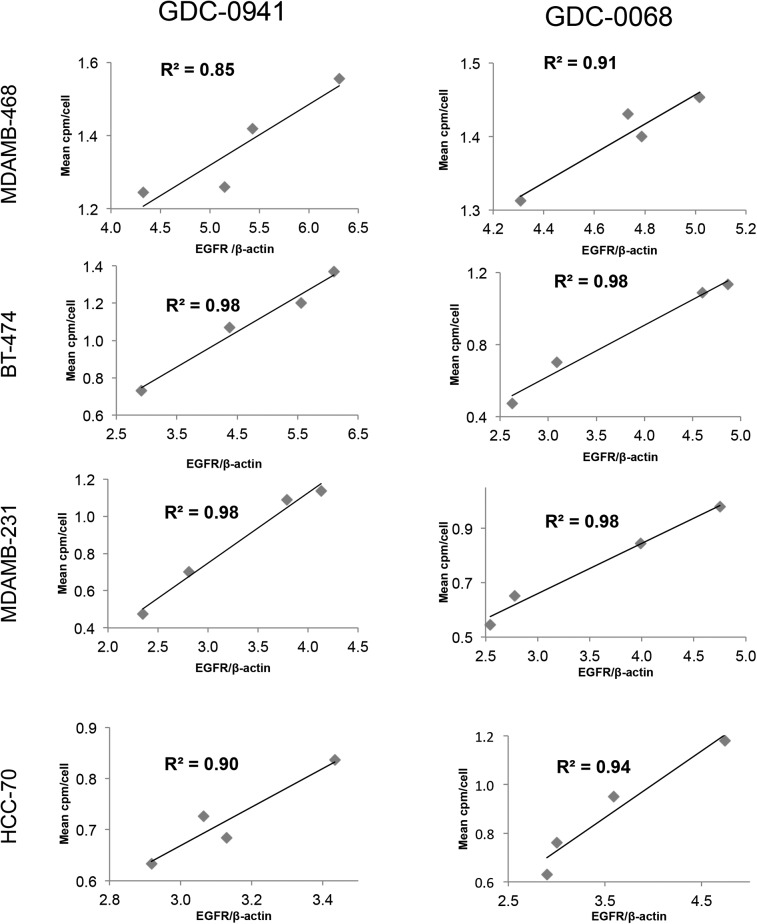
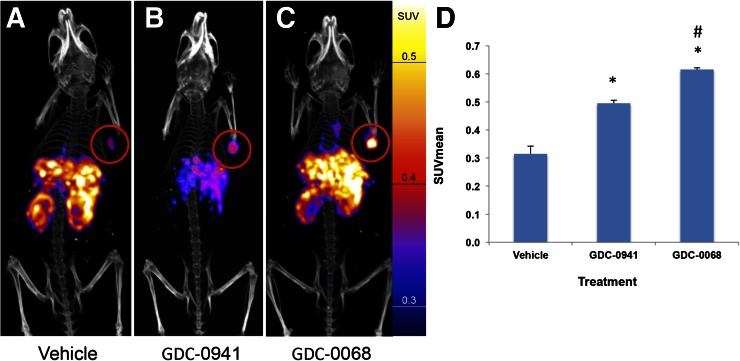
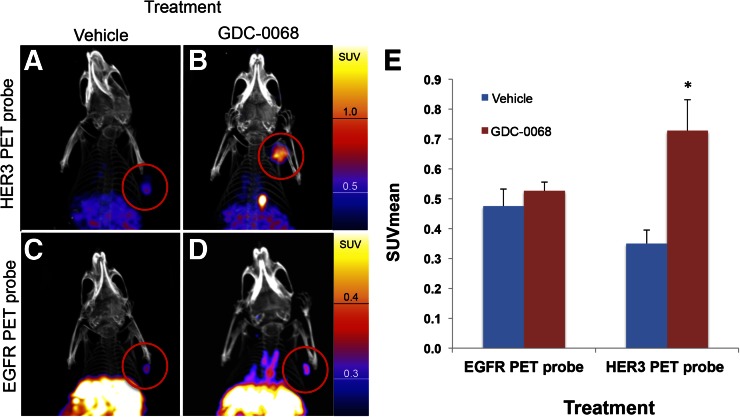
Results: Changes in HER3 and EGFR PET probe accumulation correlate to RTK expression change as assessed by Western blot (R(2) of 0.85-0.98). EGFR PET probe PET/CT imaging of HCC70 tumors shows an SUV of 0.32 ± 0.03 for vehicle-, 0.50 ± 0.01 for GDC-0941-, and 0.62 ± 0.01 for GDC-0068-treated tumors, respectively (P < 0.01 for both comparisons to vehicle). HER3 PET probe PET/CT imaging of MDAMB468 tumors shows an SUV of 0.35 ± 0.02 for vehicle- and 0.73 ± 0.05 for GDC-0068-treated tumors (P < 0.01).

Conclusion: Our imaging studies, using PET probes specific to EGFR and HER3, show that changes in RTK expression indicative of resistance to PI3K and AKT inhibitors can be seen within days of therapy initiation and are of sufficient magnitude as to allow reliable clinical interpretation. Noninvasive PET monitoring of these RTK feedback loops should help to rapidly assess resistance to PI3K and AKT inhibitors and guide selection of an appropriate combinatorial therapeutic regimen on an individual patient basis.

Keywords: AKT; PI3K; breast cancer; imaging; receptor tyrosine kinase.


Figures

FIGURE 1.
FIGURE 1.
PI3K/AKT/mTOR signaling is regulated by intrinsic feedback. With AKT inhibition, intrinsic feedback inhibition mechanisms built into AKT signaling pathway are released, resulting in increased RTK surface expression and activation, primarily of HER3. With PI3K inhibition, same AKT feedback inhibition mechanisms are released; however, because of cross-talk between PI3K and MAPK pathway, release of feedback inhibition mechanisms along MAPK pathway also contribute to increased RTK expression and activation. These feedback patterns are influenced by multiple cellular factors and are thought to differ meaningfully across patient tumors, such that degree of change in expression cannot be known a priori.
FIGURE 2.
FIGURE 2.
EGFR PET probe measures effects on cellular EGFR surface expression after treatment with either PI3K inhibitor or AKT inhibitor. After 48 h of treatment with vehicle or PI3K inhibitor GDC-0941 (left) or AKT inhibitor GDC-0068 (right) at specified doses, cell lines were incubated with EGFR PET probe for 1 h, and binding was measured by γ-counting. Middle row reflects percentage change in EGFR expression relative to control. Westerns blots of EGFR and β-actin were obtained from cells under same treatment conditions.
FIGURE 3.
FIGURE 3.
Changes in EGFR PET probe binding correlate closely with protein expression changes. Comparison of binding of radiolabeled EGFR PET probe with EGFR/β-actin intensity measured by Western blot analysis after treatment of specified cell lines with increasing concentrations of GDC-0941 (left) or GDC-0068 (right). Linear regression was used to determine goodness-of-fit and coefficient of determination.
FIGURE 4.
FIGURE 4.
HER3 PET probe measures effect on cellular HER3 surface expression after treatment with either PI3K inhibitor or AKT inhibitor. After 48 h of treatment with vehicle or PI3K inhibitor GDC-0941 (left) or AKT inhibitor GDC-0068 (right) at specified doses, cell lines were incubated with HER3 PET probe for 1 h, and binding was measured by γ-counting. Middle row reflects percentage change in HER3 expression relative to control. Westerns blots of HER3 and β-actin obtained from cells under same treatment conditions.
FIGURE 5.
FIGURE 5.
Changes in HER3 PET probe binding correlate closely with protein expression changes. Comparison of binding of radiolabeled HER3 PET probe HER3/β-actin intensity measured by Western blot analysis after treatment of specified cell lines with increasing concentrations of GDC-0941 (left) or GDC-0068 (right). Linear regression was used to determine goodness-of-fit and coefficient of determination.
FIGURE 6.
FIGURE 6.
EGFR PET probe visualizes changes in EGFR expression with treatment of HCC70 tumors. HCC70 xenografts imaged with EGFR PET probe after treatment with vehicle (A), GDC-0941 (B), or GDC-0068 (C). Images normalized to 0.6 SUV. SUVmean of HCC70 xenografts imaged with EGFR PET probe after treatment (D) demonstrates change in SUV of 57% and 95% in comparison to vehicle, respectively, n = 4 for all groups, *P < 0.05. Change in SUVmean of GDC-0068– vs. GDC-0941–treated xenografts of 24%, #P < 0.05.
FIGURE 7.
FIGURE 7.
Imaging with HER3 PET probe versus EGFR PET probe demonstrates differential RTK expression in response to treatment with AKT inhibitor. MDAMB468 xenografts imaged with HER3 PET probe after treatment with vehicle (A) or GDC-0068 (B) demonstrate 108% increase in SUVmean (E),*P < 0.05. MDAMB468 xenografts imaged with the EGFR PET probe after treatment with vehicle (C) or GDC-0068 (D) demonstrate no significant change in SUVmean, n = 4 for all groups.

References

    1. Courtney KD, Corcoran RB, Engelman JA. The PI3K pathway as drug target in human cancer. J Clin Oncol. 2010;28:1075–1083. - PMC - PubMed
    1. Zinda MJ, Johnson MA, Paul JD, et al. AKT-1, -2, and -3 are expressed in both normal and tumor tissues of the lung, breast, prostate, and colon. Clin Cancer Res. 2001;7:2475–2479. - PubMed
    1. Bjornsti MA, Houghton PJ. The TOR pathway: a target for cancer therapy. Nat Rev Cancer. 2004;4:335–348. - PubMed
    1. O’Reilly KE, Rojo F, She QB, et al. mTOR inhibition induces upstream receptor tyrosine kinase signaling and activates Akt. Cancer Res. 2006;66:1500–1508. - PMC - PubMed
    1. Serra V, Scaltriti M, Prudkin L, et al. PI3K inhibition results in enhanced HER signaling and acquired ERK dependency in HER2-overexpressing breast cancer. Oncogene. 2011;30:2547–2557. - PMC - PubMed

Publication types

MeSH terms

Substances