

Estrogen receptor alpha gene amplification in breast cancer: 25 years of debate
- PMID: 27081639
- PMCID: PMC4826962
- DOI: 10.5306/wjco.v7.i2.160
Estrogen receptor alpha gene amplification in breast cancer: 25 years of debate
Abstract
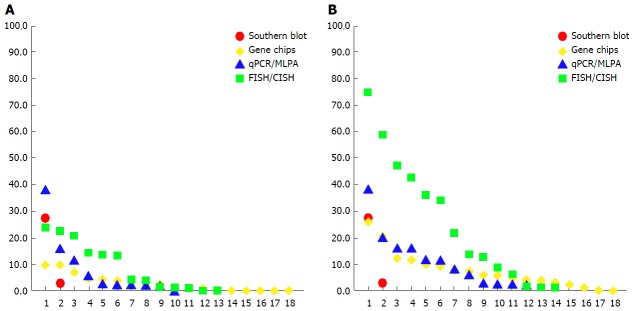
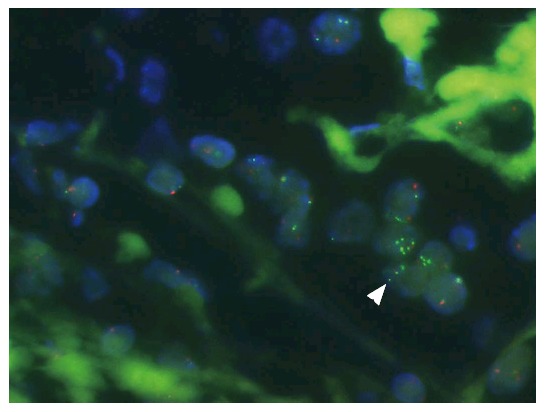
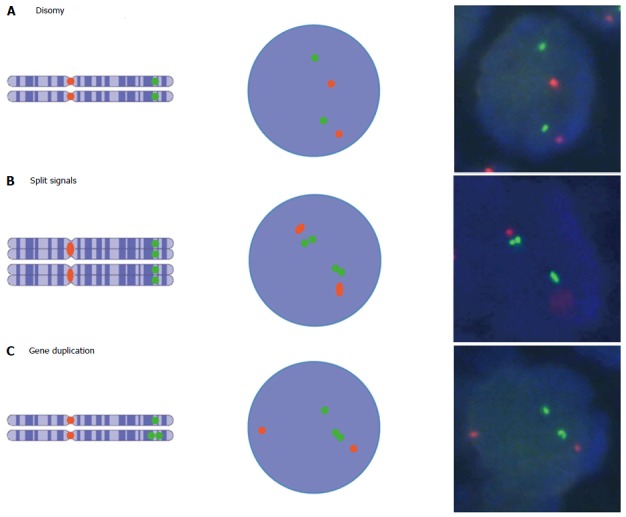
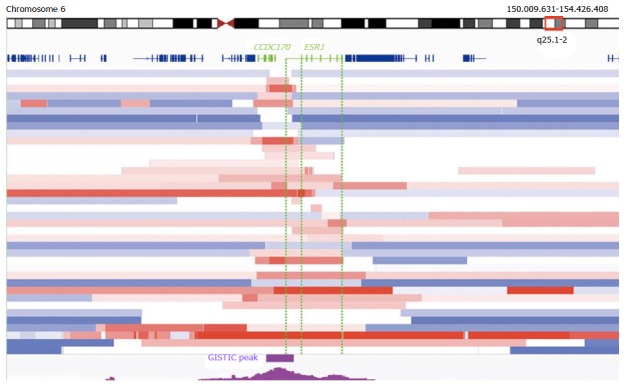
Twenty-five years ago, Nembrot and colleagues reported amplification of the estrogen receptor alpha gene (ESR1) in breast cancer, initiating a broad and still ongoing scientific debate on the prevalence and clinical significance of this genetic aberration, which affects one of the most important genes in breast cancer. Since then, a multitude of studies on this topic has been published, covering a wide range of divergent results and arguments. The reported prevalence of this alteration in breast cancer ranges from 0% to 75%, suggesting that ESR1 copy number analysis is hampered by technical and interpreter issues. To date, two major issues related to ESR1 amplification remain to be conclusively addressed: (1) The extent to which abundant amounts of messenger RNA can mimic amplification in standard fluorescence in situ hybridization assays in the analysis of strongly expressed genes like ESR1, and (2) the clinical relevance of ESR1 amplification: Such relevance is strongly disputed, with data showing predictive value for response as well as for resistance of the cancer to anti-estrogen therapies, or for subsequent development of cancers in the case of precursor lesions that display amplification of ESR1. This review provides a comprehensive summary of the various views on ESR1 amplification, and highlights explanations for the contradictions and conflicting data that could inform future ESR1 research.
Keywords: Breast cancer; Estrogen receptor alpha gene; Gene amplification; Methodology; Tamoxifen.
Figures
Similar articles
-
Estrogen receptor alpha (ESR1) gene amplification is frequent in breast cancer.Nat Genet. 2007 May;39(5):655-60. doi: 10.1038/ng2006. Epub 2007 Apr 8. Nat Genet. 2007. PMID: 17417639
-
Gene amplification of ESR1 in breast cancers--fact or fiction? A fluorescence in situ hybridization and multiplex ligation-dependent probe amplification study.J Pathol. 2012 May;227(1):8-16. doi: 10.1002/path.3974. Epub 2012 Feb 2. J Pathol. 2012. PMID: 22170254
-
Status of estrogen receptor 1 (ESR1) gene in mastopathy predicts subsequent development of breast cancer.Breast Cancer Res Treat. 2015 Jun;151(3):709-15. doi: 10.1007/s10549-015-3427-y. Epub 2015 May 16. Breast Cancer Res Treat. 2015. PMID: 25981900
-
Are Estrogen Receptor Genomic Aberrations Predictive of Hormone Therapy Response in Breast Cancer?Iran J Cancer Prev. 2016 Aug 13;9(4):e6565. doi: 10.17795/ijcp-6565. eCollection 2016 Aug. Iran J Cancer Prev. 2016. PMID: 27761212 Free PMC article. Review.
-
ESR1 amplification in endometrial carcinomas: hope or hyperbole?J Pathol. 2008 Nov;216(3):271-4. doi: 10.1002/path.2432. J Pathol. 2008. PMID: 18788074
Cited by
-
Frequent ESR1 and CDK Pathway Copy-Number Alterations in Metastatic Breast Cancer.Mol Cancer Res. 2019 Feb;17(2):457-468. doi: 10.1158/1541-7786.MCR-18-0946. Epub 2018 Oct 24. Mol Cancer Res. 2019. PMID: 30355675 Free PMC article.
-
Estrogen Receptor Alpha Gene Amplification Is an Independent Predictor of Long-Term Outcome in Postmenopausal Patients with Endocrine-Responsive Early Breast Cancer.Clin Cancer Res. 2022 Sep 15;28(18):4112-4120. doi: 10.1158/1078-0432.CCR-21-4328. Clin Cancer Res. 2022. PMID: 35920686 Free PMC article. Clinical Trial.
-
Comprehensive molecular profiling of Taiwanese breast cancers revealed potential therapeutic targets: prevalence of actionable mutations among 380 targeted sequencing analyses.BMC Cancer. 2021 Feb 25;21(1):199. doi: 10.1186/s12885-021-07931-4. BMC Cancer. 2021. PMID: 33632156 Free PMC article.
-
Somatic alterations of targetable oncogenes are frequently observed in BRCA1/2 mutation negative male breast cancers.Oncotarget. 2016 Nov 8;7(45):74097-74106. doi: 10.18632/oncotarget.12272. Oncotarget. 2016. PMID: 27765917 Free PMC article.
-
Sparse quadratic classification rules via linear dimension reduction.J Multivar Anal. 2019 Jan;169:278-299. doi: 10.1016/j.jmva.2018.09.011. Epub 2018 Oct 3. J Multivar Anal. 2019. PMID: 31105355 Free PMC article.
References
-
- Nembrot M, Quintana B, Mordoh J. Estrogen receptor gene amplification is found in some estrogen receptor-positive human breast tumors. Biochem Biophys Res Commun. 1990;166:601–607. - PubMed
-
- Chen JR, Hsieh TY, Chen HY, Yeh KY, Chen KS, ChangChien YC, Pintye M, Chang LC, Hwang CC, Chien HP, et al. Absence of estrogen receptor alpha gene (ESR1) gene amplification in a series of breast cancers in Taiwan. Virchows Arch. 2014;464:689–699. - PubMed
-
- Soysal SD, Kilic IB, Regenbrecht CR, Schneider S, Muenst S, Kilic N, Güth U, Dietel M, Terracciano LM, Kilic E. Status of estrogen receptor 1 (ESR1) gene in mastopathy predicts subsequent development of breast cancer. Breast Cancer Res Treat. 2015;151:709–715. - PubMed
-
- Russo J, Russo IH. Differentiation and breast cancer. Medicina (B Aires) 1997;57 Suppl 2:81–91. - PubMed
-
- Prall OW, Rogan EM, Sutherland RL. Estrogen regulation of cell cycle progression in breast cancer cells. J Steroid Biochem Mol Biol. 1998;65:169–174. - PubMed
Publication types
LinkOut - more resources
Full Text Sources
Other Literature Sources
Miscellaneous
