. 2016 Mar 4;3(4):248-65.
doi: 10.1002/acn3.287. eCollection 2016 Apr.

Natural history of LGMD2A for delineating outcome measures in clinical trials

Affiliations

Natural history of LGMD2A for delineating outcome measures in clinical trials

Isabelle Richard et al. Ann Clin Transl Neurol. .

Abstract

Objective: Limb-girdle muscular dystophy 2A (LGMD2A, OMIM) is a slowly progressive myopathy caused by the deficiency in calpain 3, a calcium-dependent cysteine protease of the skeletal muscle.

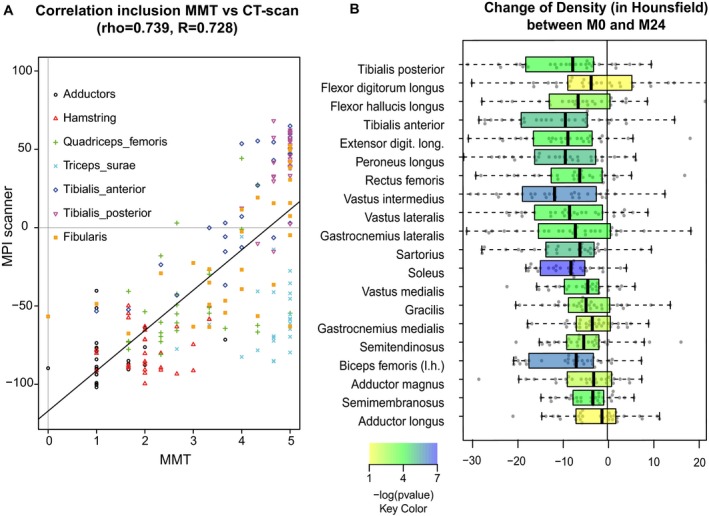
Methods: In this study, we carried out an observational study of clinical manifestations and disease progression in genetically confirmed LGMD2A patients for up to 4 years. A total of 85 patients, aged 14-65 years, were recruited in three centers located in metropolitan France, the Basque country, and the Reunion Island. They were followed up every 6 months for 2 years and a subgroup was assessed annually thereafter for two more years. Data collected for all patients included clinical history, blood parameters, muscle strength assessed by manual muscle testing (MMT) and quantitative muscle testing, functional scores, and pulmonary and cardiac functions. In addition, CT scans of the lower limbs were performed in a subgroup of patients.

Results: Our study confirms the clinical description of a slowly progressive disorder with onset in the first or second decade of life with some degree of variability related to gender and mutation type. The null mutations lead to a more severe phenotype while compound heterozygote patients are the least affected. Muscle weakness is remarkably symmetrical and predominant in the axial muscles of the trunk and proximal muscles of the lower limb. There was a high correlation between the weakness at individual muscle level as assessed by MMT and the loss of density in CT scan analysis.

Interpretation: All the generated data will help to determine the endpoints for further clinical studies.


Figures

Figure 1
Figure 1
Nature of the mutations of the cohort. (A) Schematic representation of the calpain 3 gene with the different exons and the locations of the mutations of the cohort. The light gray squares represent calpain 3 exons and the dark gray squares the corresponding protein domains. In blue: missense mutations; in orange: null mutations; in red: the only in‐frame one amino acid deletion. The number in the circle represents the number of alleles seen in the population. The external circles indicate the mutations observed in common in the different centers. (B) Distribution of the type of mutations according to center.
Figure 2
Figure 2
Schematic representation of the consequences of five mutations at RNA level. The normal allele is on the left and the mutated allele on the right. The bases corresponding to introns and exons are in lower and upper cases, respectively. The corresponding translation is indicated below the figure in a one letter code. It should be noted that donor (5′) and acceptor (3′) sites are defined by the classical consensus sequences AG/gtRagt and (Y)ncag/GT (where R, purine A/G and Y, pyrimidine T/C, respectively). (A) The transition mutation c.632+4A>G reduces the homology of the donor splicing site in intron 4 to 5′ consensus splice site from 78% to 68%. A calculation of the force of the site was performed according to the GENIE software and is shown in the figure. (B) The transition c.802‐9G>A creates a new splice site with a GENIE score of 7.2 compared to 2.9 for the original splicing site. This leads to the inclusion of seven bases in exon 6, frame shift, and premature stop codon. (C) The mutation c.944delG within exon 6 leads to a frameshift and a premature stop codon. It should be noted that the mutation was wrongly labeled as intronic (c.945+1delG) in previous reports. (D) The mutation c.2115insGT adds two nucleotides within exon 19, leading to frameshift and premature stop codon. It should be noted that the mutation was wrongly labeled as intronic (c.2115+1_2115+2dup) in previous reports.
Figure 3
Figure 3
MMT score at baseline in all the 23 tested muscles. (A) Boxplots illustrating MMT scores for individual muscles in the patients. Box extends from 25th to 75th percentile. The line is the median. Whiskers extend to largest and smallest observed values within 1.5 box lengths. (R, right; L, left). The muscles were sorted out according to the median. The MMT scale is indicated on the right of the graphs. Upper panel: upper limb and trunk muscles. Lower panel: lower limb muscles. (B) Anatomic representation of the MMT scores where the score is indicated by a rainbow color table from red (grade 1) to green (grade 5).
Figure 4
Figure 4
QMT and MFM scores. (A) QMT scores at baseline (in % of predicted values). Boxplots illustrating QMT scores for individual functions in the patients. Box extends from 25th to 75th percentile. The line is the median. Whiskers extend from the lowest data still within 1.5 interquartile range (IQR) of the lower quartile, and the highest data still within 1.5 IQR of the upper quartile. R, right; L, left. The functions were organized according to the median. (B) MFM score at baseline (in % of maximum values). Boxplots illustrating total, D1, D2, and D3 MFM scores. Box extends from 25th to 75th percentile. The line is the median. Whiskers extend from the lowest data still within 1.5 IQR of the lower quartile, to the highest data still within 1.5 IQR of the upper quartile. R, right; L, left. (C) Relationship between function as measured by the MFM and strength as measured either by MMT (left panel) or QMT (right panel). Note that this relationship is linear between MFM and MMT scores and curvilinear between MFM and QMT scores. The subject highlighted in the red circle had fixation of the hips due to contractures and was not able to perform any MFM items in the standing position.
Figure 5
Figure 5
Evolution of MT, QMT, and MFM‐32 scores throughout the study. (A) Change in MMT mean scores over 4 years. The number of subjects available for each visit is indicated above each graph. (B) Changes in MMT scores of the individual muscles (left panel: upper and trunk muscles; Right panel: lower leg muscle). Boxplots extends from 25th to 75th percentile. The line is the median. Whiskers extend from the lowest data still within 1.5 IQR of the lower quartile, and the highest data still within 1.5 IQR of the upper quartile. R, right; L, left. The significance is indicated by a rainbow color table from red (significant) to green (nonsignificant). (C) Change in QMT mean scores over 4 years. The number of subjects available for each visit is indicated over each graph. (D) Change in MFM scores over 4 years. The number of subjects available for each visit is indicated over each graph.
Figure 6
Figure 6
CT scan analysis. (A) Representative images of four CT scan sections. Cross‐sections are chosen according to anatomical reference points such as vessel location or muscle position. Regions of interest (ROIs) were determined manually with ImageJ software following the muscles shape and the fascia membrane when perceptible. (B) Density per muscle at baseline. Boxplots illustrating the MPI for individual muscles (HU: Hounsfield Unit). Box extends from 25th to 75th percentile. The line is the median. Whiskers extend from the lowest data still within 1.5 IQR of the lower quartile, and the highest data still within 1.5 IQR of the upper quartile. The muscles were ranked according to the median. (C) Anatomic representation of density at baseline. The density is indicated by a rainbow color table from red (−85 HU) to green (43 HU).
Figure 7
Figure 7
Comparison of CT scan data and MMT and evolution of density over the period. (A) Comparison of CT scan with the MMT data showed a strong correlation (rho = 0.735, R = 0.724). (B) Boxplots illustrating evolution of density (in Hounsfield) for individual muscles. Box extends from 25th to 75th percentile. The line is the median. Whiskers extend from the lowest data still within 1.5 IQR of the lower quartile, and the highest data still within 1.5 IQR of the upper quartile. R, right; L, left. The order of muscles is the same as in Figure 5B. A color scale filling the box was used to indicate the P‐value from blue (the most significant) to red (the least significant).
Figure 8
Figure 8
Evolution of the scores at individual level during the 4 years of the study according to the mutation types and the duration of the disease. (A) Change of the MMT global score. Each line represents one patient. Blue line: M1 (2 missense mutations); Violet: M2 (one missense and one null mutation); Orange: M3 (2 null mutations). (B) Change of the QMT global score. Each line represents one patient. Blue line: M1 (2 missense mutations); Violet: M2 (one missense and one null mutation); Orange: M3 (2 null mutations). (C) Change of the MFM global score. Each line represents one patient. Blue line: M1 (2 missense mutations); Violet: M2 (one missense and one null mutation); Orange: M3 (2 null mutations).

References

    1. Allamand V, Broux O, Bourg N, et al. Genetic heterogeneity of autosomal recessive limb‐girdle muscular dystrophy in a genetic isolate (Amish) and evidence for a new locus. Hum Mol Genet 1995;4(3):459–463. - PubMed
    1. Fardeau M, Hillaire D, Mignard C, et al. Juvenile limb‐girdle muscular dystrophy. Clinical, histopathological and genetic data from a small community living in the Reunion Island. Brain 1996;119(Pt 1):295–308. - PubMed
    1. Urtasun M, Saenz A, Roudaut C, et al. Limb‐girdle muscular dystrophy in Guipuzcoa (Basque Country, Spain). Brain 1998;121(Pt 9):1735–1747. - PubMed
    1. Beckmann JS, Richard I, Hillaire D, et al. A gene for limb‐girdle muscular dystrophy maps to chromosome 15 by linkage. C R Acad Sci III 1991;312(4):141–148. - PubMed
    1. Richard I, Broux O, Allamand V, et al. Mutations in the proteolytic enzyme calpain 3 cause limb‐girdle muscular dystrophy type 2A. Cell 1995;81(1):27–40. - PubMed

LinkOut - more resources