

Gene identification for risk of relapse in stage I lung adenocarcinoma patients: a combined methodology of gene expression profiling and computational gene network analysis
- PMID: 27081700
- PMCID: PMC5058701
- DOI: 10.18632/oncotarget.8723
Gene identification for risk of relapse in stage I lung adenocarcinoma patients: a combined methodology of gene expression profiling and computational gene network analysis
Abstract
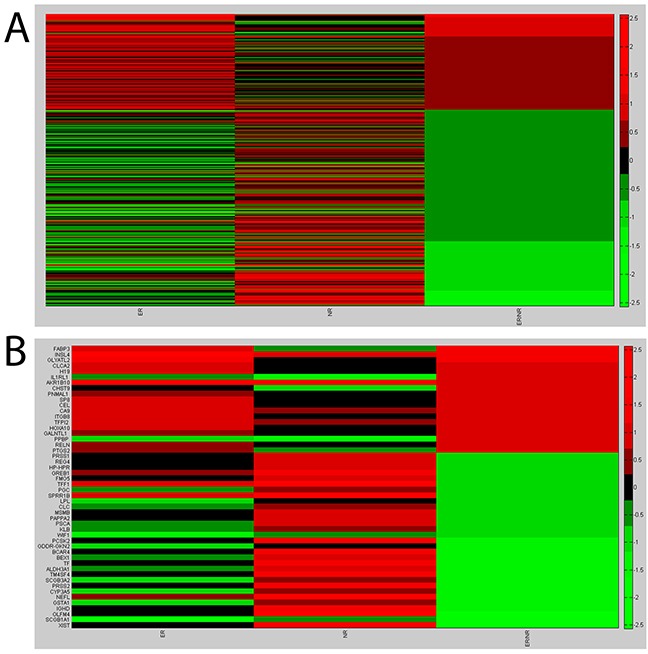
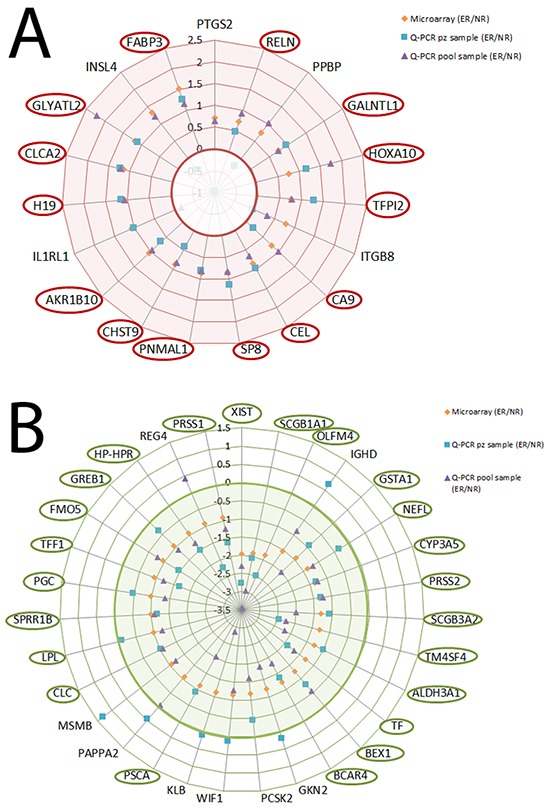
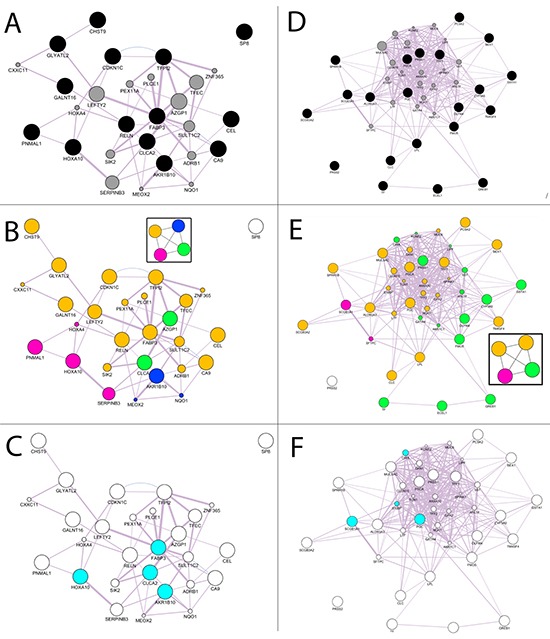
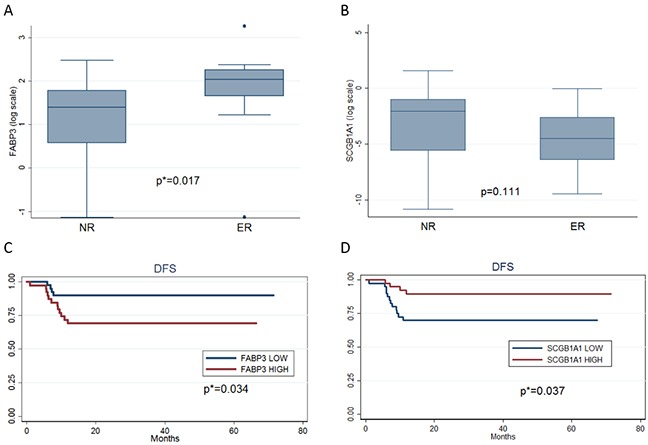
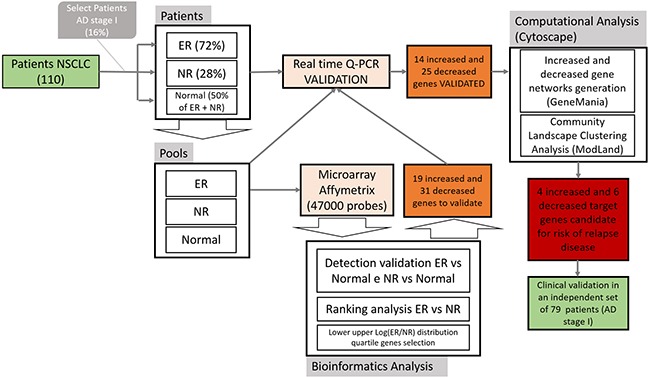
Risk assessment and treatment choice remains a challenge in early non-small-cell lung cancer (NSCLC). The aim of this study was to identify novel genes involved in the risk of early relapse (ER) compared to no relapse (NR) in resected lung adenocarcinoma (AD) patients using a combination of high throughput technology and computational analysis. We identified 18 patients (n.13 NR and n.5 ER) with stage I AD. Frozen samples of patients in ER, NR and corresponding normal lung (NL) were subjected to Microarray technology and quantitative-PCR (Q-PCR). A gene network computational analysis was performed to select predictive genes. An independent set of 79 ADs stage I samples was used to validate selected genes by Q-PCR.From microarray analysis we selected 50 genes, using the fold change ratio of ER versus NR. They were validated both in pool and individually in patient samples (ER and NR) by Q-PCR. Fourteen increased and 25 decreased genes showed a concordance between two methods. They were used to perform a computational gene network analysis that identified 4 increased (HOXA10, CLCA2, AKR1B10, FABP3) and 6 decreased (SCGB1A1, PGC, TFF1, PSCA, SPRR1B and PRSS1) genes. Moreover, in an independent dataset of ADs samples, we showed that both high FABP3 expression and low SCGB1A1 expression was associated with a worse disease-free survival (DFS).Our results indicate that it is possible to define, through gene expression and computational analysis, a characteristic gene profiling of patients with an increased risk of relapse that may become a tool for patient selection for adjuvant therapy.
Keywords: cancer systems biology; computational biology; gene expression profiling; gene networks; lung adenocarcinoma.
Conflict of interest statement
The authors declare that they have no competing interests.
Figures
Similar articles
-
Detection of oncogenic mutations in resected bronchial margins by next-generation sequencing indicates early relapse in stage IA lung adenocarcinoma patients.Oncotarget. 2017 Jun 20;8(25):40643-40653. doi: 10.18632/oncotarget.16539. Oncotarget. 2017. PMID: 28380452 Free PMC article.
-
Identification of target gene and prognostic evaluation for lung adenocarcinoma using gene expression meta-analysis, network analysis and neural network algorithms.J Biomed Inform. 2018 Oct;86:120-134. doi: 10.1016/j.jbi.2018.09.004. Epub 2018 Sep 6. J Biomed Inform. 2018. PMID: 30195659
-
Clinical validity of the lung cancer biomarkers identified by bioinformatics analysis of public expression data.Cancer Res. 2007 Aug 1;67(15):7431-8. doi: 10.1158/0008-5472.CAN-07-0003. Cancer Res. 2007. PMID: 17671213
-
Gene expression profiling for early-stage NSCLC.Am J Clin Oncol. 2015 Feb;38(1):103-7. doi: 10.1097/COC.0b013e31828d95d8. Am J Clin Oncol. 2015. PMID: 23608827 Review.
-
Transcriptome analysis of the retina.Genome Biol. 2002 Jul 30;3(8):REVIEWS1022. doi: 10.1186/gb-2002-3-8-reviews1022. Epub 2002 Jul 30. Genome Biol. 2002. PMID: 12186651 Free PMC article. Review.
Cited by
-
PRSS1 Upregulation Predicts Platinum Resistance in Ovarian Cancer Patients.Front Cell Dev Biol. 2021 Jan 28;8:618341. doi: 10.3389/fcell.2020.618341. eCollection 2020. Front Cell Dev Biol. 2021. PMID: 33585454 Free PMC article.
-
High PD-L1/IDO-2 and PD-L2/IDO-1 Co-Expression Levels Are Associated with Worse Overall Survival in Resected Non-Small Cell Lung Cancer Patients.Genes (Basel). 2021 Feb 15;12(2):273. doi: 10.3390/genes12020273. Genes (Basel). 2021. PMID: 33671892 Free PMC article.
-
Comprehensive clinical implications of homeobox A10 in 3,199 cases of non-small cell lung cancer tissue samples combining qRT-PCR, RNA sequencing and microarray data.Am J Transl Res. 2019 Jan 15;11(1):45-66. eCollection 2019. Am J Transl Res. 2019. PMID: 30787969 Free PMC article.
-
Searching for New Molecular Targets for Oral Squamous Cell Carcinoma with a View to Clinical Implementation of Precision Medicine.J Pers Med. 2022 Mar 7;12(3):413. doi: 10.3390/jpm12030413. J Pers Med. 2022. PMID: 35330413 Free PMC article. Review.
-
Identification of oral squamous cell carcinoma markers MUC2 and SPRR1B downstream of TANGO.J Cancer Res Clin Oncol. 2021 Jun;147(6):1659-1672. doi: 10.1007/s00432-021-03568-9. Epub 2021 Feb 23. J Cancer Res Clin Oncol. 2021. PMID: 33620575 Free PMC article.
References
-
- Jemal A, Siegel R, Ward E, Murray T, Xu J, Smigal C, Thun MJ. Cancer Statistics, 2006. CA Cancer J Clin. 2006;56:106–30. - PubMed
-
- Rami-Porta R, Crowley JJ, Goldstraw P. The revised TNM staging system for lung cancer. Ann Thorac Cardiovasc Surg. 2009;15:4–9. - PubMed
-
- Pignon J-P, Tribodet H, Scagliotti G V, Douillard J-Y, Shepherd FA, Stephens RJ, Dunant A, Torri V, Rosell R, Seymour L, et al. Lung adjuvant cisplatin evaluation: a pooled analysis by the LACE Collaborative Group. J Clin Oncol. 2008;26:3552–9. - PubMed
-
- Strauss GM. Management of early-stage lung cancer: past, present, and future adjuvant trials. Oncology (Williston Park) 2006;20:1651–63. discussion 1663–4, 1666, 1669–70 passim. - PubMed
-
- Chen H-Y, Yu S-L, Chen C-H, Chang G-C, Chen C-Y, Yuan A, Cheng C-L, Wang C-H, Terng H-J, Kao S-F, et al. A five-gene signature and clinical outcome in non-small-cell lung cancer. N Engl J Med. 2007;356:11–20. - PubMed
MeSH terms
LinkOut - more resources
Full Text Sources
Other Literature Sources
Medical
Miscellaneous
