. 2016 Apr 15;14(4):e1002445.
doi: 10.1371/journal.pbio.1002445. eCollection 2016 Apr.

Posterior Parietal Cortex Drives Inferotemporal Activations During Three-Dimensional Object Vision

Affiliations

Posterior Parietal Cortex Drives Inferotemporal Activations During Three-Dimensional Object Vision

Ilse C Van Dromme et al. PLoS Biol. .

Abstract

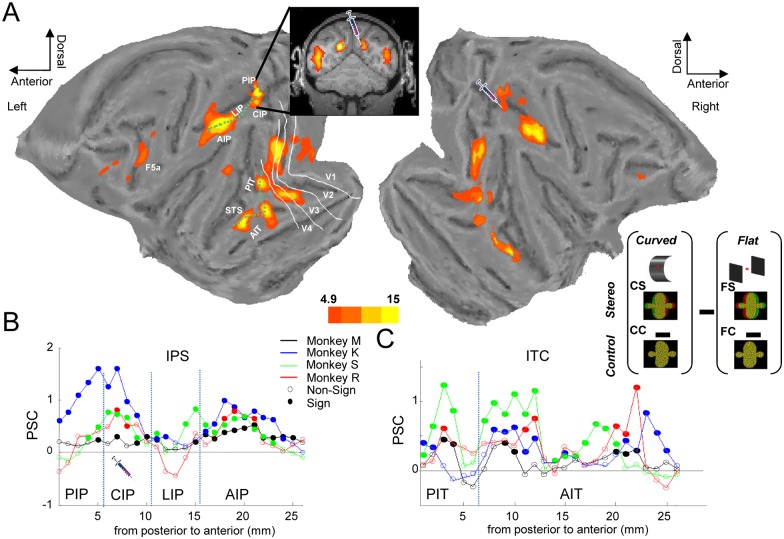
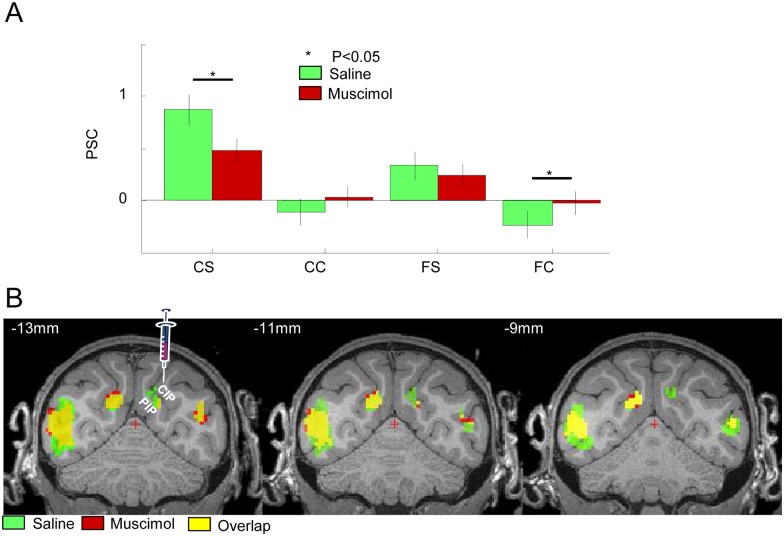
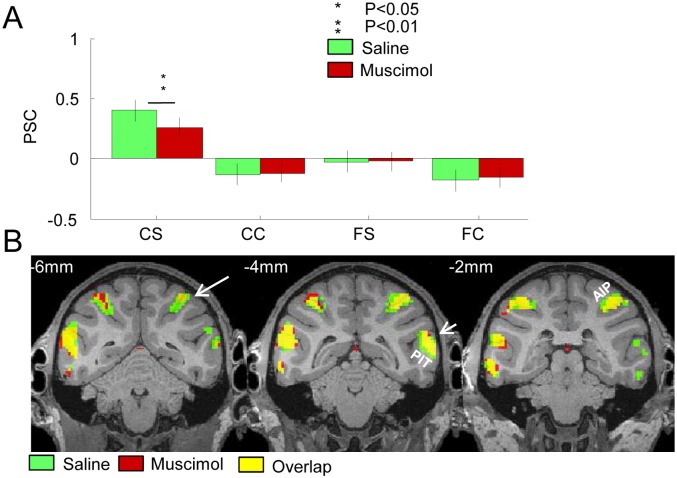
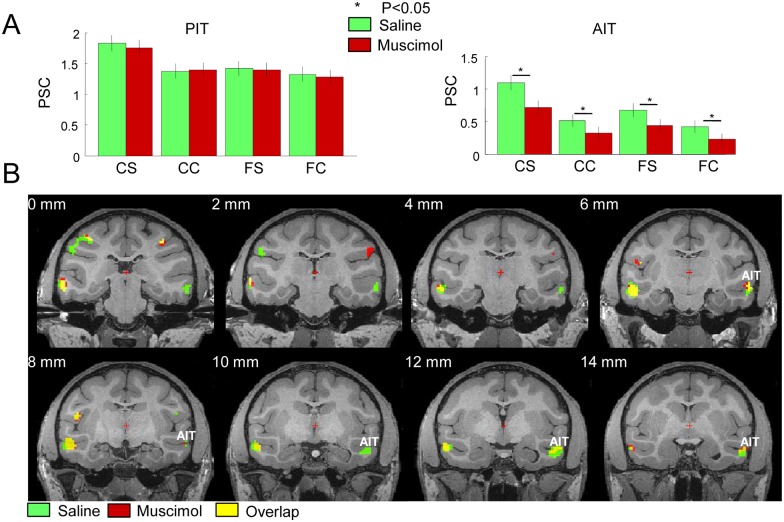
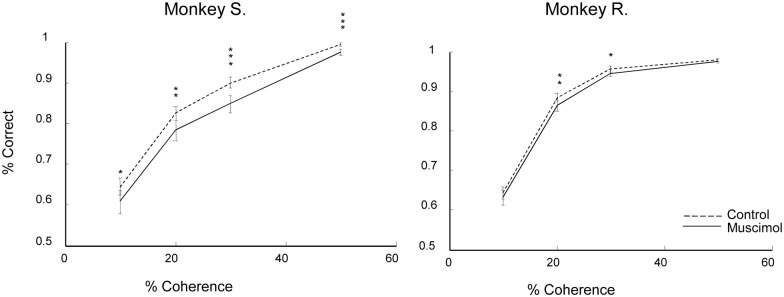
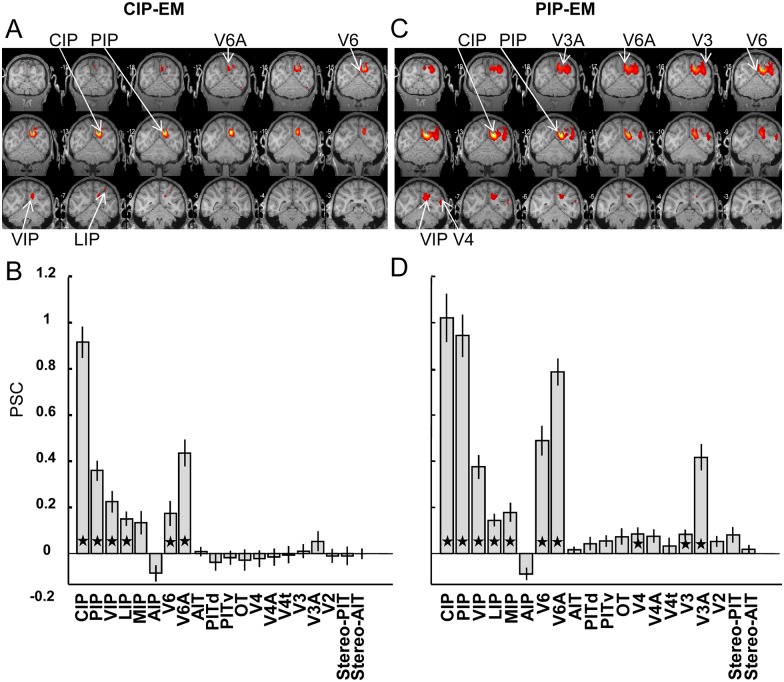
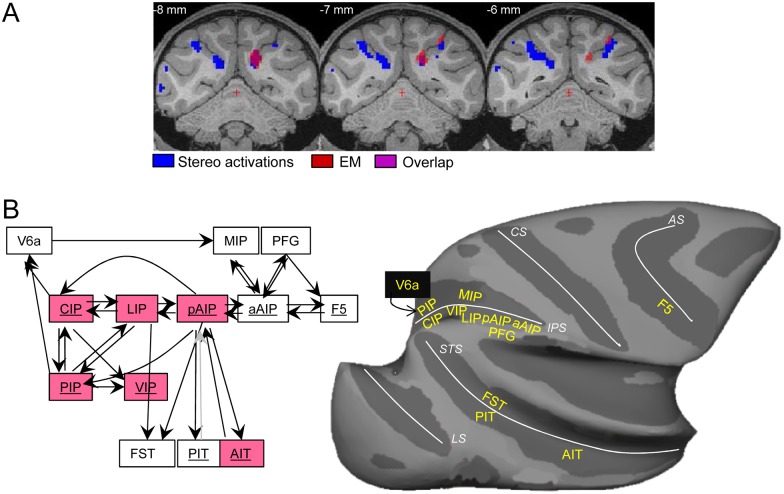
The primate visual system consists of a ventral stream, specialized for object recognition, and a dorsal visual stream, which is crucial for spatial vision and actions. However, little is known about the interactions and information flow between these two streams. We investigated these interactions within the network processing three-dimensional (3D) object information, comprising both the dorsal and ventral stream. Reversible inactivation of the macaque caudal intraparietal area (CIP) during functional magnetic resonance imaging (fMRI) reduced fMRI activations in posterior parietal cortex in the dorsal stream and, surprisingly, also in the inferotemporal cortex (ITC) in the ventral visual stream. Moreover, CIP inactivation caused a perceptual deficit in a depth-structure categorization task. CIP-microstimulation during fMRI further suggests that CIP projects via posterior parietal areas to the ITC in the ventral stream. To our knowledge, these results provide the first causal evidence for the flow of visual 3D information from the dorsal stream to the ventral stream, and identify CIP as a key area for depth-structure processing. Thus, combining reversible inactivation and electrical microstimulation during fMRI provides a detailed view of the functional interactions between the two visual processing streams.


Conflict of interest statement

The authors have declared that no competing interests exist.

Figures

Fig 1
Fig 1. Overview of depth-structure related fMRI activations.
A. Group average of the [(curved stereo–curved control)–(flat stereo–flat control)] interaction effect plotted on a flat map of the M12 anatomical template. The inset shows a coronal image illustrating depth-structure related activations in the caudal intraparietal sulcus (IPS). The two green dotted lines illustrate the paths drawn through the IPS and along the inferotemporal cortex (ITC), which were used to calculate the size of the interaction effect in individual animals. The white contours indicate the borders of the early visual areas V1–V4. The picture of the injection syringe indicates the area that was inactivated in the following experiments. t values in [27]: stereo.img/hdr. B. Percent signal change of the interaction effect calculated along a path drawn along the IPS of the left hemisphere in four monkeys (black: monkey M, red: monkey R, blue: monkey K, green: monkey S). The x-axis denotes distance in millimeters along the path, with zero corresponding to the medial bank of the caudal IPS (area PIP) and 25 corresponding to the anterior tip of the IPS. Filled symbols indicate significant (curvature x disparity interaction effect) activations, open symbols indicate nonsignificant activations. Raw values in monkey_path_ips in [27]. C. Percent signal change in the interaction effect calculated along a path drawn along the ITC in four monkeys. Zero corresponds to the depth-structure activation in V4/PIT, whereas 25 corresponds to the most rostral lower bank of the superior temporal sulcus (STS). Same conventions as in B. Raw values in monkey_path_itc in [27].
Fig 2
Fig 2. Effect of muscimol injection in CIP on the fMRI activations in the caudal IPS.
A. Group average percent signal change (compared to fixation) in the four experimental conditions. CS: curved stereo, CC: curved control, FS: flat stereo, FC: flat control. Green bars indicate saline sessions; red bars indicate muscimol sessions. * = p < 0.05. Raw values in [27]: cIPSr. B. Group average of the contrast [(curved stereo–curved control)–(flat stereo–flat control)] in the caudal IPS during saline and muscimol sessions (at p < 0.05 FWE corrected for multiple comparisons), plotted on coronal sections of the M12 anatomical template (average of three monkeys). Green: saline sessions, red: muscimol sessions, yellow: overlap between saline and muscimol sessions. Green voxels indicate significant depth structure activations during saline sessions but not during muscimol sessions, hence voxels that were affected by CIP inactivation. Red voxels indicate significant activations during muscimol sessions but not during saline session (mainly in the contralateral hemisphere). The left panel indicates the approximate location of the muscimol injection (see also S1B Fig). t values in [27]: stereo_sal.img/hdr and stereo_mus.img/hdr.
Fig 3
Fig 3. Effect of muscimol injection in CIP on the fMRI activations in the anterior IPS.
A. Group average percent signal change (compared to fixation) in the four experimental conditions in the anterior IPS of the inactivated (right) hemisphere. Same conventions as in Fig 2A. * = p < 0.05. ** = p < 0.01, both corrected for multiple comparisons. Raw values in [27]: aIPSr. B. Group average of the curvature x stereo interaction effect [(curved stereo–curved control)–(flat stereo–flat control)] in the anterior IPS during saline and muscimol sessions, plotted on coronal sections of the M12 anatomical template (average of three monkeys; p < 0.05 FWE corrected). The arrow in the left panel indicates the significant reduction in depth-structure-related activations in the anterior IPS (yellow voxels indicate the overlap between saline and muscimol sessions). The middle panel also illustrates the depth structure activations in PIT (short arrow), in which there was no significant effect of CIP inactivation. Same conventions as in Fig 2B. t values in [27]: stereo_sal.img/hdr and stereo_musc.img/hdr.
Fig 4
Fig 4. Effect of muscimol injection in CIP on the fMRI activations in the ITC.
A. Group average percent signal change (compared to fixation) in the four experimental conditions in PIT (left panel) and AIT (right panel) of the inactivated (right) hemisphere. Same conventions as in Fig 2. A. * = p < 0.05 corrected for multiple comparisons. Raw values in [27]: AITR and PITR. B. Group average of the curvature x stereo interaction effect [(curved stereo–curved control)–(flat stereo–flat control)] in the ITC during saline and muscimol sessions, plotted on coronal sections of the M12 anatomical template (average of three monkeys; p < 0.05 FWE corrected). The most posterior sections (labeled “0 mm,” top left) illustrate the depth-structure-related activations in the most posterior part of the ROI of AIT (green voxels indicating a significant activation during saline but not during muscimol sessions). The ROI of PIT is shown in Fig 3B. t values in [27]: stereo_saline.img/hdr and stereo_musc.img/hdr.
Fig 5
Fig 5. Effect of CIP inactivation on depth structure categorization.
Percent correct is plotted for the four disparity coherences used (10%, 20%, 30%, and 50%) for monkey S (left panel) and monkey R (right panel). Dashed line: no inactivation; full line: CIP inactivation. The no-inactivation condition included one saline injection in monkey R. * = p < 0.05. ** = p < 0.01, ** = p < 0.001. Raw values in [27]; Monkey_percentcorrect.xls.
Fig 6
Fig 6. Effective connectivity of CIP and PIP.
A. EM-induced fMRI activations during stimulation of CIP, plotted on coronal sections of the M12 anatomical template (average of two monkeys at p < 0.05 FWE corrected). B. Percent signal change induced by CIP-EM (compared to no stimulation) in 18 anatomical ROIs and two functionally-defined ROIs (stereo-PIT and stereo-AIT). Error bars indicate standard error across runs. Black asterisks indicate significant increase in PSC compared to no stimulation (t test, p < 0.05, corrected for multiple comparisons). C. EM-induced fMRI activations during stimulation of PIP plotted on coronal sections of the M12 anatomical template (average of three monkeys). D. Percent signal change induced by PIP-EM in the same 18 anatomical and two functionally-defined ROIs (stereo-PIT and stereo-AIT). See [27]; t values in CIP-EM.img/hdr and PIP-EM.img/hdr; PSC in PSC@CIP_EM.xls and PSC@PIP_EM.xls.
Fig 7
Fig 7. Overlap of depth structure activations and CIP-EM activations in the caudal IPS.
A. Depth structure activations (of monkey M, blue) and CIP-EM induced activations (red) are plotted on coronal slices of the M12 template. Overlap is indicated by the dark red color. See [27]; t values in stereo.img/hdr and CIP-EM.img/hdr. B. Schematic diagram of known functional interactions between dorsomedial, dorsolateral, and ventral visual streams, based on the results of this and a previous study. Boxes in red indicate areas or regions significantly affected by CIP inactivation, and underlined area names indicate significant depth structure activations. Dark arrows indicate effective connectivity based on anatomical tracer and/or EM-fMRI studies. The gray arrow from PIT to pAIP is presumed connectivity based on the bidirectionality of most cortico-cortical connections. C. Inflated macaque brain displaying the main cortical areas implicated in stereo processing, and their connected areas. IPS: intraparietal sulcus; CS: central sulcus; AS: arcuate sulcus; LS: lunate sulcus; STS: superior temporal sulcus.

Similar articles

Cited by

References

    1. Orban GA. Higher order visual processing in macaque extrastriate cortex. Physiol Rev 2008; 88: 59–89. 10.1152/physrev.00008.2007 - DOI - PubMed
    1. Lafer-Sousa R, Conway BR. Parallel, multi-stage processing of colors, faces and shapes in macaque inferior temporal cortex. Nat Neurosci 2013; 16: 1870–1878. 10.1038/nn.3555 - DOI - PMC - PubMed
    1. Verhoef BE, Bohon KS, Conway BR. Functional architecture for disparity in macaque inferior temporal cortex and its relationship to the architecture for faces, color, scenes, and visual field. J Neurosci 2015; 35: 6952–6968. 10.1523/JNEUROSCI.5079-14.2015 - DOI - PMC - PubMed
    1. Tsao DY, Vanduffel W, Sasaki Y, Fize D, Knutsen TA et al. Stereopsis activates V3A and caudal intraparietal areas in macaques and humans. Neuron 2003; 39: 555–568. - PubMed
    1. Tsao DY, Freiwald WA, Knutsen TA, Mandeville JB, Tootell RB. Faces and objects in macaque cerebral cortex. Nat Neurosci 2003; 6: 989–995. - PMC - PubMed

Publication types