. 2016 Jul:93:71-82.
doi: 10.1016/j.biomaterials.2016.03.044. Epub 2016 Mar 31.

A tunable delivery platform to provide local chemotherapy for pancreatic ductal adenocarcinoma

Affiliations

A tunable delivery platform to provide local chemotherapy for pancreatic ductal adenocarcinoma

Laura Indolfi et al. Biomaterials. 2016 Jul.

Abstract

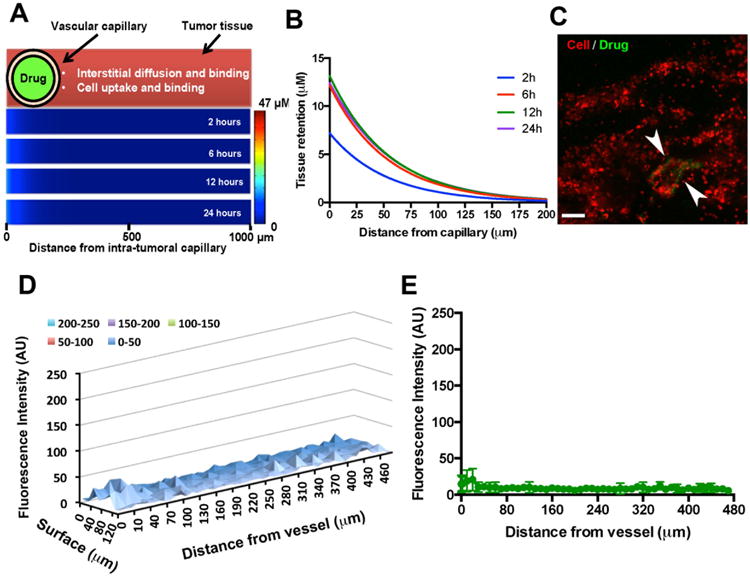
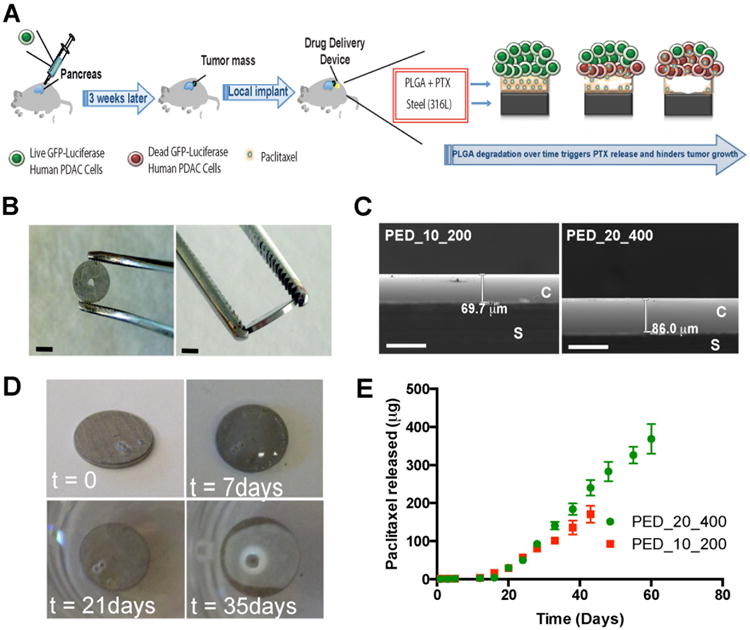
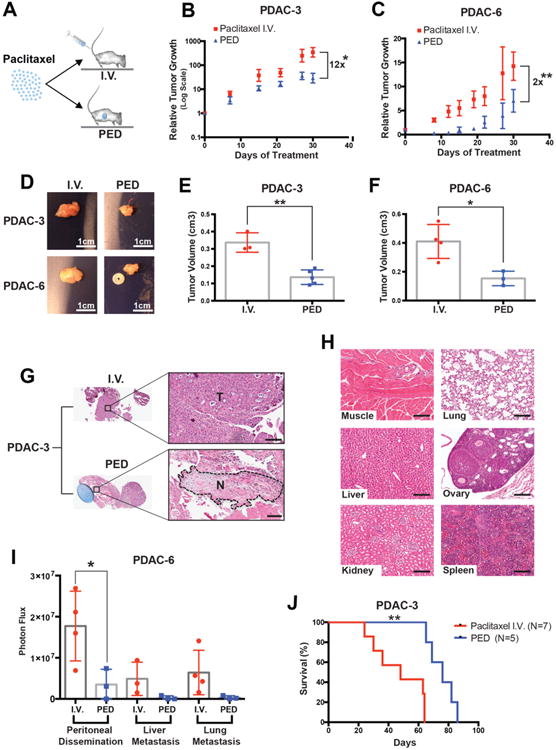
Pancreatic ductal adenocarcinoma (PDAC) is one of the most devastating and painful cancers. It is often highly resistant to therapy owing to inherent chemoresistance and the desmoplastic response that creates a barrier of fibrous tissue preventing transport of chemotherapeutics into the tumor. The growth of the tumor in pancreatic cancer often leads to invasion of other organs and partial or complete biliary obstruction, inducing intense pain for patients and necessitating tumor resection or repeated stenting. Here, we have developed a delivery device to provide enhanced palliative therapy for pancreatic cancer patients by providing high concentrations of chemotherapeutic compounds locally at the tumor site. This treatment could reduce the need for repeated procedures in advanced PDAC patients to debulk the tumor mass or stent the obstructed bile duct. To facilitate clinical translation, we created the device out of currently approved materials and drugs. We engineered an implantable poly(lactic-co-glycolic)-based biodegradable device that is able to linearly release high doses of chemotherapeutic drugs for up to 60 days. We created five patient-derived PDAC cell lines and tested their sensitivity to approved chemotherapeutic compounds. These in vitro experiments showed that paclitaxel was the most effective single agent across all cell lines. We compared the efficacy of systemic and local paclitaxel therapy on the patient-derived cell lines in an orthotopic xenograft model in mice (PDX). In this model, we found up to a 12-fold increase in suppression of tumor growth by local therapy in comparison to systemic administration and reduce retention into off-target organs. Herein, we highlight the efficacy of a local therapeutic approach to overcome PDAC chemoresistance and reduce the need for repeated interventions and biliary obstruction by preventing local tumor growth. Our results underscore the urgent need for an implantable drug-eluting platform to deliver cytotoxic agents directly within the tumor mass as a novel therapeutic strategy for patients with pancreatic cancer.

Keywords: Chemoresistance; Local delivery; Paclitaxel; Pancreatic cancer; Patient-derived xenograft; Poly(lactic-co-glycolic acid).


Figures

Figure 1
Figure 1. Intrinsic and extrinsic factors determine PDAC chemoresistance
(A) Schematic of factors involved in PDAC chemorefractory behavior including (i) intrinsic mechanisms related to cancer cell biology and (ii) extrinsic reasons due to drug delivery barrier. (B) Representative pictures of H&E-stained tumor sections demonstrating different degrees of stromal deposition. Well-differentiated (PDAC-1 and -6), poorly differentiated (PDAC-2 and -3), and intermediate grade (PDAC-5) tumors are shown (“T” = tumor cells; “S” = stromal cells; Bar = 20 μm). (C) Unsupervised hierarchical clustering of one thousand most differentially expressed genes among all patient-derived PDAC lines. The heat map shows that PDAC-2 and PDAC-3 cluster together while PDAC-1, PDAC-5 and PDAC-6 cluster separately. (D) Unsupervised hierarchical clustering using an epithelial/mesenchymal gene signature (62 genes) to differentiate epithelial (CL) vs. quasi-mesenchymal (QM) and exocrine-like (EX) tumor types and cell line behavior. The heat map shows an overexpression of epithelial genes (CL) in PDAC-1, PDAC-5 and PDAC-6 while a downregulation of those genes in PDAC-2 and PDAC-3. These lines display an up-regulation of mesenchymal genes (QM). (E) Representative images of epithelial (CDH1, EPCAM, KRT5, KRT7, KRT8, KRT18, KRT19; red) and mesenchymal (FN1, CDH2, SERPINE1; blue) markers identified by RNA in situ hybridization staining. Epithelial tumor cells are denoted by arrowheads, while mesenchymal tumor cells are indicated by arrows (Bar = 20 μm). (F) Cellular migration changes demonstrated by transwell migration assay. PDAC-2 and PDAC-3 show a higher migration ability compared to the other PDAC lines. Statistically significant difference with *P<0.05, **P<0.01 or ***P<0.001. (G) In vitro paclitaxel sensitivity of PDAC cell lines shown by MTT assay. (H) Table with the IC50 of all PDAC cell lines against paclitaxel, gemcitabine, fluorouracil (5-FU), oxaliplatin, irinotecan (data in E and G are displayed as mean ± standard deviation).
Figure 2
Figure 2. Computational modeling of drug delivery to pancreatic tumors
(A) Layout of the computational domain consisting of a single vascular capillary (in pink) from which intravenous delivered drug (green) is transported into the surrounding tumor tissue (red) and distributes via interstitial diffusion/binding and cell uptake/binding. Underneath is represented the presence of drug over a time course of 24 hours within the tumor mass. (B) Linear representation of tissue distribution predicts that drug will reach tumor site at a very limited concentration. (C) Confocal imaging of a tumor tissue section after 14 days treatment consisting of weekly injection of paclitaxel-Cremophore formulation. Image taken two hours after intravenous injection highlights presence of the fluorescent paclitaxel only at the lumen/tissue interface (Bar = 100 μm). (D) Analysis of the fluorescence intensity at the surface. (E) Fluorescence intensity are in accordance with computational prediction of very limited drug penetration (data shown are displayed as mean ± standard deviation).
Figure 3
Figure 3. Design and characterization of an implantable paclitaxel eluting device
(A) Schematic of localized therapeutic approach with a paclitaxel eluting device (PED). (B) Macroscopic visualizations of the local delivery device (Bar = 3 μm). (C) Evaluation of coating thickness using scanning electron microscopy (Bar = 100 μm). Coating methodology ensured a platform technology with similar outcomes for two different formulations differing in PLGA amount (10% and 20% respectively) and paclitaxel loading (200 μg or 400 μg respectively; “C” = coating and “S” = steel). (D) Characterization of degradation of the coatings. Bulk polymeric degradation was homogeneous and without superficial cracks. (E) In vitro linear release kinetics showed tunable delivery for over a month from both formulations with adjustable therapeutic dose (data are displayed as mean ± standard deviation).
Figure 4
Figure 4. Localized therapeutic strategy implementing PED greatly enhances intratumoral deliverability of chemotherapeutic agents
(A) Schematic of the computational domain consisting of a confined tumor tissue (red), the device as source of drug (green) taking into consideration interstitial diffusion/binding, cell uptake/binding and capillary clearance. Underneath is represented drug distribution over a course of 30 days within the tumor mass. (B) Linear representation of intratumoral drug distribution predicts elevated paclitaxel tissue retention as a function of release kinetics and extended over 1 mm after 30 days of treatment. (C) Representative fluorescent image under a dissecting microscope of tumor mass harvested 14 days post-treatment points out a macroscopic drug presence (Bar = 3 μm). (D) Confocal analysis of tumor tissue sections highlight the extensive penetration of the drug at increased distance form the tumor/PED interface (Bar = 100 μm). Image represents a time point of 14 days post-implant of the PED. (E) Surface analysis and (F) Fluorescent intensity from tissue was in accordance with computational predictions of drug penetration after 14 days of treatment (data in are displayed as mean ± standard deviation).
Figure 5
Figure 5. Response to treatment is highly improved by targeted delivery of chemotherapy
(A) Schematic representation of the in vivo model design used to compare the efficacy of paclitaxel delivered intravenously (intravenous) to the paclitaxel eluting device (PED) treatment. (B-C) Relative tumor growth curves of PDAC-3 and PDAC-6 mouse xenografts after either paclitaxel intravenous or PED treatment (data are displayed as mean ± s.e.m). (D) Representative images of tumor masses isolated from PDAC xenografts after treatment with intravenous or locally delivered paclitaxel. (E-F) Tumor volume of PDAC xenografts after treatment with intravenous or locally-delivered paclitaxel (data are displayed as mean ± standard deviation). (G) Histological analysis of the tumor showing areas of necrosis (N) in tumors treated with locally delivered paclitaxel compared to preserved tumor architecture (T) in mice treated with intravenous paclitaxel (bar = 100 μm). (H) Representative images of different organs of mice treated with PED. The histological tissue sections show intact organ architecture without any area of necrosis (hematoxylin and eosin staining, bar = 150 μm). (I) Graph showing reduction of the local peritoneal dissemination in PDAC-6 injected mice that were treated with local delivery device compared to systemic administrations of paclitaxel. *statistically significant difference with p < 0.05. **statistically significant difference with p < 0.01. (J) Kaplan-Meier curves showing a significant 28-day increase in the median overall survival of mice treated with PED compared to mice treated with paclitaxel I.V. (** p=0.0015).
Figure 6
Figure 6. Schematic layout of different types of device and approach
Fully biodegradable Drug Delivery Matrix (DDM) inserted via minimal invasive laparoscopic surgery cages the tumor, controlling invasion in nearby organs, and locally releases the agent increasing efficacy of treatment. Drug Releasing Stent (DRS) implanted through ECR relieves blockage of the bile duct and locally releases the agent increasing efficacy of treatment.

References

    1. Olive KP, et al. Inhibition of Hedgehog signaling enhances delivery of chemotherapy in a mouse model of pancreatic cancer. Science. 2009;324(5933):1457–1461. - PMC - PubMed
    1. Neesse A, et al. Stromal biology and therapy in pancreatic cancer. Gut. 2011;60(6):861–868. - PubMed
    1. Feig C, et al. The pancreas cancer microenvironment. Clin Cancer Res. 2012;18(16):4266–4276. - PMC - PubMed
    1. Provenzano PP, et al. Enzymatic targeting of the stroma ablates physical barriers to treatment of pancreatic ductal adenocarcinoma. Cancer Cell. 2012;21(3):418–429. - PMC - PubMed
    1. Sofuni A, et al. Differential diagnosis of pancreatic tumors using ultrasound contrast imaging. J Gastroenterol. 2005;40(5):518–525. - PubMed

Publication types

MeSH terms