. 2016 Apr 15;11(4):e0153371.
doi: 10.1371/journal.pone.0153371. eCollection 2016.

Neuroprotective Role of L-NG-Nitroarginine Methyl Ester (L-NAME) against Chronic Hypobaric Hypoxia with Crowding Stress (CHC) Induced Depression-Like Behaviour

Affiliations

Neuroprotective Role of L-NG-Nitroarginine Methyl Ester (L-NAME) against Chronic Hypobaric Hypoxia with Crowding Stress (CHC) Induced Depression-Like Behaviour

Satya Narayan Deep et al. PLoS One. .

Abstract

Improper neuroimmune responses following chronic stress exposure have been reported to cause neuronal dysfunctions leading to memory impairment, anxiety and depression like behaviours. Though several factors affecting microglial activation and consequent alteration in neuro-inflammatory responses have been well studied, role of NO and its association with microglia in stress induced depression model is yet to be explored. In the present study, we validated combination of chronic hypobaric hypoxia and crowding (CHC) as a stress model for depression and investigated the role of chronic stress induced elevated nitric oxide (NO) level in microglia activation and its effect on neuro-inflammatory responses in brain. Further, we evaluated the ameliorative effect of L-NG-Nitroarginine Methyl Ester (L-NAME) to reverse the stress induced depressive mood state. Four groups of male Sprague Dawley rat were taken and divided into control and CHC stress exposed group with and without treatment of L-NAME. Depression like behaviour and anhedonia in rats were assessed by Forced Swim Test (FST) and Sucrose Preference Test (SPT). Microglial activation was evaluated using Iba-1 immunohistochemistry and proinflammatory cytokines were assessed in the hippocampal region. Our result showed that exposure to CHC stress increased the number of active microglia with corresponding increase in inflammatory cytokines and altered behavioural responses. The inhibition of NO synthesis by L-NAME during CHC exposure decreased the number of active microglia in hippocampus as evident from decreased Iba-1 positive cells. Further, L-NAME administration decreased pro-inflammatory cytokines in hippocampus and improved behaviour of rats. Our study demonstrate that stress induced elevation of NO plays pivotal role in altered microglial activation and consequent neurodegenerative processes leading to depression like behaviour in rat.


Conflict of interest statement

Competing Interests: The authors have declared that no competing interests exist.

Figures

Fig 1
Fig 1
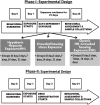
(i) Phase-1 experimental design with details of the schedule of exposure to hypobaric hypoxia, crowding stress alone and the combination of hypobaric hypoxia with crowding stress. (ii) Phase-II experimental design with details schedule of the drug administration during stress exposure.
Fig 2
Fig 2
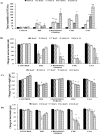
Changes in the A) time immobility in FST B) sucrose intake C) body weight D) food intake following exposure to Hypobaric Hypoxia, Crowded housing stress and CHC. E) Time of immobility, F) sucrose intake in separate groups of rats exposed to CHC compared to positive control for depression (corticosterone treatment) and following treatment with known antidepressant (Imipramine). *p < 0.05, **p < 0.01 when compare to Control+Veh; values expressed mean percentage of Control ± SEM (n = 10 in each group).
Fig 3
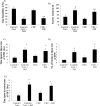
Fig 3. Validation of CHC stress as a Depression stress model.
Changes in A) immobility time in FST B) sucrose intake in SPT C) time spent in open arm D) number of entries in open arm in EPM and D) time spent in central zone of OFT.
Fig 4
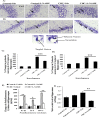
Fig 4. Neurodegeneration in hippocampal sub-regions CA1 and CA3 following exposure to hypobaric hypoxia, crowding stress alone and CHC.
Slides showing A) hoechst positive cells in the CA1 region and B) CA3 region of hippocampus following crowding, hypobaric hypoxia alone and CHC. C) Quantitative data showing changes in the number of hoescht positive cells in CA1 and CA3 region of hippocampus following exposure to crowding, hypobaric hypoxia alone and CHC. Slides showing D) Fluoro Jade B positive cells in the CA1 region and E) CA3 region of hippocampus following crowding, hypobaric hypoxia alone and CHC. F) Quantitative data showing changes in the number of Fluoro Jade B positive cells in Ca and CA3 region of hippocampus following exposure to crowding, hypobaric hypoxia alone and CHC.
Fig 5
Fig 5
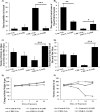
Effect of L-NAME administration on (A) Time of immobility in FST (B) Time spent in the central zone of OFT (C) Number of entries to open arm of EPM (D) Time spent in the open arm of EPM (E) Change in Body Weight and (F) Sucrose intake following exposure to CHC stress. *p < 0.05; **p < 0.01; ***p < 0.001 when compare to CHC+Veh; values expressed mean percentage of Control ± SEM (n = 20 in each group).
Fig 6
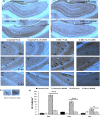
Fig 6
Slides showing morphology of neurons in A) CA3 region and B) CA1 region of hippocampus following CHC exposure with vehicle treatment and L-NAME administration. Changes in the number of pycknotic cells in C) CA3 region and D) CA1 region of hippocampus following CHC stress exposure and L-NAME administration. Changes in level of E) Pro-inflammatory cytokines (IL-1β, IL-6 and IFNγ) and F) Nitric Oxide in hippocampal region following exposure to CHC stress and L-NAME administration. *p < 0.05; **p < 0.01; ***p < 0.001 when compare to CHC+Veh; values expressed mean percentage of Control ± SEM (n = 20 in each group).
Fig 7
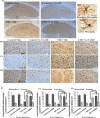
Fig 7. Slides showing Microglial Phenotypes (Ramified and Active) in hippocampus during stress exposure and L-NAME administration.
Representative slides showing Iba-1 expression in neurons of A) Entire hippocampus B) Dentate Gyrus C) CA1 and D) CA3 region of hippocampus. Changes in the number of Iba-1 positive cells in E) DG, F) CA1 and G) CA3 region of hippocampus. *p < 0.05; **p < 0.01; ***p < 0.001 when compare to CHC+Veh; values expressed mean percentage of Control ± SEM (n = 20 in each group).
Fig 8
Fig 8. Changes in number of active microglia.
A) Representative slides of ED-1 stained hippocampus. Slides showing ED-1 expression in B) DG (C) CA1 and (D) CA3 region of hippocampus. E) ED-1 representative cells, F) Number of ED-1 positive cells in DG, CA1 and CA3 region of hippocampus. *p < 0.05; **p < 0.01; ***p < 0.001 when compare to CHC+Veh; values expressed mean percentage of Control ± SEM (n = 20 in each group).
Fig 9
Fig 9. Evaluation of apoptosis and clearance of apoptotic neurons through apoptosis by microglia in DG, CA1 and CA3 region of hippocampus.
(A) Representative images showing apoptosis and phagocytosis in DG, CA1 and CA3 region of hippocampus in lower magnification. (B) Representative images showing apoptosis and phagocytosis in DG, CA1 and CA3 region of hippocampus in higher magnification. (C) Change in Caspase-3 expression and (D) change in Caspase-3/Iba-1 co-expression in DG, CA1 and CA3 region of hippocampus. Blue fluorescence represents DAPI, Green fluorescence represents Iba-1 and red represents Caspase-3 positive cells. *p < 0.05; **p < 0.01; ***p < 0.001 when compare to CHC+Veh; values expressed mean percentage of Control ± SEM (n = 20 in each group).
Fig 10
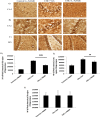
Fig 10. Changes in NF-κB expression.
Representative pictures of NF-κB expression in A) CA3, B) CA1 and C) DG region of hippocampus. Quantitative data showing number of NF-κB positive cell in D) CA3, E) CA1 and F) DG region of hippocampus. *p < 0.05; **p < 0.01; ***p < 0.001 when compare to CHC+Veh; values expressed mean percentage of Control ± SEM (n = 20 in each group).

References

    1. García-Bueno B, Madrigal JL, Pérez-Nievas BG, Leza JC (2008) Stress mediators regulate brain prostaglandin synthesis and peroxisome proliferator-activated receptor-gamma activation after stress in rats. Endocrinology 149: 1969–1978. - PubMed
    1. Anisman H, Merali Z, Hayley S (2008) Neurotransmitter, peptide and cytokine processes in relation to depressive disorder: comorbidity between depression and neurodegenerative disorders. Prog. Neurobiol. 85: 1–74. 10.1016/j.pneurobio.2008.01.004 - DOI - PubMed
    1. Felger JC, Alagbe O, Hu F, Mook D, Freeman AA, Sanchez MM et al. (2007) Effects of interferon-alpha on rhesus monkeys: a nonhuman primate model of cytokine-induced depression. Biol Psychiatry 62: 1324–1333. - PMC - PubMed
    1. Tilleux S, Berger J, Hermans E (2007) Induction of astrogliosis by activated microglia is associated with a down-regulation of metabotropic glutamate receptor 5. J Neuroimmunol 189: 23–30. - PubMed
    1. Maes M, Bosmans E, Suy E, Vandervorst C, De Jonckheere C, Raus J (1990) Immune disturbances during major depression: upregulated expression of interleukin-2 receptors. Neuropsychobiology 24: 115–120 - PubMed

Publication types

MeSH terms

Substances