. 2016 Sep;185(3):348-60.
doi: 10.1111/cei.12802. Epub 2016 Aug 2.

The regulatory role of interferon-γ producing gamma delta T cells via the suppression of T helper 17 cell activity in bleomycin-induced pulmonary fibrosis

Affiliations

The regulatory role of interferon-γ producing gamma delta T cells via the suppression of T helper 17 cell activity in bleomycin-induced pulmonary fibrosis

S Segawa et al. Clin Exp Immunol. 2016 Sep.

Abstract

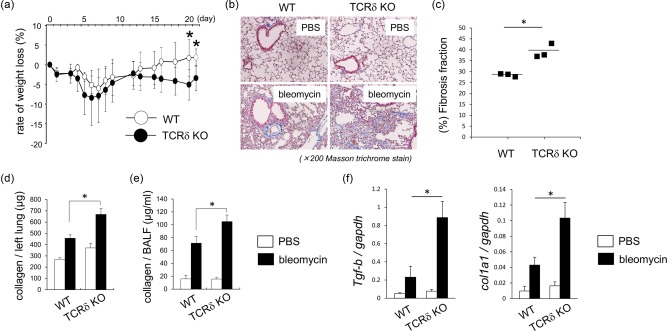
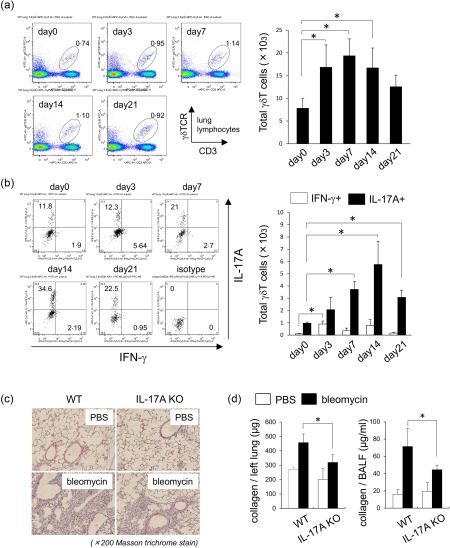
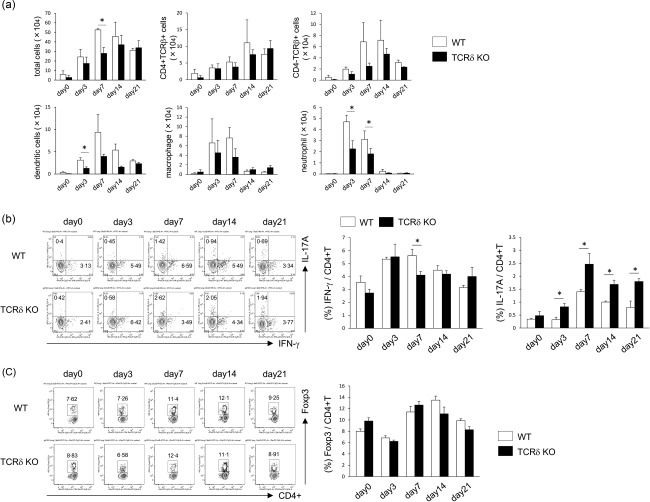
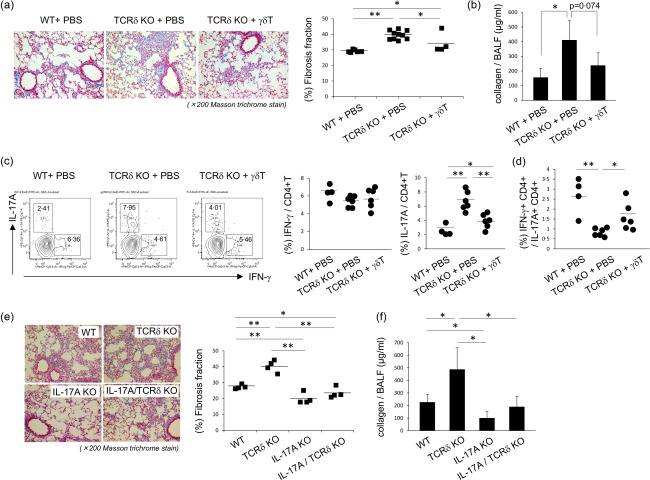
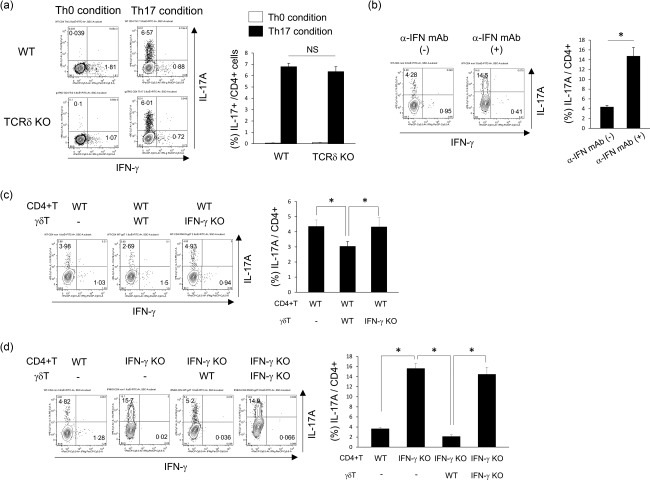
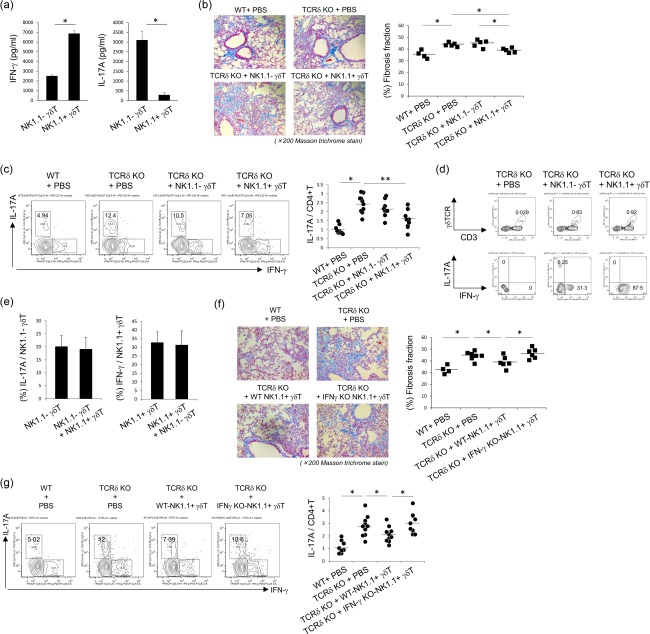
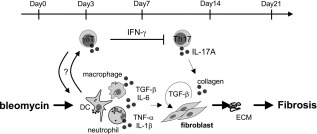
Interstitial pneumonia (IP) is a chronic progressive interstitial lung disease associated with poor prognosis and high mortality. However, the pathogenesis of IP remains to be elucidated. The aim of this study was to clarify the role of pulmonary γδT cells in IP. In wild-type (WT) mice exposed to bleomycin, pulmonary γδT cells were expanded and produced large amounts of interferon (IFN)-γ and interleukin (IL)-17A. Histological and biochemical analyses showed that bleomycin-induced IP was more severe in T cell receptor (TCR-δ-deficient (TCRδ(-/-) ) mice than WT mice. In TCRδ(-/-) mice, pulmonary IL-17A(+) CD4(+) Τ cells expanded at days 7 and 14 after bleomycin exposure. In TCRδ(-/-) mice infused with γδT cells from WT mice, the number of pulmonary IL-17A(+) CD4(+) T cells was lower than in TCRδ(-/-) mice. The examination of IL-17A(-/-) TCRδ(-/-) mice indicated that γδT cells suppressed pulmonary fibrosis through the suppression of IL-17A(+) CD4(+) T cells. The differentiation of T helper (Th)17 cells was determined in vitro, and CD4(+) cells isolated from TCRδ(-/-) mice showed normal differentiation of Th17 cells compared with WT mice. Th17 cell differentiation was suppressed in the presence of IFN-γ producing γδT cells in vitro. Pulmonary fibrosis was attenuated by IFN-γ-producing γδT cells through the suppression of pulmonary IL-17A(+) CD4(+) T cells. These results suggested that pulmonary γδT cells seem to play a regulatory role in the development of bleomycin-induced IP mouse model via the suppression of IL-17A production.

Keywords: IL-17A; gamma delta T cell; interferon-γ; interstitial pneumonia.


Figures

Figure 1
Figure 1
Histological and biochemical analyses of wild‐type (WT) and T cell receptor (TCR)δ–/– mice exposed to bleomycin. (a) Change in body weight after bleomycin exposure in WT (n = 4) and TCRδ–/– mice (n = 7). Data are representative of at least two independent experiments. Data are mean ± standard deviation (s.d.). *P < 0·05. (b) Lung tissues were obtained from WT (n = 3) and TCRδ–/– mice (n = 4) on day 21 after phosphate‐buffered saline (PBS) or bleomycin exposure. Paraffin sections were stained with Masson's trichrome. Original magnification ×200. (c) Fibrosis fraction in WT (n = 3) and TCRδ–/– (n = 3) mice was measured on 21 days after bleomycin exposure by quantitative image analysis. Data are representative of at least three independent experiments. Data are mean ± s.d. *P < 0·05. (d,e) The lung tissues and bronchoalveolar lavage fluid (BALF) were obtained from WT (n = 4) and TCRδ–/– mice (n = 7) on day 21 after bleomycin exposure and collagen production was determined. Data are representative of at least three independent experiments. Data are mean ± s.d. *P < 0·05. (f) Lung tissues were harvested from WT (n = 4) and TCRδ–/– mice (n = 7) on day 21 after bleomycin exposure. Lung mRNA was extracted and the expression of transforming growth factor (TGF)‐β and col1a1 mRNA was analysed by reverse transcription–polymerase chain reaction (RT–PCR). Data are representative of at least two independent experiments. Data are mean ± s.d. *P < 0·05.
Figure 2
Figure 2
Phenotypes of pulmonary γδT cells in bleomycin‐induced fibrosis. (a) Pulmonary lymphocytes were harvested from wild‐type (WT) mice (n = 3) on days 0, 3, 7, 14 and 21 after intratracheal instillation of bleomycin. Cells were stained for CD3ε, γδ T cell receptor (TCR)δ and analysed by flow cytometry. Data are representative of at least three independent experiments. Data are mean ± standard deviation (s.d.). *P < 0·05. (b) Pulmonary lymphocytes were harvested from WT mice (n = 3) on days 0, 3, 7, 14 and 21 after bleomycin exposure and stimulated by phorbol myristate acetate (PMA)/ionomycin for 6 h. Cells were stained for CD3ε, γδTCR, interferon (IFN)‐γ, interleukin (IL)−17A and analysed by flow cytometry. CD3ε+ γδTCR+ cells were gated. Data are representative of at least two independent experiments. Data are mean ± s.d. *P < 0·05. (c) Lung tissues were removed from WT (n = 3) and inrerleukin (IL)−17A–/– mice (n = 4) on day 21 after bleomycin exposure. Paraffin sections were stained with Masson's trichrome. Original magnification ×200. (d) Lung tissues and bronchoalveolar lavage fluid (BALF) were obtained from WT (n = 3) and IL‐17A–/– mice (n = 4) on day 21 after bleomycin exposure. Collagen production was determined by sircol assay. Data are representative of at least three independent experiments. Data are mean ± s.d. *P < 0·05.
Figure 3
Figure 3
Inflammatory and cellular changes in lung tissues of mice exposed to bleomycin. (a) wild‐type (WT) (n = 3) and T cell receptor (TCR)δ–/– mice (n = 4) were infused intratracheally with bleomycin. At days 0, 3, 7, 14 and 21, the number of total, CD4+TCRβ+, CD4TCRβ+, dendritic cells (CD11c+), macrophages (CD11cCD11b+Gr‐1) and neutrophils (CD11cCD11b+Gr‐1+) was analysed by flow cytometry (FCM). Data are representative of at least two independent experiments. Data are mean ± standard deviation (s.d.). *P < 0·05. (b) Pulmonary lymphocytes were harvested from WT (n = 3) and TCRδ–/– mice (n = 4) on days 0, 3, 7, 14 and 21 after bleomycin exposure and stimulated by phorbol myristate acetate (PMA)/ionomycin for 6 h. Cells were stained for TCRβ, CD4, interferon (IFN)‐γ, interleukin (IL)−17A and analysed by flow cytometry. CD4+TCRβ+ cells were gated. Data are representative of at least three independent experiments. Data are mean ± s.d. *P < 0·05. (c) Pulmonary lymphocytes were harvested from WT (n = 3) and TCRδ–/– mice (n = 4) on days 0, 3, 7, 14 and 21 after bleomycin exposure. Cells were stained for TCRβ, CD4, forkhead box protein 3 (FoxP3) and analysed by flow cytometry. CD4+TCRβ+ cells were gated. Data are representative of at least two independent experiments. Data are mean ± s.d. *P < 0·05.
Figure 4
Figure 4
Improvement of pulmonary fibrosis by γδT cells. (a) Wild‐type (WT) mice were harvested and pulmonary γδT cells were purified, as described in Materials and methods. Purified pulmonary γδT cells were expanded by interleukin (IL)−2, IL‐7 and IL‐15 for 12 days. Then, the expanded γδT cells were transferred into T cell receptor (TCR)δ–/– mice (1 × 10⁵/mice). Six WT mice received phosphate‐buffered saline (PBS), 10 TCRδ–/– mice received PBS and four TCRδ–/– mice received γδT cells. The lung tissues were removed on day 21 after bleomycin exposure. Paraffin sections were stained with Masson's trichrome. Original magnification ×200. Fibrosis fraction was measured by quantitative image analysis, as described in Materials and methods. Data are representative of at least two independent experiments. Data are mean ± standard deviation (s.d.). *P < 0·05, **P < 0·01. (b) Bronchoalveolar lavage fluid (BALF) was obtained on day 17 after bleomycin exposure and collagen production was determined. Data are representative of at least two independent experiments. Data are mean ± s.d. *P < 0·05. (c) At 18 days after bleomycin exposure, pulmonary lymphocytes were harvested and then stimulated with phorbol myristate actate (PMA)/ionomycin for 6 h. Cells were stained for CD3ε, CD4, interferon (IFN)‐γ, IL‐17A and analysed by flow cytometry. CD4+CD3ε+ cells were gated. Data are representative of at least two independent experiments. Data are mean ± s.d. *P < 0·05, **P < 0·01. (d) At 18 days after bleomycin exposure, pulmonary lymphocytes were harvested and then stimulated with PMA/ionomycin for 6 h. Cells were stained by CD3ε, CD4, IFN‐γ, IL‐17A and analysed by flow cytometry (FCM). Data are the proportion of IFN‐γ+CD4+T/IL‐17A+ CD4+ T cells in each mouse. Data are representative of at least two independent experiments. Data are mean ± s.d. *P <0·05, **P < 0·01. (e) WT (n = 4), TCRδ–/– (n = 4), IL‐17A–/– (n = 4) and IL‐17A/TCRδ–/– (n = 4) mice were treated with bleomycin. After 21 days, paraffin sections were stained with Masson's trichrome. Original magnification ×200. Fibrosis fraction was measured by quantitative image analysis. Data are representative of at least two independent experiments. Data are mean ± s.d. *P < 0·05, **P < 0·01. (f) WT (n = 4), TCRδ–/– (n = 4), IL‐17A–/– (n = 4) and IL‐17A/TCRδ–/– (n = 4) mice were treated with bleomycin. BALF was obtained on day 21 after bleomycin exposure and collagen production was determined. Data are representative of at least two independent experiments. Data are mean ± s.d. *p<0.05.
Figure 5
Figure 5
Effects of interferon (IFN)‐γ+ γδT cells in T helper 17 (Th17) cell differentiation in vitro. (a) Splenic CD4+ T cells were isolated from wild‐type (WT) and T cell receptor (TCR)δ–/– mice and cultured in Th0 conditions [anti‐CD3 monoclonal antibody (mAb), anti‐CD28 mAb, anti‐interferon (IFN)‐γ mAb and anti‐interleukin (IL)‐4 mAb], Th17 conditions (anti‐CD3 mAb, anti‐CD28 mAb, transforming growth factor (TGF)‐β, IL‐6, anti‐IFN‐γ mAb and anti‐IL‐4 mAb) for 96 h, as described in Materials and methods. Cells were stained for CD3ε, CD4, IFN‐γ, IL‐17A and analysed by flow cytometry. CD4+CD3ε+ cells were gated. Data are representative of at least two independent experiments. Data are mean ± standard deviation (s.d.). *P < 0·05. (b) Splenic CD4+ T cells from WT mice were cultured in Th17 conditions (anti‐CD3 mAb, anti‐CD28 mAb, TGF‐β, IL‐6 and anti‐IL‐4 mAb) with/without anti‐IFN‐γ mAb for 96 h, as described in Materials and methods. Cells were stained for CD3ε, CD4, IFN‐γ, IL‐17A and analysed by flow cytometry. CD4+CD3ε+ cells were gated. Data are representative of at least two independent experiments. Data are mean ± s.d. *P < 0·05. (c,d) Pulmonary γδT cells were harvested from WT and IFN‐γ–/– mice and purified, as described in Materials and methods. The purified pulmonary γδT cells were expanded by IL‐2, IL‐7 and IL‐15 for 12 days. Splenic CD4+ T cells from WT and IFN‐γ–/– mice were co‐cultured with the expanded γδT cells derived from WT and IFN‐γ–/– mice under Th17 conditions (anti‐CD3 mAb, anti‐CD28 mAb, TGF‐β, IL‐6 and anti‐IL‐4 mAb) for 96 h, as described in Materials and methods. Cells were stained for CD3ε, CD4, IFN‐γ, IL‐17A and analysed by flow cytometry. CD4+CD3ε+ cells were gated. Data are representative of at least three independent experiments. Data are mean ± s.d. *P < 0·05.
Figure 6
Figure 6
Inhibitory effects of interferon (IFN)‐γ+ γδT cells in the progression of pulmonary fibrosis. (a) Pulmonary natural killer (NK)1·1 γδT and NK1·1+ γδT cells were purified from wild‐type (WT) mice and expanded by interleukin (IL)−2, IL‐7 and IL‐15 for 12 days as described in Materials and methods. The expanded γδT cells were stimulated by anti‐CD3 and anti‐CD28 monoclonal antibodies (mAbs) for 72 h. IFN‐γ and IL‐17A in the culture supernatant were measured by enzyme‐linked immunosorbent assay (ELISA). Data are representative of at least three independent experiments. Data are mean ± standard deviation (s.d.). *P < 0·05. (b) The expanded NK1·1 γδT and NK1·1+ γδT cells from WT mice were transferred into T cell receptor (TCR)δ–/– mice (1 × 10⁵ cells/mice). Four WT mice received phosphate‐buffered saline (PBS), five TCRδ–/– mice received PBS, five TCRδ–/– mice received NK1.1 γδT cells and five TCRδ–/– mice received NK1·1+ γδT cells. The lung tissues were removed on day 21 after bleomycin exposure. Paraffin sections were stained with Masson's trichrome. Original magnification was ×200. Fibrosis fraction was measured by quantitative image analysis, as described in Materials and methods. Data are representative of at least two independent experiments. Data are mean ± s.d. *P < 0·05. (c) At 18 days after bleomycin exposure, pulmonary lymphocytes were harvested and then stimulated with phorbol myristate acetate (PMA)/ionomycin for 6 h. Cells were stained for CD3ε, CD4, IFN‐γ, IL‐17A and analysed by flow cytometry. CD4+CD3ε+ cells were gated. Data are shown as a ratio of IL‐17A+ cells in CD4+ T cells compared with those in control mice. The value of control mice was shown by mean of two independent experiments as 1·0. Graph represents values of two independent mice, using the average of the control mice. Data are mean ± s.d. *P < 0·05, **P < 0·01. (d) The expanded NK1·1 γδT and NK1·1+ γδT cells from WT mice were transferred into TCRδ–/– mice (2 × 10⁶ cells/mice). At 3 days after bleomycin exposure, pulmonary lymphocytes were harvested and then stimulated with PMA/ionomycin for 6 hrs. Cells were stained for CD3ε, TCRδ, IFN‐γ, IL‐17A and analysed by flow cytometry. Data are representative of at least two independent experiments. (e) The expanded NK1·1 γδT (5 × 10⁵ cells/ml) and NK1·1+ γδT cells (5 × 10⁵ cells/ml) were co‐cultured with anti‐CD3 mAb and anti‐CD28 mAb for 96 h. IFN‐γ and IL‐17A from NK1·1 or NK1·1+ fractions were analysed by flow cytometry. Data are representative of at least two independent experiments. Data are mean ± s.d. (f) Pulmonary NK1·1+ γδT cells were purified from WT and IFN‐γ–/– mice and expanded by IL‐2, IL‐7 and IL‐15 for 12 days, as described in Materials and methods. Then, the expanded γδT cells were transferred into TCRδ–/– mice (1 × 10⁵ cells/mice). Four WT mice received PBS, seven TCRδ–/– mice received PBS, six TCRδ–/– mice received NK1·1+ γδT cells from WT mice and six TCRδ–/– mice received NK1·1+ γδT cells from IFN‐γ–/– mice. The lung tissues were removed on day 21 after bleomycin exposure. Paraffin sections were stained with Masson's trichrome. Original magnification was ×200. Fibrosis fraction was measured by quantitative image analysis, as described in Materials and methods. Data are representative of at least two independent experiments. Data are mean ± s.d. *P < 0·05. (g) At 18 days after bleomycin exposure, pulmonary lymphocytes were harvested and then stimulated with PMA/ionomycin for 6 h. Cells were stained for CD3ε, CD4, IFN‐γ, IL‐17A and analysed by flow cytometry. CD4+CD3ε+ cells were gated. Data are shown as a ratio of IL‐17A+ cells in CD4+ T cells, compared with those in control mice. The value of control mice was shown by mean of two independent experiments as 1·0. Graph represents each values of two independent mice, using the average of the control mice. Data are mean ± s.d. *P < 0·05.
Figure 7
Figure 7
Schematic diagram of the role of γδT cells in pulmonary fibrosis. Schematic diagram illustrating the role of γδT cells in the suppression of pulmonary fibrosis. After bleomycin exposure, γδT cells expanded or accumulated into lung tissues. These cells reduced pulmonary interleukin (IL)−17A+ CD4+ T cells and played regulatory roles in the pathogenesis of pulmonary fibrosis.

Similar articles

Cited by

References

    1. Khalil N, O'Connor R. Idiopathic pulmonary fibrosis: current understanding of the pathogenesis and the status of treatment. Can Med Assoc J 2004; 171:153–60. - PMC - PubMed
    1. King TE Jr. Clinical advances in the diagnosis and therapy of the interstitial lung diseases. Am J Respir Crit Care Med 2005; 172:268–79. - PubMed
    1. Luna MA, Bedrossian CW, Lichtiger B, Salem PA. Interstitial pneumonitis associated with bleomycin therapy. Am J Clin Pathol 1972; 58:501–10. - PubMed
    1. Izbicki G, Segel MJ, Christensen TG, Conner MW, Breuer R. Time course of bleomycin‐induced lung fibrosis. Int J Exp Pathol 2002; 83:111–9. - PMC - PubMed
    1. Braun RK, Ferrick C, Neubauer P et al IL‐17 producing gammadelta T cells are required for a controlled inflammatory response after bleomycin‐induced lung injury. Inflammation 2008; 31:167–79. - PubMed

Publication types

MeSH terms