Genes associated with histopathologic features of triple negative breast tumors predict molecular subtypes
- PMID: 27083182
- PMCID: PMC5400013
- DOI: 10.1007/s10549-016-3775-2
Genes associated with histopathologic features of triple negative breast tumors predict molecular subtypes
Abstract
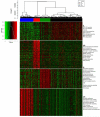
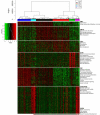
Distinct subtypes of triple negative (TN) breast cancer have been identified by tumor expression profiling. However, little is known about the relationship between histopathologic features of TN tumors, which reflect aspects of both tumor behavior and tumor microenvironment, and molecular TN subtypes. The histopathologic features of TN tumors were assessed by central review and 593 TN tumors were subjected to whole genome expression profiling using the Illumina Whole Genome DASL array. TN molecular subtypes were defined based on gene expression data associated with histopathologic features of TN tumors. Gene expression analysis yielded signatures for four TN subtypes (basal-like, androgen receptor positive, immune, and stromal) consistent with previous studies. Expression analysis also identified genes significantly associated with the 12 histological features of TN tumors. Development of signatures using these markers of histopathological features resulted in six distinct TN subtype signatures, including an additional basal-like and stromal signature. The additional basal-like subtype was distinguished by elevated expression of cell motility and glucose metabolism genes and reduced expression of immune signaling genes, whereas the additional stromal subtype was distinguished by elevated expression of immunomodulatory pathway genes. Histopathologic features that reflect heterogeneity in tumor architecture, cell structure, and tumor microenvironment are related to TN subtype. Accounting for histopathologic features in the development of gene expression signatures, six major subtypes of TN breast cancer were identified.
Keywords: Breast cancer; Gene expression; Germline mutation; Pathology; Tumor biology.
Figures


References
-
- Foulkes WD, Smith IE, Reis-Filho JS. Triple-negative breast cancer. N Engl J Med. 2010;363(20):1938–1948. doi:10.1056/NEJMra1001389. - PubMed
-
- American Cancer Society . Breast Cancer Facts & Figures, 2011-2012. American Cancer Society; Atlanta, GA: 2012.
-
- Perou CM. Molecular stratification of triple-negative breast cancers. Oncologist. 2010;15(Suppl 5):39–48. doi:15/suppl_5/39 [pii] 10.1634/theoncologist.2010-S5-39. - PubMed
-
- Perou CM, Sorlie T, Eisen MB, van de Rijn M, Jeffrey SS, Rees CA, Pollack JR, Ross DT, Johnsen H, Akslen LA, Fluge O, Pergamenschikov A, Williams C, Zhu SX, Lonning PE, Borresen-Dale AL, Brown PO, Botstein D. Molecular portraits of human breast tumours. Nature. 2000;406(6797):747–752. doi:10.1038/35021093. - PubMed
-
- Sorlie T, Perou CM, Tibshirani R, Aas T, Geisler S, Johnsen H, Hastie T, Eisen MB, van de Rijn M, Jeffrey SS, Thorsen T, Quist H, Matese JC, Brown PO, Botstein D, Eystein Lonning P, Borresen-Dale AL. Gene expression patterns of breast carcinomas distinguish tumor subclasses with clinical implications. Proc Natl Acad Sci U S A. 2001;98(19):10869–10874. doi:10.1073/pnas.191367098 98/19/10869 [pii] - PMC - PubMed
Publication types
MeSH terms
Grants and funding
LinkOut - more resources
Full Text Sources
Other Literature Sources

