Longitudinal adverse event assessment in oncology clinical trials: the Toxicity over Time (ToxT) analysis of Alliance trials NCCTG N9741 and 979254
- PMID: 27083333
- PMCID: PMC4910515
- DOI: 10.1016/S1470-2045(16)00038-3
Longitudinal adverse event assessment in oncology clinical trials: the Toxicity over Time (ToxT) analysis of Alliance trials NCCTG N9741 and 979254
Abstract
Background: Traditional methods of reporting adverse events in clinical trials are inadequate for modern cancer treatments with chronic administration. Conventional analysis and display of maximum grade adverse events do not capture toxicity profiles that evolve over time or longer lasting, lower grade toxic effects; we aimed to address this shortcoming in this study.
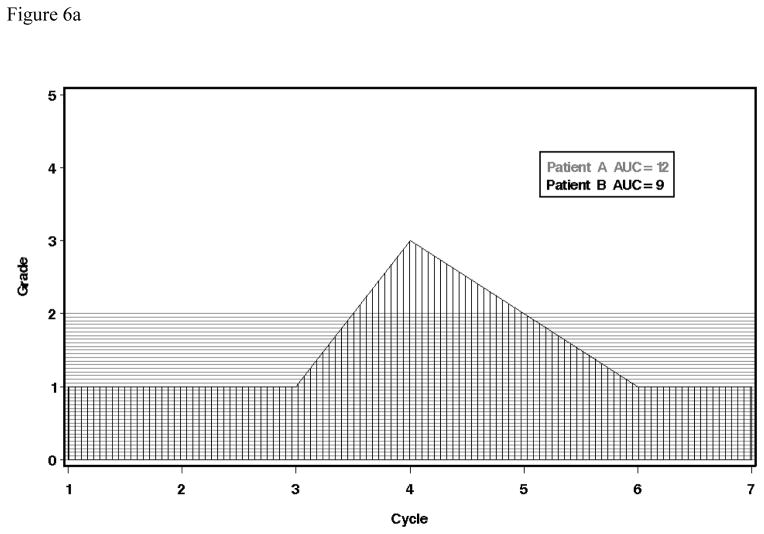
Methods: We developed an analytic approach and standardised, comprehensive format, the Toxicity over Time (ToxT) approach, which combines graphs and adverse event tabular displays with multiple longitudinal statistical techniques into a readily applicable method to study toxic effects. Plots visualising summary statistics or individual patient data over discrete timepoints were combined with statistical methods including the following longitudinal techniques: repeated measures models that describe the changes in adverse events across all cycles of treatment; time-to-event analyses of first and worst grade toxicity; and area under the curve (AUC) analyses summarising adverse event profiles over the entire course of a study, including chronic low-grade events. We applied ToxT analysis to adverse event data from two completed North Central Cancer Treatment Group (NCCTG/Alliance) trials: N9741 (NCT00003594), in which different combinations of oxaliplatin, 5-fluorouracil, and irinotecan were investigated for metastatic colorectal cancer, and 979254, in which survivors of breast cancer were given venlafaxine or placebo for control of hot flashes.
Findings: In trial NCCTG 979254 there was a higher incidence of late-occurring dry mouth in patients who were given venlafaxine than in those given placebo (week 1 [baseline]: 13% [six incidence in 48 patients, SD 5] vs 22% [11/49, SD 6]; p=0·20; week 5: 49% [24/49, 7] vs 2% [1/46, 2]; p<0·0001). In trial NCCTG N9741 there was an increased incidence of early nausea for patients given irinotecan plus oxaliplatin (IROX) compared with those given 5-fluorouracil plus oxaliplatin (FOLFOX; cycle 1 mean grade nausea 1·1 [SD 1·0] vs 0·6 [0·7]; p<0·0001). Event charts showed earlier occurrences of higher grades of diarrhoea for patients given IROX compared with those given FOLFOX, and the AUC analysis shows a higher magnitude of diarrhoea consistently over time throughout the study in patients given IROX versus those given FOLFOX (mean AUC 4·2 [SD 5·2] vs 2·9 [4·2]; p<0·0001).
Interpretation: The ToxT analytical approach incorporates the dimension of time into adverse event assessment and offers a more comprehensive depiction of toxic effects than present methods. With new, continuously administered targeted agents, immunotherapy, and maintenance regimens, these improved longitudinal analyses are directly relevant to patients and are crucial in cancer clinical trials.
Funding: National Cancer Institute of the National Institutes of Health and the Mayo Comprehensive Cancer Center.
Copyright © 2016 Elsevier Ltd. All rights reserved.
Figures


Comment in
-
Time for better presentation and analysis of adverse events.Lancet Oncol. 2016 May;17(5):553-4. doi: 10.1016/S1470-2045(16)30056-0. Epub 2016 Apr 12. Lancet Oncol. 2016. PMID: 27083330 No abstract available.
-
Adverse event development in clinical oncology trials.Lancet Oncol. 2016 Jul;17(7):e263-e264. doi: 10.1016/S1470-2045(16)30223-6. Lancet Oncol. 2016. PMID: 27396638 No abstract available.
-
Adverse event development in clinical oncology trials.Lancet Oncol. 2016 Jul;17(7):e263. doi: 10.1016/S1470-2045(16)30197-8. Lancet Oncol. 2016. PMID: 27396639 No abstract available.
-
Adverse event development in clinical oncology trials - Authors' reply.Lancet Oncol. 2016 Jul;17(7):e264-e265. doi: 10.1016/S1470-2045(16)30245-5. Lancet Oncol. 2016. PMID: 27396640 No abstract available.
References
-
- Peron J, Maillet D, Gan HK, Chen EX, You B. Adherence to CONSORT adverse event reporting guidelines in randomized clinical trials evaluating systemic cancer therapy: a systematic review. J Clin Oncol. 2013;31(31):3957–63. - PubMed
-
- Sivendran S, Latif A, McBride RB, et al. Adverse event reporting in cancer clinical trial publications. J Clin Oncol. 2014;32(2):83–9. - PubMed
-
- Gwede CK, Johnson DJ, Daniels SS, Trotti A. Assessment of toxicity in cooperative oncology clinical trials: the long and short of it. J Oncol Manag. 2002;11(2):15–21. - PubMed
-
- Ioannidis JP, Evans SJ, Gotzsche PC, et al. Better reporting of harms in randomized trials: an extension of the CONSORT statement. Ann Intern Med. 2004;141(10):781–8. - PubMed
-
- National Cancer Institute. Common Terminology Criteria for Adverse Events (CTCAE) Version 4.0. Bethesda, MD: U.S. Department of Health and Human Services; 2009.
MeSH terms
Substances
Grants and funding
LinkOut - more resources
Full Text Sources
Other Literature Sources
Medical