. 2016 Apr 15;23(5):195-207.
doi: 10.1101/lm.040964.115. Print 2016 May.

Involvement of phosphorylated Apis mellifera CREB in gating a honeybee's behavioral response to an external stimulus

Affiliations

Involvement of phosphorylated Apis mellifera CREB in gating a honeybee's behavioral response to an external stimulus

Katrin B Gehring et al. Learn Mem. .

Abstract

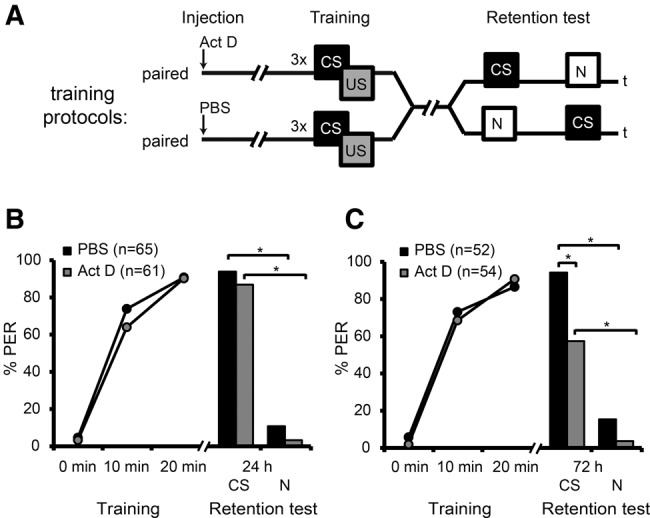
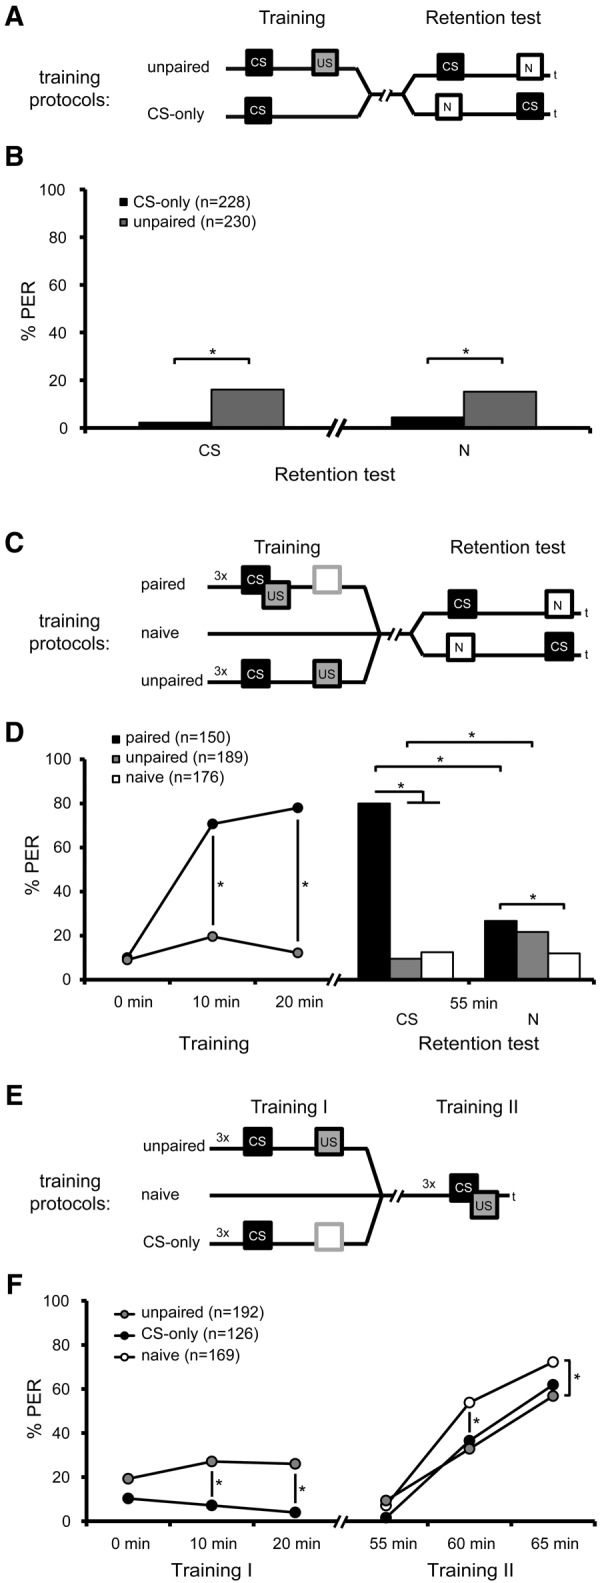
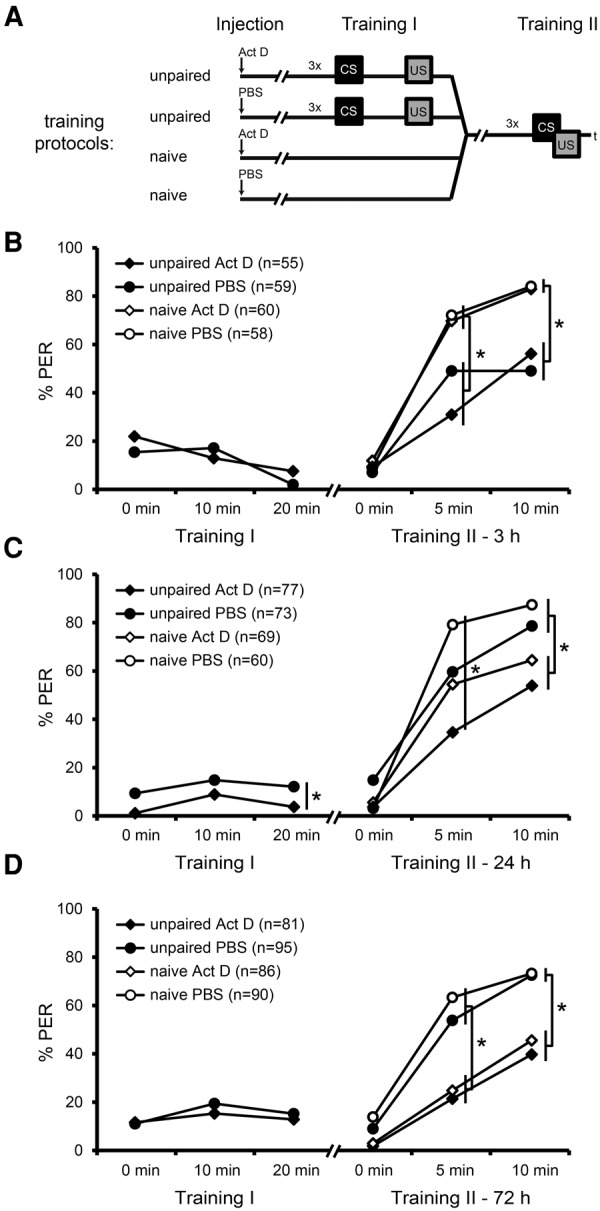
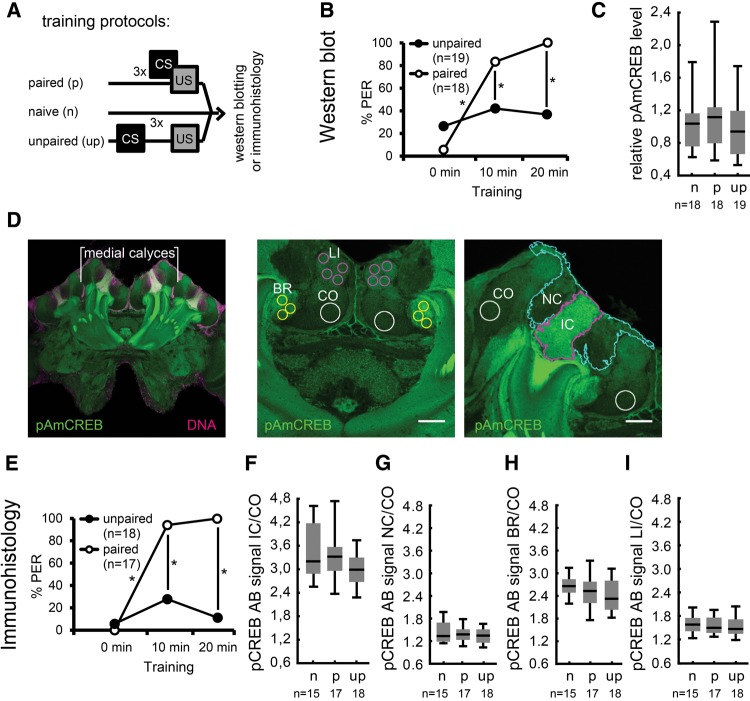
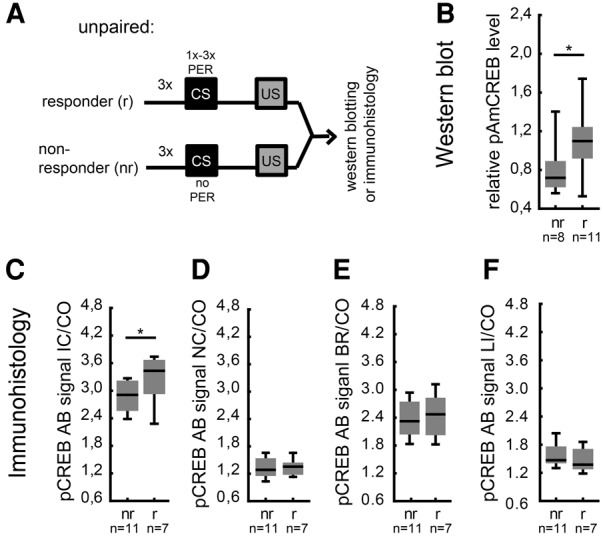
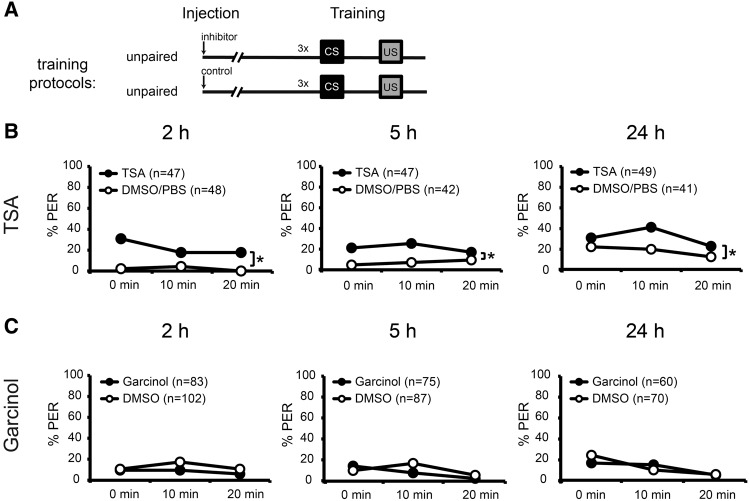
The transcription factor cAMP-response element-binding protein (CREB) is involved in neuronal plasticity. Phosphorylation activates CREB and an increased level of phosphorylated CREB is regarded as an indicator of CREB-dependent transcriptional activation. In honeybees(Apis mellifera)we recently demonstrated a particular high abundance of the phosphorylated honeybee CREB homolog (pAmCREB) in the central brain and in a subpopulation of mushroom body neurons. We hypothesize that these high pAmCREB levels are related to learning and memory formation. Here, we tested this hypothesis by analyzing brain pAmCREB levels in classically conditioned bees and bees experiencing unpaired presentations of conditioned stimulus (CS) and unconditioned stimulus (US). We demonstrate that both behavioral protocols display differences in memory formation but do not alter the level of pAmCREB in bee brains directly after training. Nevertheless, we report that bees responding to the CS during unpaired stimulus presentations exhibit higher levels of pAmCREB than nonresponding bees. In addition, Trichostatin A, a histone deacetylase inhibitor that is thought to enhance histone acetylation by CREB-binding protein, increases the bees' CS responsiveness. We conclude that pAmCREB is involved in gating a bee's behavioral response driven by an external stimulus.


Figures

Figure 1.
Figure 1.
Transcription-dependent late long-term memory formation following paired training. (A) Schematic representation of the behavioral experiment. Bees were injected with actinomycin D (Act D) or phosphate buffered saline (PBS) 90 min prior to a paired training and memory retention was tested 24 h and 72 h after the training with the conditioned stimulus (CS) and a novel odor (N). (B,C) Percentage of bees responding to the presented odor during paired training and memory retention test 24 h (B) and 72 h (C) after training. During the memory retention test, half of the bees of each group received the CS first and 10 min later the novel odor. For the other half of the bees, the sequence was reversed. Because the subgroups did not significantly differ in their CS responses during training or memory retrieval, their results were pooled (training: rmANOVA factor odorAct D 24 h: F(1,59) = 0.23; factor odorPBS 24 h: F(1,63) = 0.15, factor odorAct D 72 h: F(1,52) = 0.002, for all P > 0.05; PBS-injected bees of the 72 h group could not be tested with rmANOVA due to exact equal means in the subgroups, retention test: Fisher's exact tests between the subgroups “first odor CS” and “first odor novel,” all P > 0.05). (*) Significant differences: P < 0.0125 (Bonferroni-adjusted) detected with Fisher's exact and McNemar tests. (US) unconditioned stimulus, (PER) proboscis extension response.
Figure 2.
Figure 2.
Learning and memory formation during unpaired CS- and US-presentation. (A) Schematic representation of the behavioral experiment. Bees were trained with one unpaired presentation of CS and US or were exposed to the CS alone (CS-only). After stimulus exposure, both groups were subdivided into two groups each. One group was tested first with the CS and then with the novel odor (N) or vice versa. (B) Percentage of bees responding to the presented odor (CS or novel odor) during the memory retention test after the presentation of the US. The sequence of odor presentation did not significantly alter the bees’ responsiveness to the odors and therefore the results were pooled. (Fisher's exact tests of CS responses and novel odor responses between the subgroups “first odor CS” and “first odor novel,” all P > 0.05). (C) Schematic representation of the behavioral experiment. Naive, paired, or unpaired trained bees were tested 55 min after training with the odor used during the training phase (CS) and a novel odor (N). (D) Percentage of bees responding to the presented odor during training and memory retention tests 55 min after training. During memory retention the sequence of the tested odors did not significantly alter the bees’ odor responsiveness for each odor (Training: rmANOVA factor odorpaired: F(1,148) = 0.01, factor odorunpaired F(1,187) = 2.08, P > 0.05, Retention test: Fisher's exact tests between the subgroups “first odor CS” and “first odor novel,” all P > 0.05). Thus we pooled the results of each odor. (E) Schematic representation of the retardation of acquisition assay. Unpaired trained bees, bees exposed to CS-only trials and naive bees (Training I) underwent paired training 55 min later (Training II). (F) Percentage of bees responding to the presented odor during Training I and Training II of the retardation of acquisition assay. (*) Significant differences: P < 0.0056 (Bonferroni-adjusted) detected with Fisher's exact and McNemar tests (B), P < 0.05 detected with Tukey HSD post hoc tests after rmANOVA (D), P < 0.016 (Bonferroni-adjusted) detected with Fisher's exact and McNemar tests (F)
Figure 3.
Figure 3.
Unpaired training leads to the formation of a 3 and a 24 h, but not a 72 h memory about inhibitory properties of the CS. (A) Schematic representation of the retardation of acquisition assay. Bees were injected with Act D or PBS 90 min prior to unpaired training (Training I) and received paired training (Training II) 3, 24, and 72 h following unpaired training. (BD) Percentage of bees responding to the CS during Training I and Training II after 3 h (B), 24 h (C), and 72 h (D). (*) Significant differences: P < 0.05 detected with Tukey HSD post-hoc tests after rmANOVA.
Figure 4.
Figure 4.
The level of pAmCREB does not differ between paired, unpaired trained and naive bees. (A) Schematic representation of the behavioral experiments that preceded the quantification of pAmCREB levels using Western blot analysis (B,C) or immunohistochemistry (DI). Brains of naive, paired, or unpaired trained bees were analyzed. (B) Behavior of bees subsequently undergoing Western blot analysis. Shown are the percentages of bees responding to the CS during training. (C) Relative levels of pAmCREB in the central brain detected on Western blots. Naive (n), paired (p), and unpaired (up) trained groups did not differ in the level of pAmCREB in the central brain directly after the last US presentation. (D) Learning-dependent changes in the intensity of fluorescence-labeled pAmCREB in subpopulations of mushroom body neurons. (Left) Overview of the central honeybee brain stained with the pCREB antibody (green) and a DNA stain (magenta). The medial calyces were measured. (Center, right) Magnification of medial calyces showing the regions of interest (ROIs) measured during pCREB antibody signal intensity quantification. (Center) ROIs were placed in lip (magenta line), collar (white line), and basal ring (yellow line). (Right) ROIs comprised the inner compact cells (magenta line), and the noncompact cells (blue line) somata regions. (E) Behavior of bees subsequently undergoing immunohistochemistry. Shown are the percentages of bees responding to the CS during training. (FI) Relative pCREB antibody signal intensities measured in different regions of the mushroom bodies of naive (n), paired (p), or unpaired (up) trained bees: inner compact cell somata (F), noncompact cell somata (G), basal ring (H), and lip (I). Naive (n), paired (p), and unpaired (up) trained groups did not differ in signal intensities directly after training. Box blots show median, 25% and 75% quartiles and value range (min–max). (*) Significant differences: P < 0.05 detected with Tukey HSD post hoc tests after rmANOVA. (IC) inner compact cell somata, (NC) noncompact cell somata.
Figure 5.
Figure 5.
The level of pAmCREB correlates with a bee's CS responsiveness during unpaired training. (A) Schematic representation of the behavioral criterion used to identify responder and nonresponder bees from the unpaired trained group shown in Figure 4. (B) Relative levels of pAmCREB in the central brain of responder and nonresponder bees detected on Western blots. Bees that responded to at least one CS presentation during the unpaired training (responders) differed in the level of pAmCREB compared with bees that did not respond to the CS (nonresponders). (CF) Relative pCREB antibody signal intensities measured using immunohistochemistry in different mushroom body regions of responder and nonresponder bees of the unpaired group: inner compact cell somata (C), noncompact cell somata (D), basal ring (E), and lip (F). Different pCREB antibody signal intensities detected between responders and nonresponders in the inner compact cell somata but not in the noncompact cell somata, basal ring, or lip. Box blots show median, 25% and 75% quartiles and value range (min–max). (*) Significant differences: P < 0.05 detected with Mann–Whitney U-tests. (IC) inner compact cell somata, (NC) noncompact cell somata, (BR) basal ring, (LI) lip, (CO) collar.
Figure 6.
Figure 6.
Inhibition of histone deacetylases enhances CS responsiveness. (A) Schematic representation of the behavioral experiments. Bees were injected with the histone deacetylase inhibitor Trichostatin A (TSA), the histone acetyl transferase inhibitor, Garcinol or the respective vehicles 2, 5, or 24 h prior to unpaired training (B) Percentage of bees responding to the CS during unpaired training after injection of Trichostatin A (B) or Garcinol (C). (*) Significant differences: P < 0.05 detected with Tukey HSD post hoc tests after rmANOVA.

Similar articles

Cited by

References

    1. Alberini CM. 2009. Transcription factors in long-term memory and synaptic plasticity. Physiol Rev 89: 121–145. - PMC - PubMed
    1. Ament SA, Blatti CA, Alaux C, Wheeler MM, Toth AL, Le Conte Y, Hunt GJ, Guzmán-Novoa E, DeGrandi-Hoffman G, Uribe-Rubio JL, et al. 2012. New meta-analysis tools reveal common transcriptional regulatory basis for multiple determinants of behavior. Proc Natl Acad Sci 109: E1801–E1810. - PMC - PubMed
    1. Bannister AJ, Kouzarides T. 1996. The CBP co-activator is a histone acetyltransferase. Nature 384: 641–643. - PubMed
    1. Barber MF, Michishita-Kioi E, Xi Y, Tasselli L, Kioi M, Moqtaderi Z, Tennen RI, Paredes S, Young NL, Chen K, et al. 2012. SIRT7 links H3K18 deacetylation to maintenance of oncogenic transformation. Nature 487: 114–118. - PMC - PubMed
    1. Barco A, Marie H. 2011. Genetic approaches to investigate the role of CREB in neuronal plasticity and memory. Mol Neurobiol 44: 330–349. - PubMed

Publication types

MeSH terms

LinkOut - more resources