. 2016 Jul 8;44(12):5673-88.
doi: 10.1093/nar/gkw261. Epub 2016 Apr 15.

Translocation and deletion breakpoints in cancer genomes are associated with potential non-B DNA-forming sequences

Affiliations

Translocation and deletion breakpoints in cancer genomes are associated with potential non-B DNA-forming sequences

Albino Bacolla et al. Nucleic Acids Res. .

Abstract

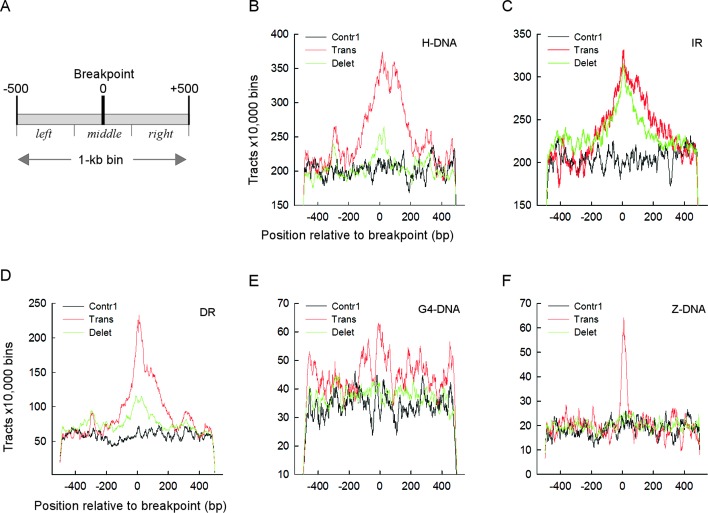
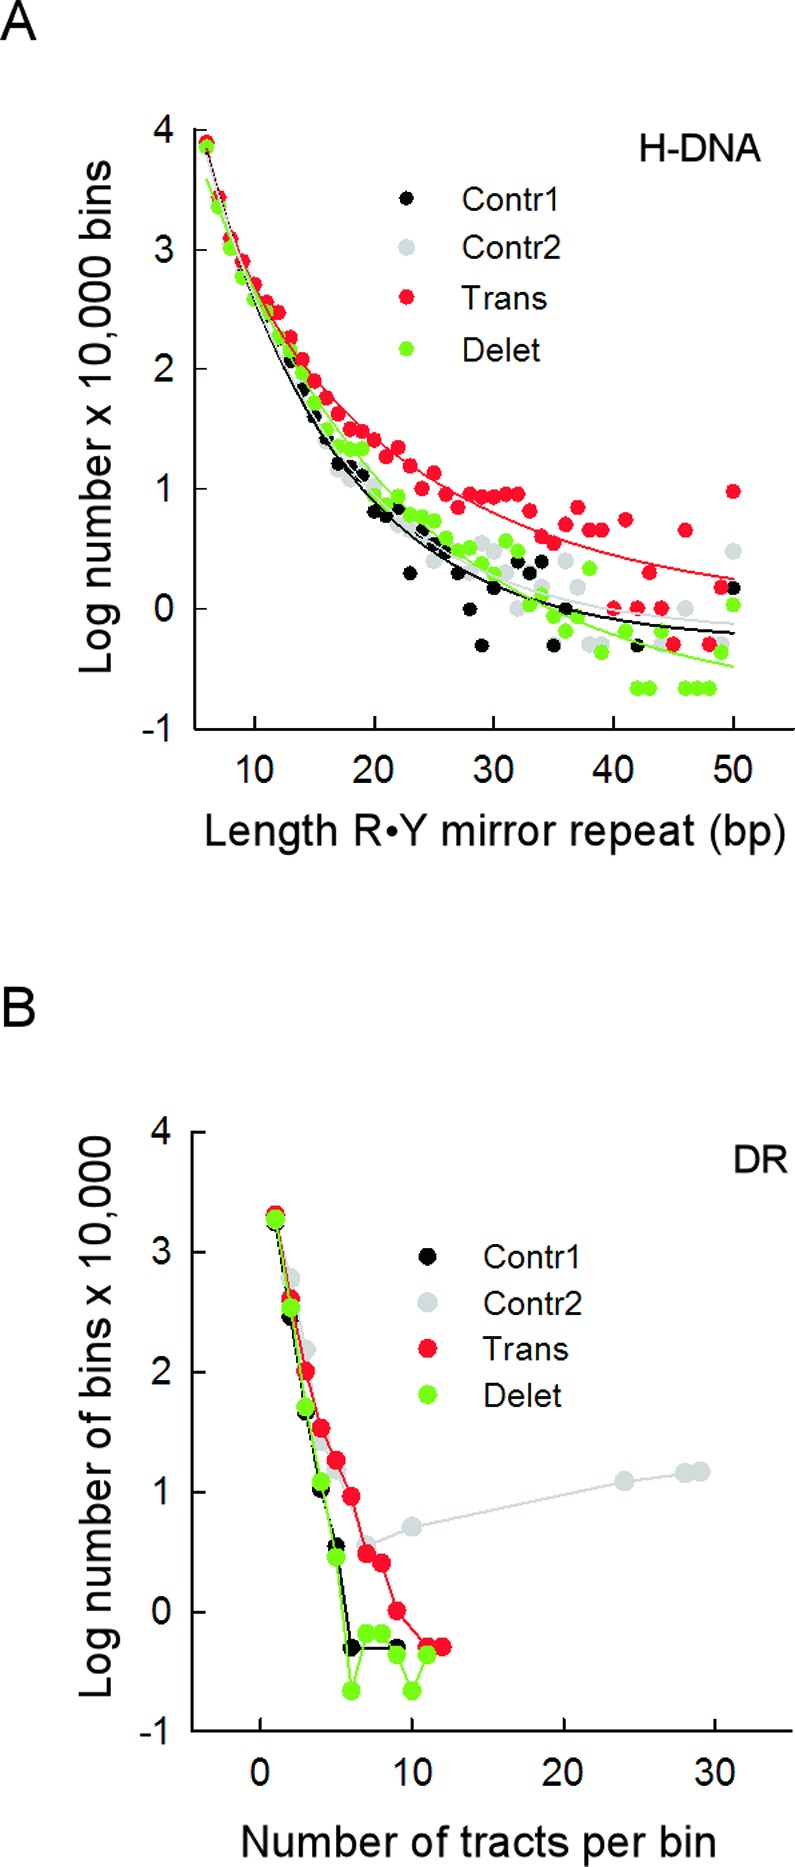
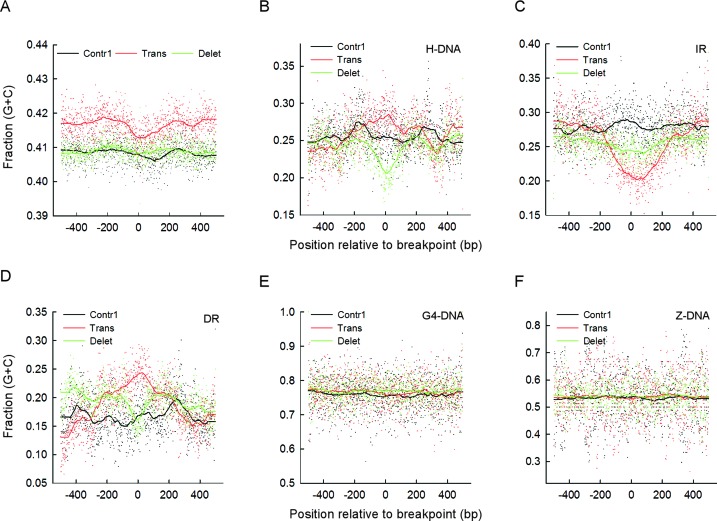
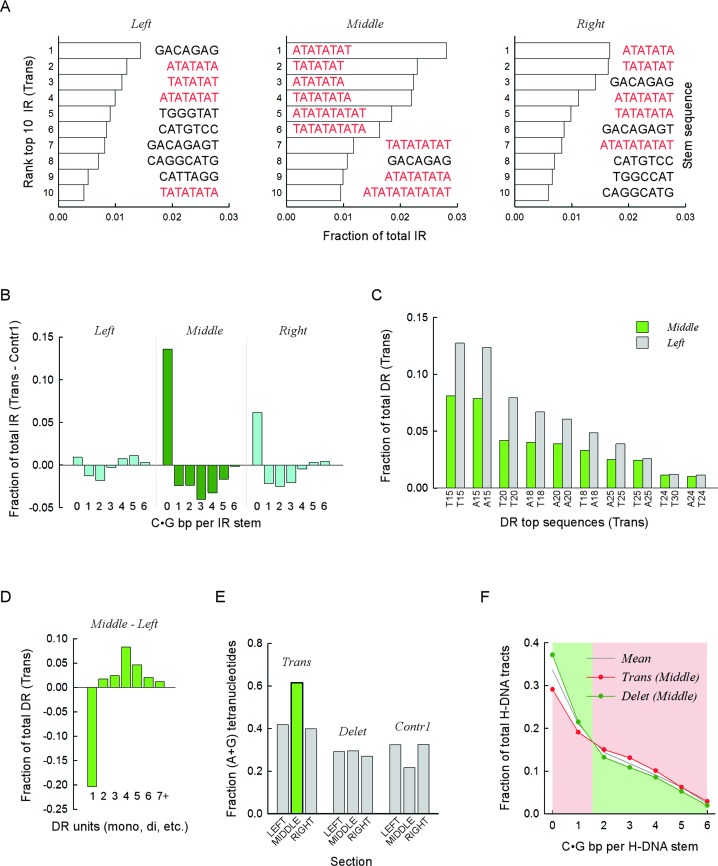
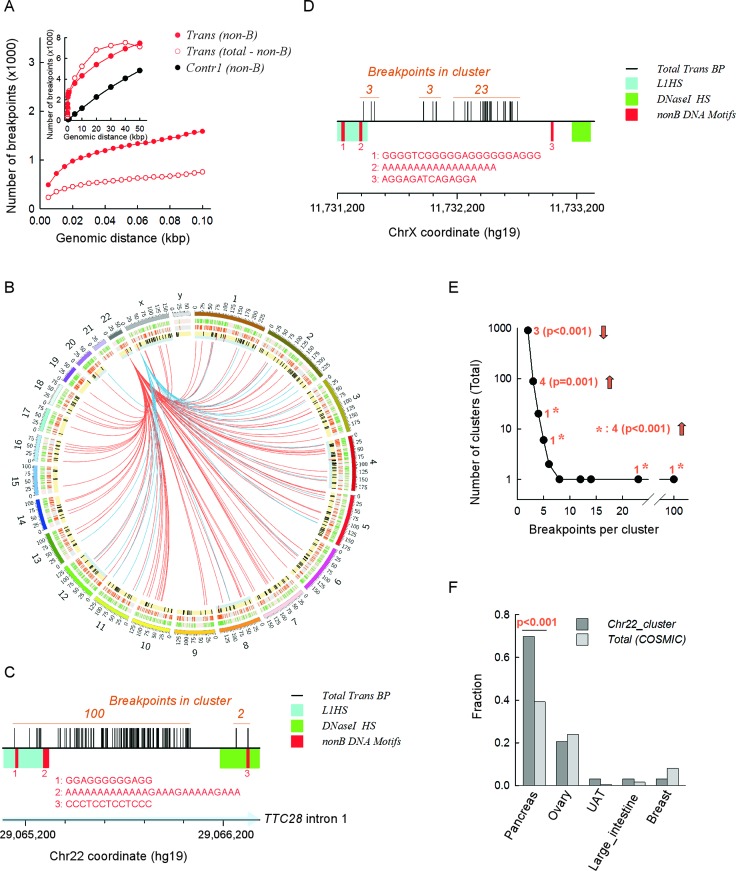
Gross chromosomal rearrangements (including translocations, deletions, insertions and duplications) are a hallmark of cancer genomes and often create oncogenic fusion genes. An obligate step in the generation of such gross rearrangements is the formation of DNA double-strand breaks (DSBs). Since the genomic distribution of rearrangement breakpoints is non-random, intrinsic cellular factors may predispose certain genomic regions to breakage. Notably, certain DNA sequences with the potential to fold into secondary structures [potential non-B DNA structures (PONDS); e.g. triplexes, quadruplexes, hairpin/cruciforms, Z-DNA and single-stranded looped-out structures with implications in DNA replication and transcription] can stimulate the formation of DNA DSBs. Here, we tested the postulate that these DNA sequences might be found at, or in close proximity to, rearrangement breakpoints. By analyzing the distribution of PONDS-forming sequences within ±500 bases of 19 947 translocation and 46 365 sequence-characterized deletion breakpoints in cancer genomes, we find significant association between PONDS-forming repeats and cancer breakpoints. Specifically, (AT)n, (GAA)n and (GAAA)n constitute the most frequent repeats at translocation breakpoints, whereas A-tracts occur preferentially at deletion breakpoints. Translocation breakpoints near PONDS-forming repeats also recur in different individuals and patient tumor samples. Hence, PONDS-forming sequences represent an intrinsic risk factor for genomic rearrangements in cancer genomes.


Figures

Figure 1.
Figure 1.
Translocation and deletion breakpoints occur near PONDS-forming motifs. (A) Schematic of a 1 kb-bin showing the breakpoint at position 0 and three sections: left from −500 to −177; middle from −176 to 176; and right from 177 to 500. (B) Number of DNA triplex-forming repeats (H-DNA) for 10 000 bins found near translocation (red), deletion (green) and Contr1 (black) breakpoints. (C) Same as in B, but for cruciform-forming inverted repeats (IR). (D) Same as in B, but for loop DNA-forming tandem repeats (DR). (E) Same as in B, but for quadruplex-forming repeats (G4-DNA). (F) Same as in B, but for left-handed DNA-forming repeats (Z-DNA). Numbers refers to the counts of bases belonging to each repeat type at every position; for H-DNA and IR, any bases separating a pair of repeats were excluded from the count.
Figure 2.
Figure 2.
Translocation breakpoints occur near long H-DNA-forming and closely-spaced DR-forming tracts. (A) Length distribution of R•Y mirror repeat tracts in 1-kb bins containing translocation (red), deletion (green), Contr1 (black) and Contr2 (gray) breakpoints. Length refers to the number of bp in each of the two mirror repeats, not including the intervening sequences separating them. (B) Distribution of the number of DR tracts in the 1-kb bins (density) for translocation (red), deletion (green), Contr1 (black) and Contr2 (gray) breakpoints.
Figure 3.
Figure 3.
GC content is repeat-type specific and can vary substantially at translocation and deletion breakpoints. (A) Average GC content at each position along 1-kb bins and running average of the data using 0.100 of sampling proportions for the full COSMIC dataset of translocation (red) and deletion (green) breakpoints and for the Contr1 dataset (black). (B) Average GC content for H-DNA repeats (any sequence separating two mirror repeats was not included) at every position along 1-kb bins and running average of the data using 0.100 of sampling proportions. (C) Same as in B, but for IR (any sequence separating two IR sequences was not included). (D) Same as in B, but for DR. (E) Same as in B, but for G4-DNA. (F) Same as in B, but for Z-DNA.
Figure 4.
Figure 4.
Specific sequence combinations are strongly associated with translocation and deletion breakpoints. (A) Top ten IR sequences most frequently found near translocation breakpoints. Bars, fractions relative to all IR present in the respective sections, left, middle and right. Color distinguishes between mixed-type sequences (black) and pure (A•T)-containing motifs (red). Sequence corresponds to the upstream (lowest genomic coordinates) repeat, excluding any intervening sequence. Stem, sequence of predicted stem-loop cruciform structures. (B) For each upstream (lowest genomic coordinate) IR sequence containing from zero to six C|G bases, the fraction of the total number of IR found in the left, middle and right sections was computed for the translocation and Contr1 1-kb bins. The fractions obtained for Contr1 were subtracted from those obtained for the translocations and the differences were plotted separately for each section. Negative values indicate overrepresentation of IR sequences in the control bins, whereas positive values indicate overrepresentation in translocation bins. Data for the middle section (dark green) are distinguished from the left and right sections (cyan). (C) Top ten DR sequences most frequently found in the left and middle sections of translocation breakpoints. Bars, fractions relative to all DR present in the respective section. All sequences are (A•T)n mononucleotides, with n ranging from 15 to 30. X-axis, sequence composition of hg19 reference genome sequence, top strand. (D) For DR, the fractions of mono-, di-, tri-, tetra-, penta-, hexa- and >hexa-nucleotides were computed separately for the translocation left and middle sections. Data plotted for the left section were subtracted from those of the middle section. Negative values indicate underrepresentation in the middle section, and vice versa. (E) For DR found in either the left, middle or right sections of the translocation, deletion and Contr1 1-kb bins, the fraction of tetra-nucleotides whose strand sequence composition contained only purines (or pyrimidines, i.e. R•Y tracts) relative to all tetra-nucleotides in the respective section was computed and plotted. The green bar highlights the overrepresentation of R•Y-containing tetranucleotides in the middle section of translocations. (F) For H-DNA, the fraction of repeats containing from zero to six C|G bases in the upstream (lower genomic coordinates) R•Y mirror repeat unit (stem of putative triplex structures) was taken for the middle sections of translocation and deletion 1-kb bins and plotted as a function of C|G occurrences. Note that a value of 0 refers to (A•T)n mononucleotide repeats and that C|G bases could be either contiguous or not. Mean, data for the combined distributions. Pink and green backgrounds highlight the shift in overrepresentation occurring between 1 and 2 C|G.
Figure 5.
Figure 5.
Clusters of translocation breakpoints occur near both PONDS-forming repeats and L1 retrotransposons. (A) Inset. Total number of breakpoints (y-axis) located within 10 bp to 50 kb (x-axis) from one another. Black circles, subset of breakpoints within ±250 bp of a PONDS-forming repeat present in the Contr1 dataset. Solid red circles, subset of breakpoints within ±250 bp of a PONDS-forming repeat present in the translocation dataset. Open red circles, subset of breakpoints in the COSMIC dataset (total) left after the data from ‘solid red circles’ were subtracted. Main panel, same as inset displaying clustered breakpoints separated by 10–100 bps. (B) Circos plot showing the two main clusters (distance separating any two breakpoints, ≤100 bps) of recurrent translocation (note that rather than being translocations, these may be transductions) events in the COSMIC dataset involving the 3′-end tail of two L1HS transposons, one at 22q12.1 (red links) and the other at Xp22.2 (blue links). Outer circle (green bars on pink background), the 2349 clustered translocation breakpoints in the COSMIC dataset (distance separating any two breakpoints, ≤100 bps); middle circle (orange bars on grey background), the 1586 clustered translocation breakpoints in the COSMIC dataset that are within ±250 bp of a PONDS-forming repeat; inner circle (black and red bars on yellow background), the 311 full-length L1HS transposons mapped on to the hg19 reference human genome assembly; long red bars on thin cyan background, the eight L1HS transposons with a 3′-end tail within ±1-kb of clustered translocation breakpoints. (C) Expansion of the genomic region containing the largest (100 events) translocation cluster breakpoints in the COSMIC dataset (total) on 22q12.1. x-axis, 200 bp tick intervals highlighting (light blue) the direction of TCC28 gene transcription; vertical black bars, individual breakpoints; cyan box, L1HS 3′-end region; green box, zone of highest regional DNaseI hypersensitivity; red bars, numbers and sequences, location and sequence of PONDS-forming repeats. (D) Expansion of the genomic region containing the second largest (23 events) translocation cluster breakpoints in the COSMIC dataset (total) on Xp22.2. Legends are as in panel C. (E) Plot displaying the distribution of the number of breakpoint translocation clusters present in the COSMIC dataset (distance separating any two breakpoints, ≤100 bps; y-axis) containing increasing numbers of events (x-axis). Orange, number of clusters found within ±1-kb of L1HS 3′-end tails and P-value obtained from z-tests. Asterisks, z-test on combined single clusters with >4 events each. Upward and downward arrows signify over or underrepresentation, respectively. (F) Fractions of the main cancer types represented in the full (total) COSMIC dataset (light gray) and in the major translocation breakpoint cluster on 22q12.1 (dark gray). UAT, upper aerodigestive tract.

References

    1. Forbes S.A., Beare D., Gunasekaran P., Leung K., Bindal N., Boutselakis H., Ding M., Bamford S., Cole C., Ward S., et al. COSMIC: exploring the world's knowledge of somatic mutations in human cancer. Nucleic Acids Res. 2015;43:D805–D811. - PMC - PubMed
    1. Aparicio T., Baer R., Gautier J. DNA double-strand break repair pathway choice and cancer. DNA Repair. 2014;19:169–175. - PMC - PubMed
    1. Tsai A.G., Lu H., Raghavan S.C., Muschen M., Hsieh CL, Lieber M.R. Human chromosomal translocations at CpG sites and a theoretical basis for their lineage and stage specificity. Cell. 2008;135:1130–1142. - PMC - PubMed
    1. Shortt J., Johnstone R.W. Oncogenes in cell survival and cell death. Cold Spring Harb. Perspect. Biol. 2012;4:a009829. - PMC - PubMed
    1. Mertens F., Johansson B., Fioretos T., Mitelman F. The emerging complexity of gene fusions in cancer. Nat. Rev. Cancer. 2015;15:371–381. - PubMed

Publication types