. 2017 May;18(4):540-554.
doi: 10.1111/mpp.12416. Epub 2016 Jul 1.

The bile acid deoxycholate elicits defences in Arabidopsis and reduces bacterial infection

Affiliations

The bile acid deoxycholate elicits defences in Arabidopsis and reduces bacterial infection

Marco Zarattini et al. Mol Plant Pathol. 2017 May.

Abstract

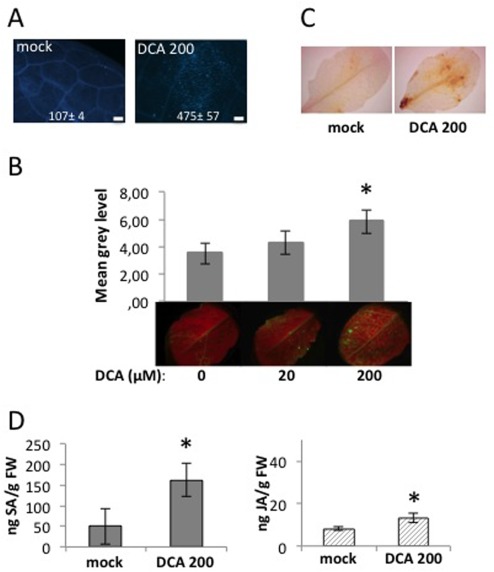
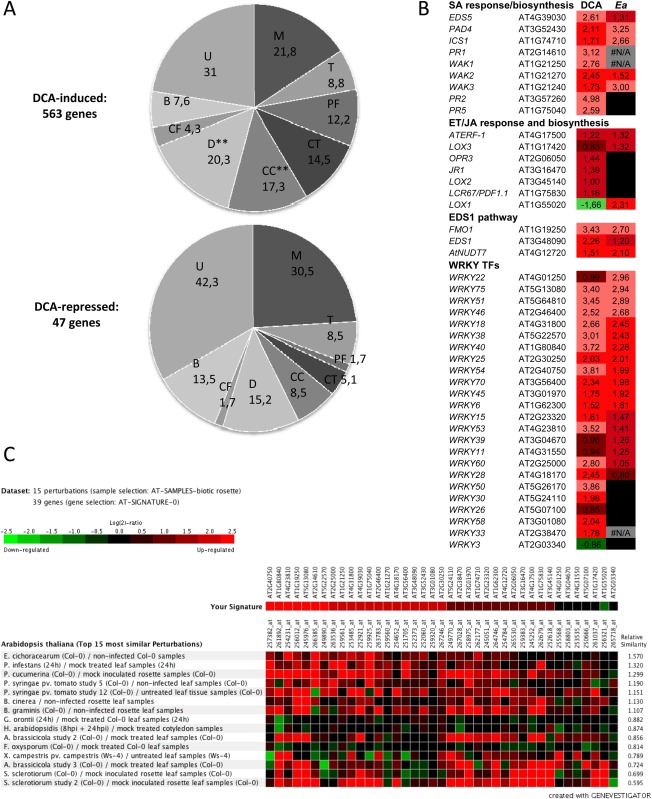
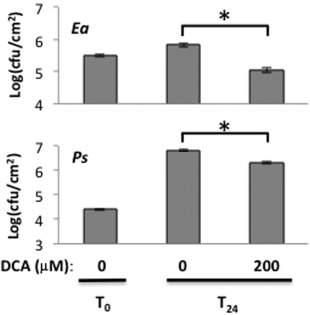
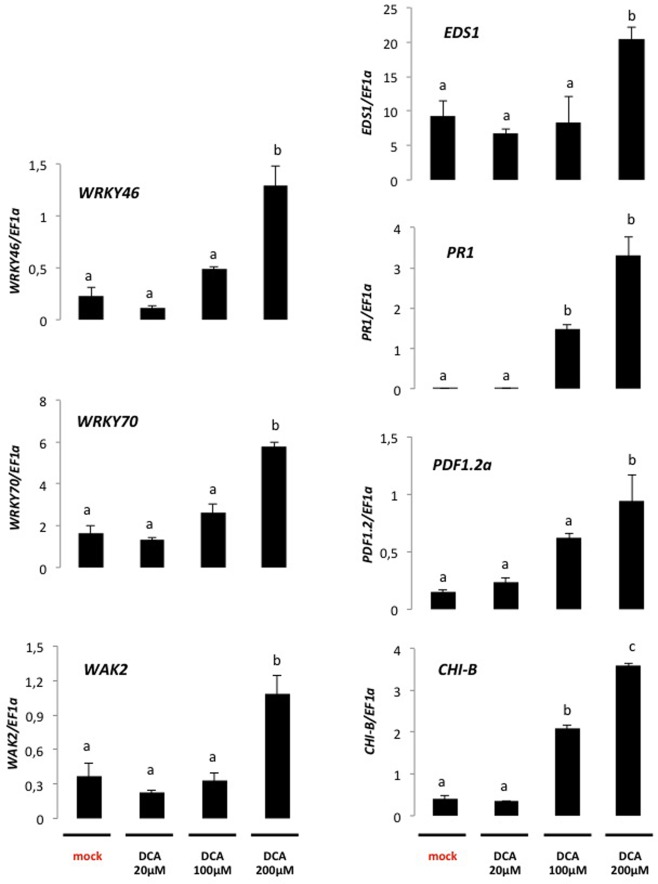
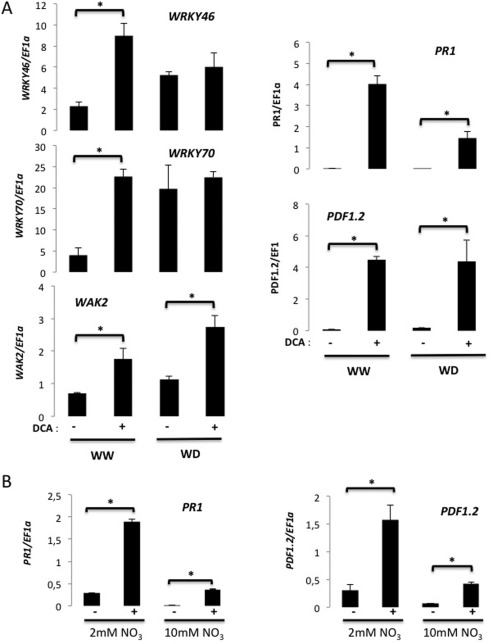
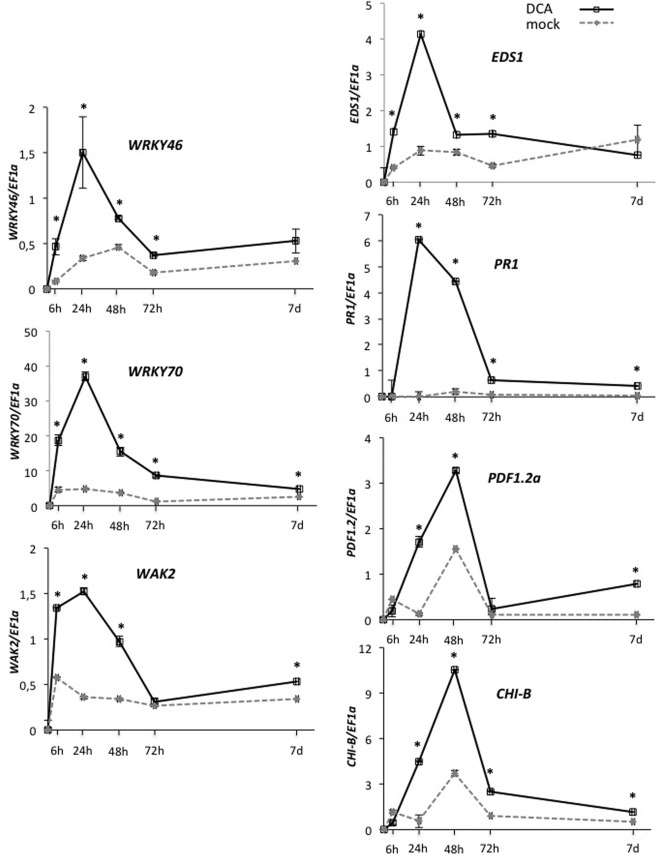
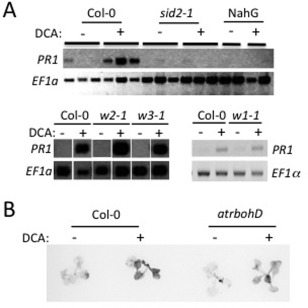
Disease has an effect on crop yields, causing significant losses. As the worldwide demand for agricultural products increases, there is a need to pursue the development of new methods to protect crops from disease. One mechanism of plant protection is through the activation of the plant immune system. By exogenous application, 'plant activator molecules' with elicitor properties can be used to activate the plant immune system. These defence-inducing molecules represent a powerful and often environmentally friendly tool to fight pathogens. We show that the secondary bile acid deoxycholic acid (DCA) induces defence in Arabidopsis and reduces the proliferation of two bacterial phytopathogens: Erwinia amylovora and Pseudomonas syringae pv. tomato. We describe the global defence response triggered by this new plant activator in Arabidopsis at the transcriptional level. Several induced genes were selected for further analysis by quantitative reverse transcription-polymerase chain reaction. We describe the kinetics of their induction and show that abiotic stress, such as moderate drought or nitrogen limitation, does not impede DCA induction of defence. Finally, we investigate the role in the activation of defence by this bile acid of the salicylic acid biosynthesis gene SID2, of the receptor-like kinase family genes WAK1-3 and of the NADPH oxidase-encoding RbohD gene. Altogether, we show that DCA constitutes a promising molecule for plant protection which can induce complementary lines of defence, such as callose deposition, reactive oxygen species accumulation and the jasmonic acid and salicylic acid signalling pathways.

Keywords: Erwinia amylovora; Pseudomonas syringae; SID2; WAK; bile acid; elicitor; plant defence.


Figures

Figure 1
Figure 1
Deoxycholic acid (DCA) induces defence accumulation in Arabidopsis leaves. Arabidopsis leaves of 5‐week‐old plants were sprayed with DCA at the indicated concentration (20 or 200 μm) or mock‐treated. (A) Leaves were stained with aniline blue at 24 h post‐treatment (hpt) to detect callose deposition. The bar represents 200 μm. The numbers in each photograph indicate the mean number of spots per photograph ± standard error of the mean (SEM). (B) Leaves were sampled at 16 hpt and inoculated with 2′,7′‐dichlorofluorescein diacetate (DCFH‐DA). The fluorescence level of DCFH‐DA, which reveals the presence of H2O2, was measured using ImageJ (n = 9). The bars represent the mean ± SEM. (C) Leaves were collected at 6 hpt and infiltrated with 3,3′‐diaminobenzidine (DAB). The brown colour reveals the presence of H2O2. (A–C) Nine leaves (n = 9) from three plants were used for each condition. Three independent experiments were perfomed that gave similar results. Representative photographs are shown. (D) Quantification of salicylic acid (SA) and jasmonic acid (JA) contents using high‐performance liquid chromatography‐electrospray ionization‐tandem mass spectrometry (HPLC‐ESI‐MS/MS). For each independent experiment, 20 leaves from four plants were collected (n = 4) at 24 hpt and ground for JA and SA extraction. The bars represent the standard deviation (SD). For SA quantification, two independent experiments were perfomed that gave similar and statistically significant results. For JA quantification, the results of three independent experiments were pooled. FW, fresh weight. (B, D) The asterisk indicates a significant difference from mock‐treated leaves according to the Mann–Whitney test (P < 0.05).
Figure 2
Figure 2
Deoxycholic acid (DCA) induces major transcriptional reprogramming in Arabidopsis leaves. Five‐week‐old Arabidopsis leaves were sprayed with 200 μm DCA or mock‐treated. Leaves were collected at 24 h post‐treatment (hpt) and RNA was extracted. Transcriptome analysis was performed using Complete Arabidopsis Transcriptome Microarray (CATMA) chips. (A) Functional categories of induced (563) and repressed (47) genes according to the MIPS database. B, biogenesis of cellular components; CC, cellular communication; CF, cell fate; CT, cellular transport; D, defence; M, metabolism; PF, protein fate; T, transcription; U, unclassified. Asterisks indicate an over‐representation of the corresponding functional category compared with the Arabidopsis genome (P < 0.005). The values correspond to the percentages of induced or repressed genes. (B) Microarray data for selected genes associated with defence. Values are log2 signal ratios between DCA (DCA)‐ or Erwinia amylovora (Ea)‐treated plants and mock‐treated control plants. Positive (red and pink boxes) and negative (green boxes) values correspond to genes up‐ and down‐regulated, respectively, in response to DCA or E. amylovora (Moreau et al., 2012). Black boxes indicate that gene expression was not significantly changed according to the Bonferroni test (P < 0.05). Grey boxes correspond to missing values. (C) Most similar transcriptome datasets, with respect to selected defence‐related genes, according to the Genevestigator ‘Signature’ tool. The top line (‘Your signature’) corresponds to log2 signal ratios between DCA (DCA)‐ and mock‐treated plants (this study). All lines below correspond to log2 signal ratios between pathogen‐infected and mock‐treated wild‐type plants as indicated.
Figure 3
Figure 3
Deoxycholic acid (DCA) reduces the in planta growth of phytopathogens. Arabidopsis leaves were sprayed with 200 μm DCA 24 h prior to infection with Pseudomonas syringae pv. tomato [Ps; optical density (OD) = 0.01, 106 colony‐forming units (cfu)/mL] or Erwinia amylovora (Ea; OD = 0.1, 107 cfu/mL). For each experiment, 10 leaves (n = 10) were collected immediately after infection (T0) or 24 h post‐infection (T24), ground and cfu/cm2 was determined. Bars show the mean number of cfu/cm2 of leaf ± standard error of the mean (SEM). Experiments were repeated three times with similar results. The asterisk indicates a significant difference from the mock‐treated plants at the same time point according to the Mann–Whitney test (P < 0.05).
Figure 4
Figure 4
Deoxycholic acid (DCA) induces defence‐related gene expression in a dose‐dependent manner. The expression of selected defence genes was evaluated 24 h following mock treatment or treatment with increasing concentrations of DCA (as indicated). Nine leaves of three plants were collected for RNA extraction (n = 3). Transcript accumulation was determined by quantitative reverse transcription‐polymerase chain reaction (qRT‐PCR). Bars represent the mean expression ± standard deviation (SD). Bars with the letter ‘a’ correspond to expression levels that are not significantly different from expression in mock‐treated leaves according to the Mann–Whitney test (P < 0.05). Bars with the letters ‘b’ and ‘c’ correspond to expression levels that are significantly different from expression in mock‐treated leaves and from each other according to the Mann–Whitney test (P < 0.05). The experiment was repeated twice with similar and statistically significant results.
Figure 5
Figure 5
Effect of drought on the deoxycholic acid (DCA)‐mediated induction of defence. (A) Quantitative reverse transcription‐polymerase chain reaction (qRT‐PCR) analysis of selected genes 24 h after mock (–) or 200 µm DCA (+) treatment in Arabidopsis Col‐0 plants under well‐watered (WW) or water deficit (WD) conditions, as described in Bouchabke et al. (2008). (B) qRT‐PCR analysis of selected genes 24 h after mock (–) or 200 µm DCA (+) treatment in Arabidopsis Col‐0 plants grown in limiting (2 mm NO3) or non‐limiting (10 mm NO3) nitrate. (A, B) Nine leaves from three plants (n = 3) were collected 24 h after DCA or mock treatment. Bars represent the mean expression ± standard deviation (SD). The experiments were repeated twice with similar and statistically significant results. The asterisk indicates significant difference according to the Mann–Whitney test (P < 0.05).
Figure 6
Figure 6
Kinetics of defence induction triggered by deoxycholic acid (DCA) treatment. The expression of selected defence genes was monitored at different time points between 6 h and 7 days following mock (broken line with diamonds) or 200 μm DCA (full line with squares) treatment. Nine leaves from three plants (n = 3) were collected at the indicated time point following mock treatment or treament with 200 μm DCA. Transcript accumulation was determinated by quantitative reverse transcription‐polymerase chain reaction (qRT‐PCR). Values represent the mean expression ± standard deviation (SD). The experiments were repeated twice with similar and statistically significant results. The asterisk indicates a significant difference from mock‐treated plants according to the Mann–Whitney test (P < 0.05).
Figure 7
Figure 7
SID2 and RbohD are required for defence activation by deoxycholic acid (DCA). (A) Reverse transcription‐polymerase chain reaction (RT‐PCR) analysis of the expression of PR1 in 2‐week‐old in vitro‐grown seedlings treated (+) or not (–) with 200 μm DCA and sampled 24 h after treatment. The EF1α gene was used as an internal standard for the quantity of cDNA. Each lane corresponds to a pool of 10 seedlings and the experiment was conducted three times. w1‐1, wak1‐1; w2‐1, wak2‐1; w3‐1, wak3‐1. The figure was rearranged for clarity; the original image is available in Fig. S4 (see Supporting Information). (B) 3,3′‐Diaminobenzidine (DAB) staining of 2‐week‐old seedlings treated with 200 μm DCA (+) or mock‐treated (–). The experiment was performed on 20 seedlings and the figure shows photographs of representative seedlings.

Similar articles

Cited by

References

    1. Bouchabke, O. , Chang, F. , Simon, M. , Voisin, R. , Pelletier, G. and Durand‐Tardif, M. (2008) Natural variation in Arabidopsis thaliana as a tool for highlighting differential drought responses. PLos One, 3, e1705. - PMC - PubMed
    1. Crow, J.P. (1997) Dichlorodihydrofluorescein and dihydrorhodamine 123 are sensitive indicators of peroxynitrite in vitro: implications for intracellular measurement of reactive nitrogen and oxygen species. Nitric Oxide, 1, 145–157. - PubMed
    1. Crowe, M. , Serizet, C. , Thareau, V. , Aubourg, S. , Rouzé, P. , Hilson, P. , Beynon, J. , Weisbeek, P. , van Hummelen, P. , Reymond, P. , Paz‐Ares, J. , Nietfeld, W. and Trick, M. (2003) CATMA: a complete Arabidopsis GST database. Nucleic Acids Res. 31, 156–158. - PMC - PubMed
    1. Czechowski, T. , Stitt, M. , Altmann, T. , Udvardi, M.K. and Scheible, W.R. (2005) Genome‐wide identification and testing of superior reference genes for transcript normalization in Arabidopsis. Plant Physiol. 139, 5–17. - PMC - PubMed
    1. Dave, A. and Graham, I.A. (2012) Oxylipin signaling: a distinct role for the jasmonic acid precursor cis‐(+)−12‐oxo‐phytodienoic acid (cis‐OPDA). Front. Plant Sci. 3, 42, - PMC - PubMed

MeSH terms