. 2016 May 19;44(9):4222-32.
doi: 10.1093/nar/gkw268. Epub 2016 Apr 16.

The mutation spectrum in genomic late replication domains shapes mammalian GC content

Affiliations

The mutation spectrum in genomic late replication domains shapes mammalian GC content

Ephraim Kenigsberg et al. Nucleic Acids Res. .

Abstract

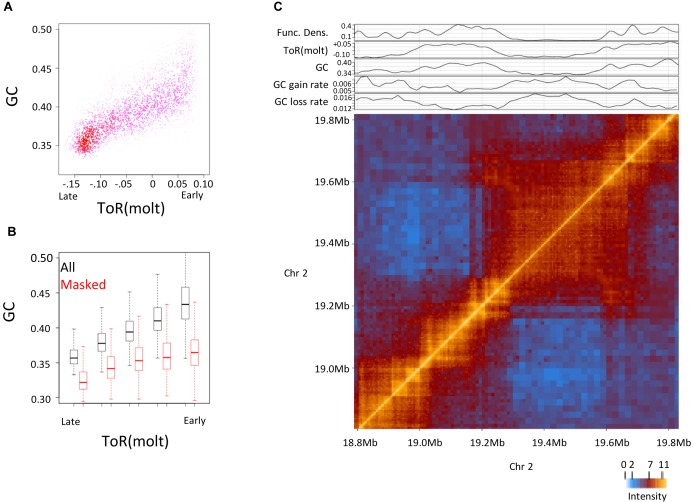
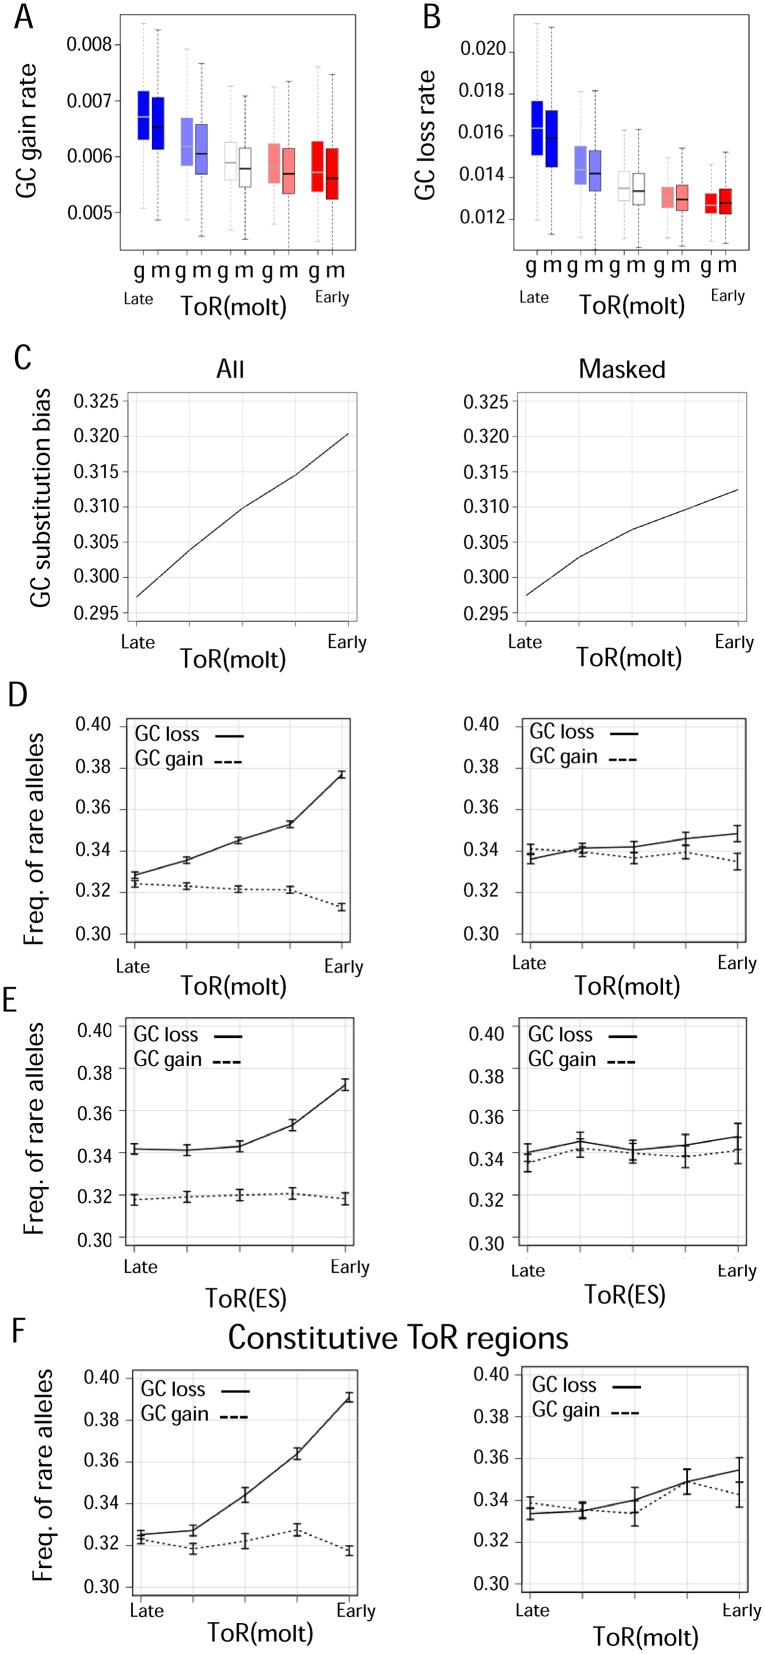
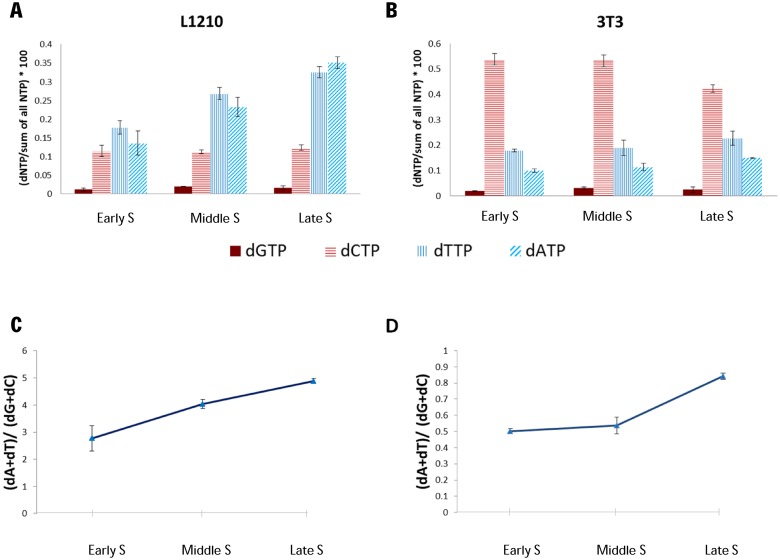
Genome sequence compositions and epigenetic organizations are correlated extensively across multiple length scales. Replication dynamics, in particular, is highly correlated with GC content. We combine genome-wide time of replication (ToR) data, topological domains maps and detailed functional epigenetic annotations to study the correlations between replication timing and GC content at multiple scales. We find that the decrease in genomic GC content at large scale late replicating regions can be explained by mutation bias favoring A/T nucleotide, without selection or biased gene conversion. Quantification of the free dNTP pool during the cell cycle is consistent with a mechanism involving replication-coupled mutation spectrum that favors AT nucleotides at late S-phase. We suggest that mammalian GC content composition is shaped by independent forces, globally modulating mutation bias and locally selecting on functional element. Deconvoluting these forces and analyzing them on their native scales is important for proper characterization of complex genomic correlations.


Figures

Figure 1.
Figure 1.
Decoupling multi-scale correlations between GC content, time of replication (ToR) and functional elements. (A) Correlation between GC content and ToR at large genomic scale. Shown is a density plot of GC versus ToR binned for 200 kb bins. (B and C) Multi-scale visualization of GC content and ToR. Domainograms of GC content (B) and ToR (C) across a section of chromosome 3. For every genomic coordinate (x-axis), shown are color-coded (blue–low/ late, red–high/early) averaged values over surrounding windows at multiple scales (y-axis), ranging from 1 to 2048 kb. (D) Correlation between GC content and ToR at a small genomic scale. Shown is a density plot of GC versus ToR binned for 2 kb bins. (E) Multi-scale visualization of functional density. Similarly to B and C shown is domainogram of functional density at multiple scales (y-axis) across the same genomic section (x-axis) (F) GC Correlation versus scale. Shown are Spearman correlations (y-axis) between GC content and ToR (black) or between GC content and functional elements density (red) at different genomic scales (x-axis) (G) genomic GC content versus ToR. Boxplot visualization of the distribution of genomic (All) and masked genomic (Masked) GC content (100 kb) versus ToR.
Figure 2.
Figure 2.
GC and time of replication of topological domains (A) Correlation between GC content and ToR binned by Hi-C domains. Shown is a density plot of GC versus ToR over chromosomal domains. (B) GC content versus ToR binned by Hi-C domains. Boxplot visualization of the distribution of genomic (All) and masked genomic (Masked) GC content versus ToR across chromosomal domains. (C) Hi-C map and projected GC profiles. Chromatin interaction intensity matrix around late replicating domain of chromosome 2 is shown (bottom, strong interaction levels—orange, weak interaction levels—blue) with linear profiles of functional density, ToR, GC content and inferred evolutionary rates of GC gain and GC loss that correspond to the same genomic section (top).
Figure 3.
Figure 3.
Evolutionary analysis of GC dynamics betweenand within species. A) GC gain substitutions vs. ToR. Shown are primates GC gaining substitution rates (y-axis) vs. ToR (x-axis), for the whole intergenic genome (g) or functionally masked (m) regions. B) GC loss substitutions rate vs. ToR. Shown are primates GC losing substitution rates (y-axis) vs. ToR (x-axis), for the whole intergenic genome (g) or functionally masked (m) regions. C) GC substitution bias vs. ToR. Shown is the rate of GC gaining substitutions divided by the sum of rates of GC gaining and GC losing substitutions for intergenic (left) or functionally masked (right) regions. D-F) Frequency of low frequency (rare) alleles involved in GC gaining and GC losing as a function of ToR. Shown are frequency of low frequency GC gaining alleles (dashed line) and GC losing alleles (solid line) for the whole intergenic genome (left) and for functionally masked regions (right) vs. ToR in limphoblasts (molt4) (D), embryonic stem cells (BG02) (E) and in limphoblasts (molt4) when restricting to genomic regions with constitutive ToR as defined in Rivera-Mulia et al (29). (F) All statistics are shown for 5 equally sized ToR percentile bins (0, 0.2, 0.4, 0.6, 0.8, 1.0). Error bars represent binomial confidence interval with 95% significance.
Figure 4.
Figure 4.
dNTPs ratio change along S phase. (A and B) The individual change of each dNTP along S phase. L1210 cells (A) were synchronized by Baby Machine, 3T3 cells (B) were synchronized by serum starvation. dNTPs and NTPs were extracted from synchronized cells in multiple points along S phase (the precise time points for early, middle and late S phase were determined according to FACS analysis–Supplementary Figures S9 and S10) and were measured using HPLC. dNTP Quantities were normalized to the total NTP measurements. The averages and standard errors of 2 to 5 independent measurements are shown. (C and D) The dA and dT fraction in the dNTP pool elevates with S phase progression. (dA+dT) to (dG+dC) ratio and standard error at multiple time points in S phase are shown for L1210 cells (C) and 3T3 cells (D). Ratios were calculated from normalized dNTP amounts shown in A and B. Note that the main difference between the two cell lines is in the levels of dCTPs. We do not know the source of this difference.

References

    1. Woodfine K., Fiegler H., Beare D.M., Collins J.E., McCann O.T., Young B.D., Debernardi S., Mott R., Dunham I., Carter N.P. Replication timing of the human genome. Hum. Mol. Genet. 2004;13:191–202. - PubMed
    1. Bernardi G., Olofsson B., Filipski J., Zerial M., Salinas J., Cuny G., Meunier-Rotival M., Rodier F. The mosaic genome of warm-blooded vertebrates. Science. 1985;228:953–958. - PubMed
    1. Wolfe K.H., Sharp P.M., Li W.H. Mutation rates differ among regions of the mammalian genome. Nature. 1989;337:283–285. - PubMed
    1. Arndt P.F., Hwa T., Petrov D.A. Substantial regional variation in substitution rates in the human genome: importance of GC content, gene density, and telomere-specific effects. J. Mol. Evol. 2005;60:748–763. - PubMed
    1. Galtier N., Piganeau G., Mouchiroud D., Duret L. GC-content evolution in mammalian genomes: the biased gene conversion hypothesis. Genetics. 2001;159:907–911. - PMC - PubMed

Publication types