. 2016 May:94:162-175.
doi: 10.1016/j.yjmcc.2016.04.003. Epub 2016 Apr 13.

Influence of metabolic dysfunction on cardiac mechanics in decompensated hypertrophy and heart failure

Affiliations

Influence of metabolic dysfunction on cardiac mechanics in decompensated hypertrophy and heart failure

Shivendra G Tewari et al. J Mol Cell Cardiol. 2016 May.

Abstract

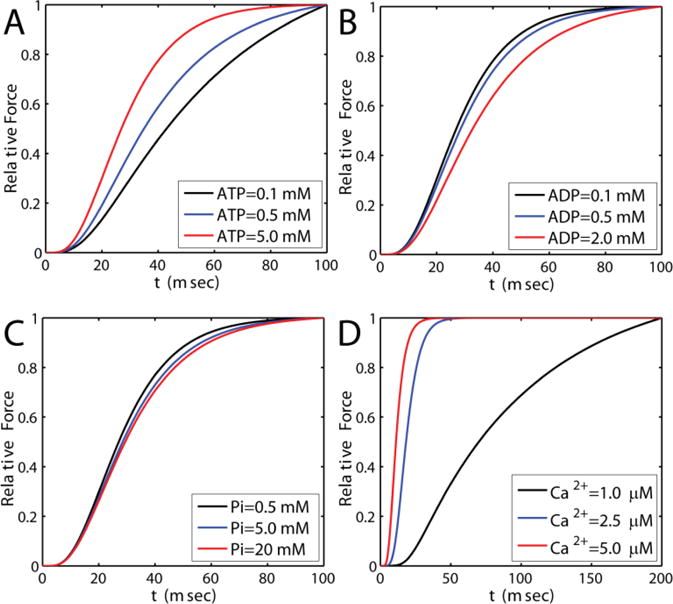
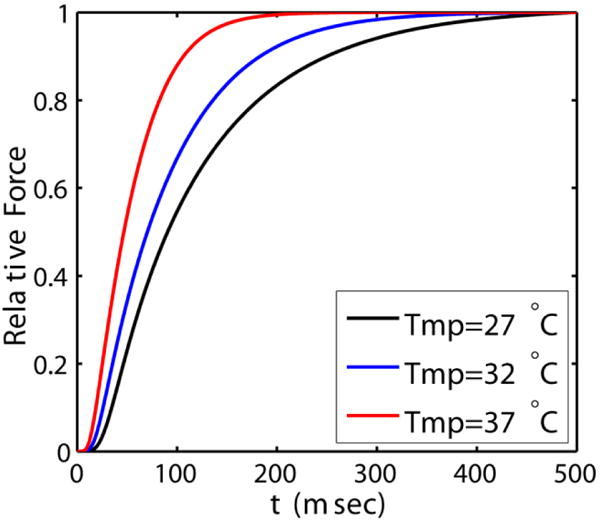
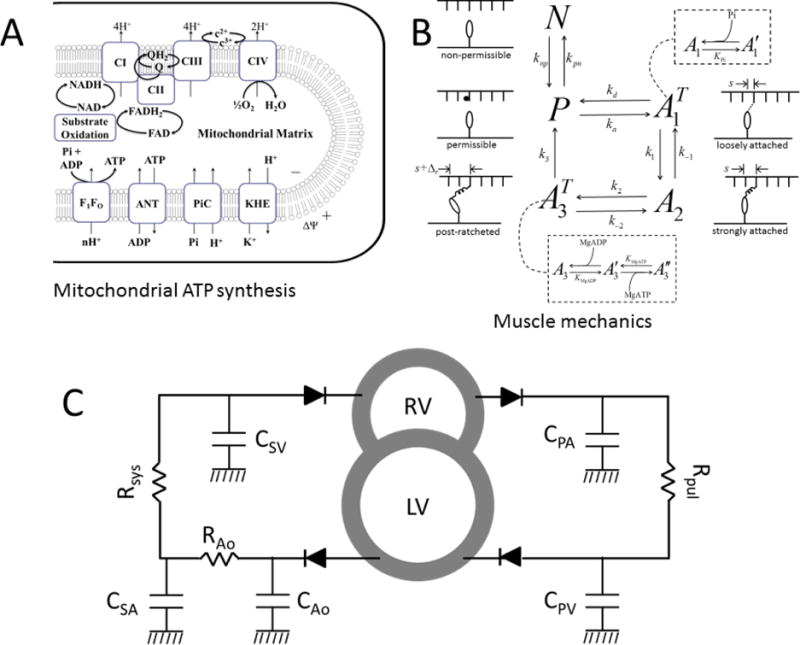
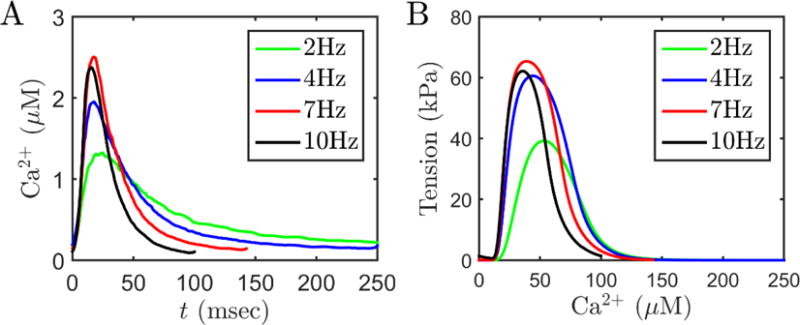
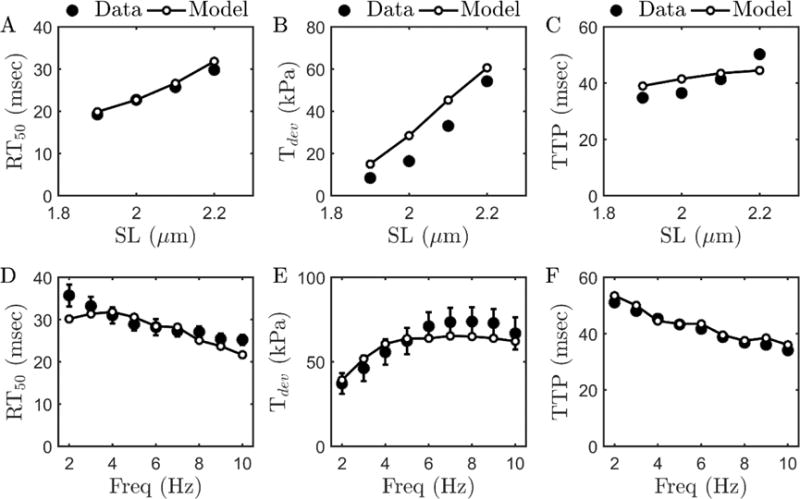
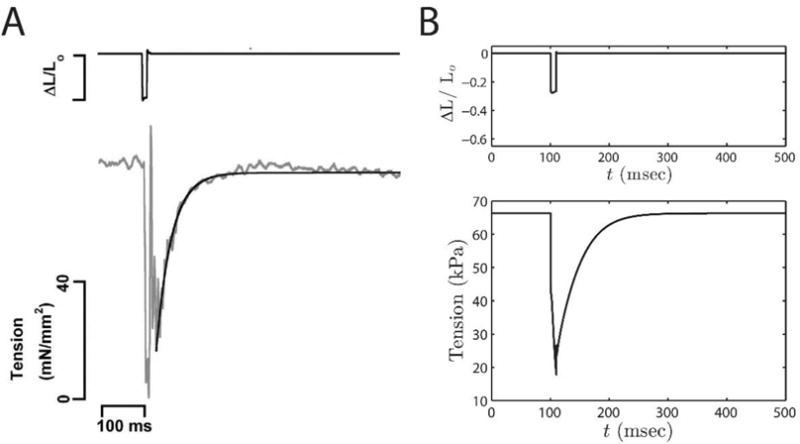
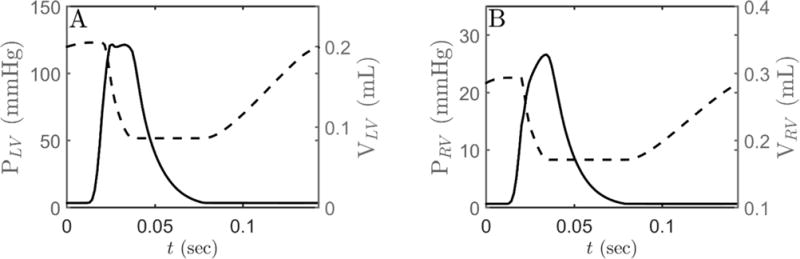
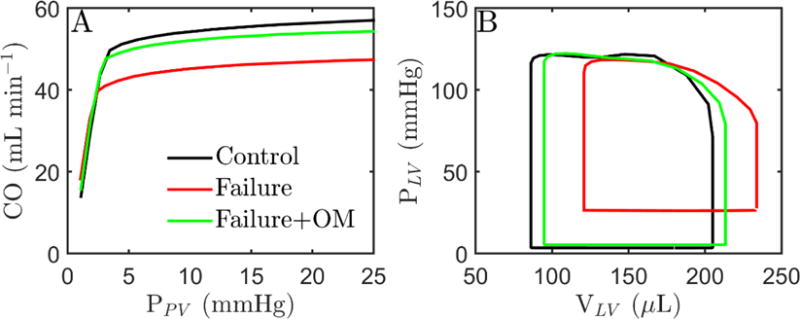
Alterations in energetic state of the myocardium are associated with decompensated heart failure in humans and in animal models. However, the functional consequences of the observed changes in energetic state on mechanical function are not known. The primary aim of the study was to quantify mechanical/energetic coupling in the heart and to determine if energetic dysfunction can contribute to mechanical failure. A secondary aim was to apply a quantitative systems pharmacology analysis to investigate the effects of drugs that target cross-bridge cycling kinetics in heart failure-associated energetic dysfunction. Herein, a model of metabolite- and calcium-dependent myocardial mechanics was developed from calcium concentration and tension time courses in rat cardiac muscle obtained at different lengths and stimulation frequencies. The muscle dynamics model accounting for the effect of metabolites was integrated into a model of the cardiac ventricles to simulate pressure-volume dynamics in the heart. This cardiac model was integrated into a simple model of the circulation to investigate the effects of metabolic state on whole-body function. Simulations predict that reductions in metabolite pools observed in canine models of heart failure can cause systolic dysfunction, blood volume expansion, venous congestion, and ventricular dilation. Simulations also predict that myosin-activating drugs may partially counteract the effects of energetic state on cross-bridge mechanics in heart failure while increasing myocardial oxygen consumption. Our model analysis demonstrates how metabolic changes observed in heart failure are alone sufficient to cause systolic dysfunction and whole-body heart failure symptoms.

Keywords: Congestive heart failure; Frank-Starling law; Metabolism; Myofilaments; Omecamtiv mecarbil.


Figures

Figure A.1
Figure A.1
A. Schematics of sarcomere geometry. Actin filaments have equal length in each half-sarcomere. Myosin-heads are attached on the thick filament which runs across the sarcomere. Along the M-line is region where there are no myosin-heads (also known as the bare region). It is assumed that length of thick-thin filament overlap influences binding affinity of Ca2+ with TrpC and hence affects forward cross-bridge cycling. B. Mechanics of cardiac muscle force generation. Fpas represents passive forces of the cardiac muscle due to titin or collagen, Fact is the active force generated due to myosinactin interaction, η is the viscosity of the cardiac muscle, and FSE = KSE (SLsetSL) is the force due to series elastic element used to simulate isosarcometric contraction. KSE is the stiffness of series element; SLset is the set sarcomere length and SL is the sarcomere length.
Figure D.1
Figure D.1
Geometry of the heart model used to simulate ventricular interaction. Modified and reproduced from Lumens et al. [16] (pending permission).
Figure E.1
Figure E.1
Force calcium length experiments and model simulations. (A) Force-calcium-length experiments from skinned rat cardiac muscle (figure reproduced from Dobesh et al. [44], pending permission). (B) simulations of the experiments using identified myofilament model. Experiments were done at sarcomere lengths of 1.85, 1.95, 2.05, 2.15 and 2.25 μm. Force responses are reported with respect to the maximum force obtained at sarcomere length of 1.85 μm. Model simulations are done with ATP = 5mM, ADP = 0mM, and Pi = 0mM.
Figure F.1
Figure F.1
Model mimics the effect of increasing muscle length on developed force and force transient. A. Experimental data showing increases in force with increasing muscle length (Figure reproduced from Janssen et al.[19], pending permission). B. Model simulations of the effect of increasing sarcomere length on force transients. Cardiac muscle model is held at sarcomere lengths indicated in the legend and stimulated at a frequency of 4 Hz. The stiffness of the series elastic element allows iso-sarcometric shortening (KSE = 1000 kPa/μm). The model effectively matches the increase in force and increase in time-to-peak force seen in the experiments (A).
Figure G.1
Figure G.1
Model simulations capturing the effect of ATP, ADP and Pi on rate of force development. A. ADP = 0mM, Pi = 0mM. ATP is as shown in the legend. B. ATP = 5mM, Pi = 0mM. ADP is as shown in the legend. C. ATP = 5mM, ADP = 0mM, and Pi is as shown in the legend. Temperature is 20 °C and Ca2+ is 15 μM. D. ATP = 5mM, ADP = 0 mM, Pi = 0mM and Ca2+ as shown in the legend. Temperature is 20 C.
Figure H.1
Figure H.1
Model simulations of force development at three different temperatures (see legend). Ktr values at these temperatures are calculated by method explained in the main-text.
Figure 1
Figure 1
Schematics showing mechanoenergetics coupling and whole-body cardiovascular system. A. Model of oxidative phosphorylation used to compute metabolite concentration from basal ATP hydrolysis rate under normal and failing-heart conditions. B. Schematics of the cross-bridge kinetic model. The state N is a non-permissible XB state where myosin heads cannot bind with actin (as in the absence of cytosolic Ca2+), while P is a permissible XB state during which myosin heads can bind with actin molecules. The transition from state N to P depends on thick-thin filament overlap and Ca2+ concentration. The states A1T and A2 represent loosely and strongly bound cross-bridge attached state; A3T is the strongly bound (post-ratcheted or post-powerstroke) state. C. Schematics of the CVS model used to simulate Frank-Starling curves. Diodes represent inlet/outlet valves and ensure one-way blood flow. CPA, CPV, CSA, CAo and CSV represent lumped compliances of pulmonary artery, pulmonary vein, systemic artery and systemic vein. Rpul, Rsys and RAo represent vascular resistances. RV and LV represent right and left ventricular cavities.
Figure 2
Figure 2
Calcium and tension transients in rat cardiac muscle. A. Representative time courses of Ca2+ data used to drive the myofilament model. Frequency dependent acceleration of relaxation is clearly visible. Data are from Janssen et al. [19]. B. Model simulated tension transients were used to compute TTP, RT50 and Tdev. For these simulations, SL is fixed at 2.2 μm, temperature is 37.5 °C and metabolite concentrations are: MgATP = 8 mM; MgADP = 18 μM; Pi = 0.6 mM (representative of resting level metabolites concentrations under physiological conditions).
Figure 3
Figure 3
Model fits to force-frequency-length data [19] from rat cardiac muscle obtained at 37.5 °C using the myofilament model. (A, B, C) show RT50, Tdev, and TTP data obtained at four different muscle lengths corresponding to SL’s of 1.9, 2.0, 2.1 and 2.2 μm. Stimulation frequency for these experiments was 4Hz. (D, E, F) RT50, Tdev, and TTP data obtained at optimal length (corresponding to SL of 2.2 μm) with different stimulation frequencies (2–10Hz). Metabolite concentrations are fixed to the physiological concentration as in Figure 2. Error bars shown in (D) and (E) represent standard error from the n=9 dataset [19].
Figure 4
Figure 4
Tension development in slack-restretch experiment and model simulations. A. Experiments (figure reproduced from Milani-Nejad et al. [20], pending permission) performed in intact rat cardiac muscle at body temperature. B. Model simulations of the experiments. The exponential increase in force is used to compute Ktr. Metabolite concentrations are set to: MgATP = 5 mM, MgADP = 16 μM, and Pi = 0.5 mM; temperature is set to 37 °C and Ca2+ is set to 1 μM. For the simulations shown here Lo = 2.2 μm.
Figure 5
Figure 5
(A) Model simulations of LV pressure (solid line) and LV volume. (B) RV pressure (solid line) and RV volume (dashed line). Simulations are performed using the CVS framework shown in Figure 1C. Ca2+ transient data, obtained at 7Hz stimulation frequency, is used to drive the myofilament kinetics which in turn drives heart mechanics.
Figure 6
Figure 6
Effect of metabolites and myosin activation on cardiovascular state. CVS model is simulated using Ca2+ transient obtained at 7Hz stimulation frequency. A. Frank-Starling curves computed at different preloads under control conditions (black curve), failing-heart conditions (red curve) and failing-heart conditions with 10−4 mol/L OM (green). B. LV pressure-volume curve with same conditions as in A except at different preload (black: ~3 mmHg, red: ~20 mmHg, green: ~4 mmHg). CO under three condition is (in units of mL min−1): 50 (black), 48 (red) and 50 (green).
Figure 7
Figure 7
Effects of myosin activation on cardiac work and ATP hydrolysis. A. Predicted rate of work done by LV (pressure-volume area multiplied by heart rate) is plotted as a function of relative value of the cross-bridge attachment rate parameter ka for conrol and failure conditions. B. The predicted rate of myosin ATPase flux in the LV free wall is plotted as a function of the value of ka. C. Mean systemic arterial (PA) and pulmonary venous (PPV) pressures are plotted as functions of the value of ka. For all simulations blood volume in the closed-loop circulatory system is adjusted to maintain approximately normal cardiac output, as described in the text. The baseline value of ka (294.1 sec−1) reflects the normal value from Table D.1.

References

    1. Kwan M, Woo J, Kwok T. The standard oxygen consumption value equivalent to one metabolic equivalent (3.5 ml/min/kg) is not appropriate for elderly people. Int J Food Sci Nutr. 2004;55:179–82. - PubMed
    1. Wu F, Zhang EY, Zhang J, Bache RJ, Beard DA. Phosphate metabolite concentrations and ATP hydrolysis potential in normal and ischaemic hearts. J Physiol. 2008;586:4193–208. - PMC - PubMed
    1. Wu F, Zhang J, Beard DA. Experimentally observed phenomena on cardiac energetics in heart failure emerge from simulations of cardiac metabolism. Proc Natl Acad Sci U S A. 2009;106:7143–8. - PMC - PubMed
    1. Conway MA, Allis J, Ouwerkerk R, Niioka T, Rajagopalan B, Radda GK. Detection of low phosphocreatine to ATP ratio in failing hypertrophied human myocardium by 31P magnetic resonance spectroscopy. Lancet. 1991;338:973–6. - PubMed
    1. Neubauer S, Horn M, Cramer M, Harre K, Newell JB, Peters W, et al. Myocardial phosphocreatine-to-ATP ratio is a predictor of mortality in patients with dilated cardiomyopathy. Circulation. 1997;96:2190–6. - PubMed

Publication types

MeSH terms

Substances