

Prediction of violent reoffending on release from prison: derivation and external validation of a scalable tool
- PMID: 27086134
- PMCID: PMC4898588
- DOI: 10.1016/S2215-0366(16)00103-6
Prediction of violent reoffending on release from prison: derivation and external validation of a scalable tool
Abstract
Background: More than 30 million people are released from prison worldwide every year, who include a group at high risk of perpetrating interpersonal violence. Because there is considerable inconsistency and inefficiency in identifying those who would benefit from interventions to reduce this risk, we developed and validated a clinical prediction rule to determine the risk of violent offending in released prisoners.
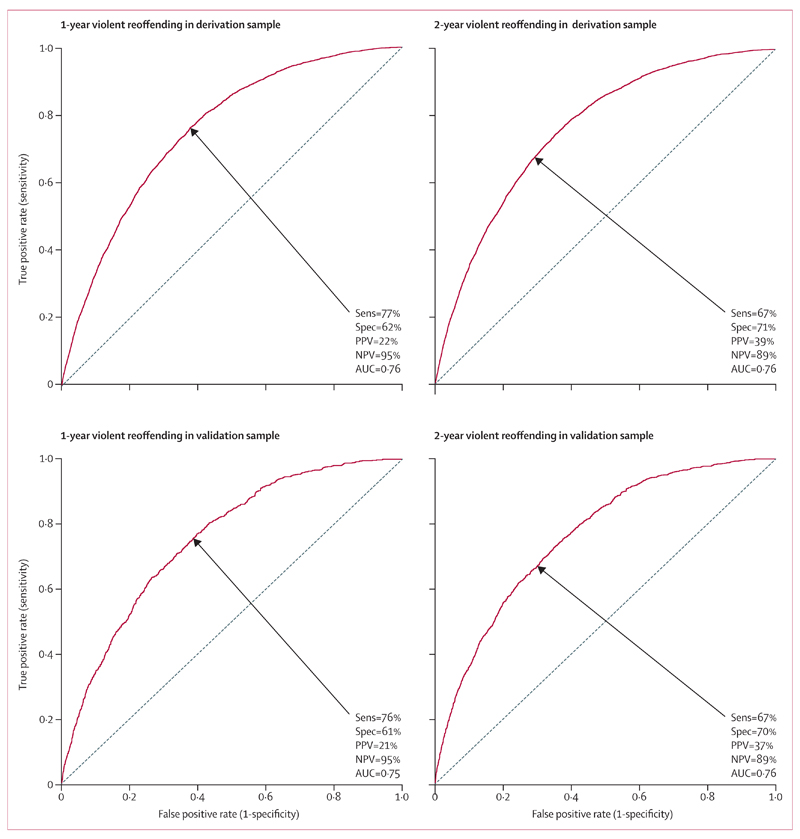
Methods: We did a cohort study of a population of released prisoners in Sweden. Through linkage of population-based registers, we developed predictive models for violent reoffending for the cohort. First, we developed a derivation model to determine the strength of prespecified, routinely obtained criminal history, sociodemographic, and clinical risk factors using multivariable Cox proportional hazard regression, and then tested them in an external validation. We measured discrimination and calibration for prediction of our primary outcome of violent reoffending at 1 and 2 years using cutoffs of 10% for 1-year risk and 20% for 2-year risk.
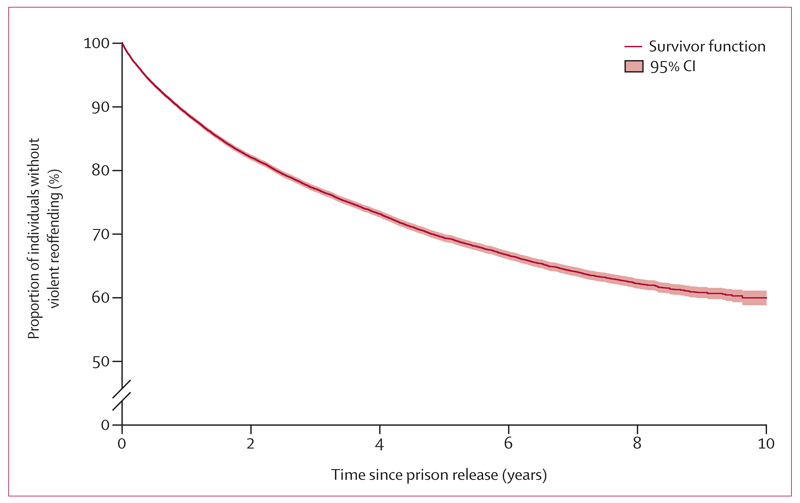
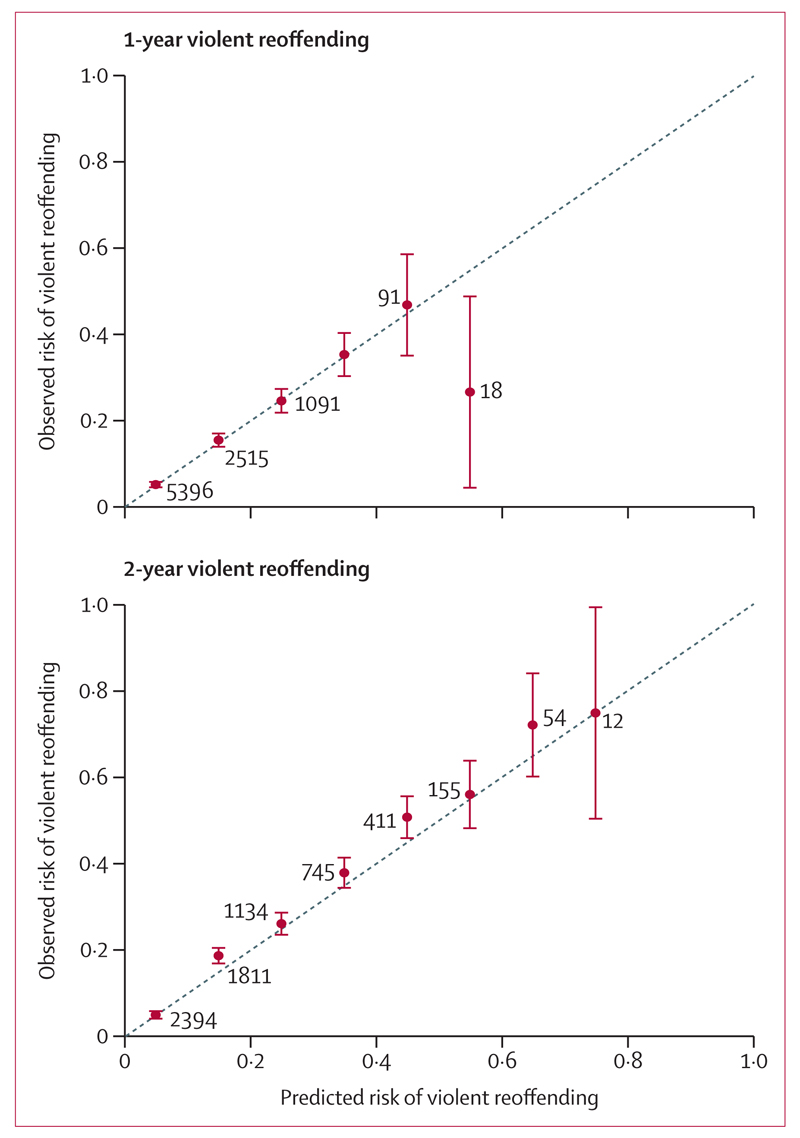
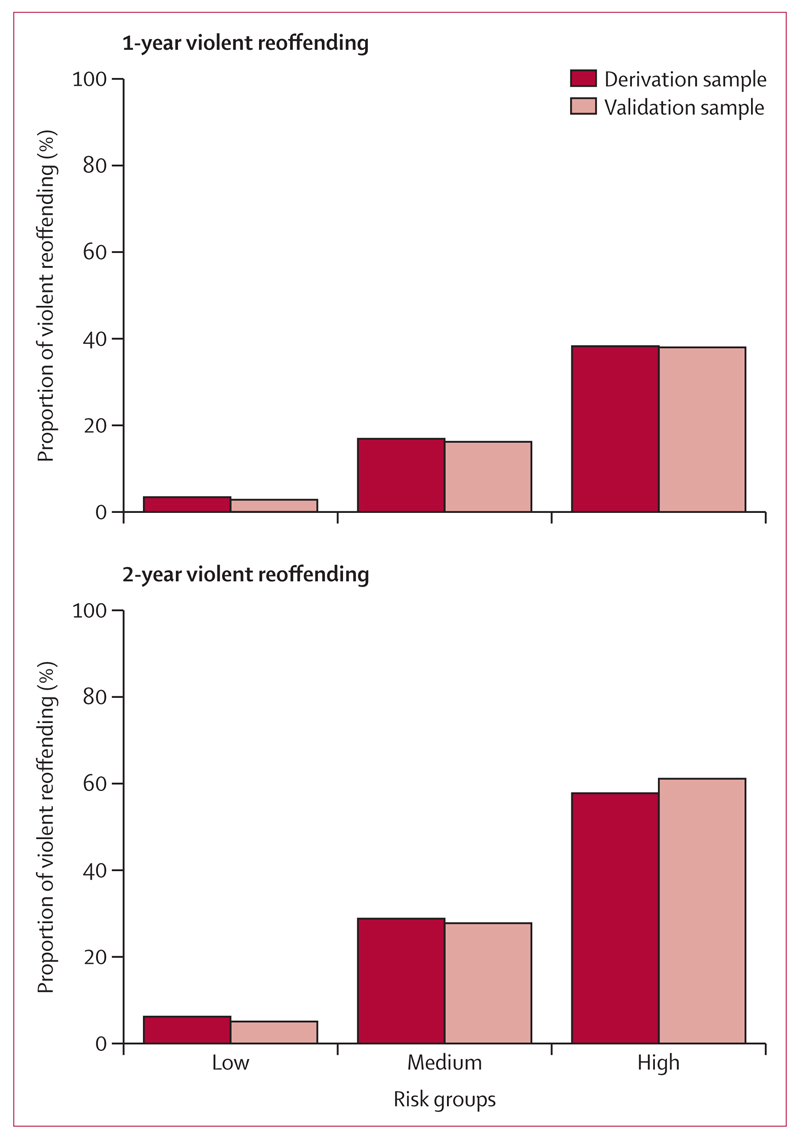
Findings: We identified a cohort of 47 326 prisoners released in Sweden between 2001 and 2009, with 11 263 incidents of violent reoffending during this period. We developed a 14-item derivation model to predict violent reoffending and tested it in an external validation (assigning 37 100 individuals to the derivation sample and 10 226 to the validation sample). The model showed good measures of discrimination (Harrell's c-index 0·74) and calibration. For risk of violent reoffending at 1 year, sensitivity was 76% (95% CI 73-79) and specificity was 61% (95% CI 60-62). Positive and negative predictive values were 21% (95% CI 19-22) and 95% (95% CI 94-96), respectively. At 2 years, sensitivity was 67% (95% CI 64-69) and specificity was 70% (95% CI 69-72). Positive and negative predictive values were 37% (95% CI 35-39) and 89% (95% CI 88-90), respectively. Of individuals with a predicted risk of violent reoffending of 50% or more, 88% had drug and alcohol use disorders. We used the model to generate a simple, web-based, risk calculator (OxRec) that is free to use.
Interpretation: We have developed a prediction model in a Swedish prison population that can assist with decision making on release by identifying those who are at low risk of future violent offending, and those at high risk of violent reoffending who might benefit from drug and alcohol treatment. Further assessments in other populations and countries are needed.
Funding: Wellcome Trust, the Swedish Research Council, and the Swedish Research Council for Health, Working Life and Welfare.
Copyright © 2016 Fazel et al. Open Access article distributed under the terms of CC BY. Published by Elsevier Ltd.. All rights reserved.
Conflict of interest statement
NL is the national scientific adviser for Research and Evaluation for the Swedish Prison and Probation Service. All other authors declare no competing interests.
Figures
Comment in
-
Zeroing in on violent recidivism among released prisoners.Lancet Psychiatry. 2016 Jun;3(6):493-4. doi: 10.1016/S2215-0366(16)30086-4. Lancet Psychiatry. 2016. PMID: 27262037 No abstract available.
-
OxRec model for assessing risk of recidivism: ethics.Lancet Psychiatry. 2016 Sep;3(9):808-9. doi: 10.1016/S2215-0366(16)30175-4. Lancet Psychiatry. 2016. PMID: 27568268 Free PMC article. No abstract available.
References
-
- Ministry of Justice. [accessed June 12, 2015];Compendium of reoffending statistics and analysis 2012. https://www.gov.uk/government/publications/compendium-of-reoffending-sta...
-
- Schmitt J, Warner K. Ex-offenders and the labor market. Washington DC: Center for Economic and Policy Research; 2010.
-
- Petersilia J. Beyond the prison bubble. Fed Probation. 2011;75:2.
MeSH terms
Grants and funding
LinkOut - more resources
Full Text Sources
Other Literature Sources
