Review
doi: 10.2174/0929867323666160418114826.
Considerations in the Development of Reversibly Binding PET Radioligands for Brain Imaging
Affiliations
- PMID: 27087244
- PMCID: PMC5579844
- DOI: 10.2174/0929867323666160418114826
Item in Clipboard
Review
Considerations in the Development of Reversibly Binding PET Radioligands for Brain Imaging
Curr Med Chem.
2016.
Abstract
The development of reversibly binding radioligands for imaging brain proteins in vivo, such as enzymes, neurotransmitter transporters, receptors and ion channels, with positron emission tomography (PET) is keenly sought for biomedical studies of neuropsychiatric disorders and for drug discovery and development, but is recognized as being highly challenging at the medicinal chemistry level. This article aims to compile and discuss the main considerations to be taken into account by chemists embarking on programs of radioligand development for PET imaging of brain protein targets.
Conflict of interest statement
The author confirms that this article has no conflict of interest.
Figures
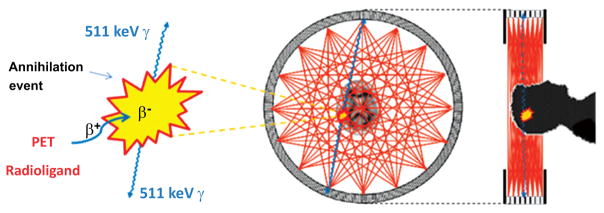
Physical basis of PET brain imaging. A PET radioligand that has entered brain after intravenous administration emits a positron. This positron loses kinetic energy over a short distance of a few millimeters before combining with an electron to form positronium, which then annihilates to produce two 511 keV γ-rays that are emitted in almost exactly opposite directions. The PET camera has several adjacent rings of sensitive γ-ray detectors that record all such coincident arrivals of paired γ-rays. Lines between pairs of simultaneously activated detectors cover the positions of positron annihilation events from which PET scans can be reconstructed to measure the distribution of radioactivity in three dimensions. Rapid sequences of scans are recorded to provide regional kinetic information over a few half-lives of the radioligand label (i.e.; 11C or 18F). The detection of coincident γ-ray arrivals amounts to ‘electronic collimation’, and dispenses with the need for ‘physical collimation’ which would otherwise diminish detection sensitivity as in SPECT.
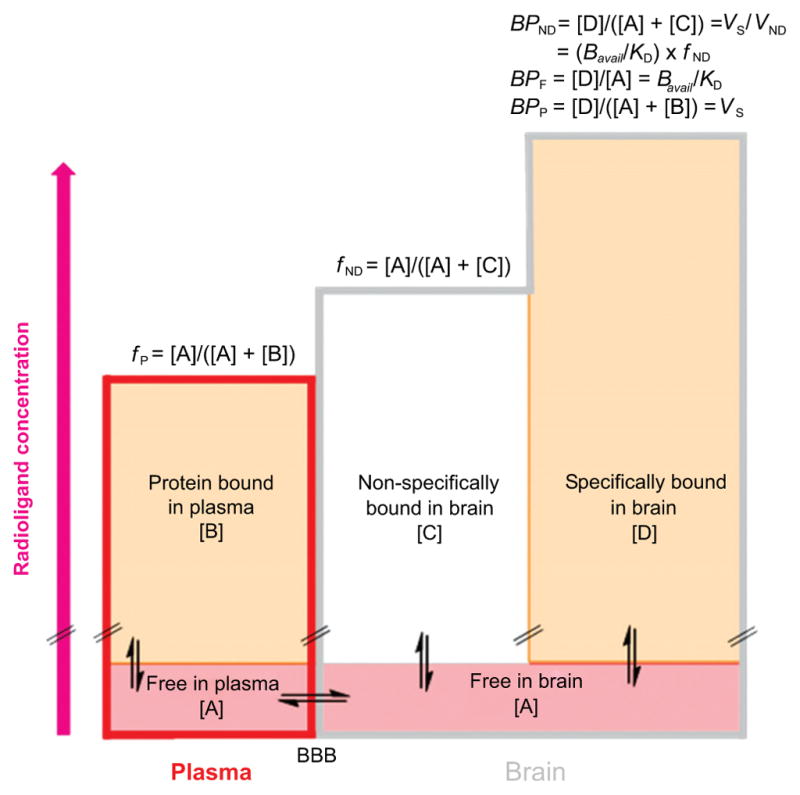
Graphical representation of the distribution of a PET radioligand between plasma and 2 tissues in brain at equilibrium. The height of each rectangle represents radioligand concentration. The free concentration of radioligand in plasma and brain is assumed to be the same and equal to [A], because of assumed free unhindered bidirectional passive diffusion across the BBB. The plasma free fraction of radioligand, fP, is the ratio of free radioligand concentration [A] to total radioligand concentration in plasma i.e.; free [A] plus protein bound [B]. Similarly, the brain free fraction of a radioligand, fND, is the ratio of free radioligand concentration [A] to the sum of free [A] and nonspecifically bound [C] radioligand concentrations in brain. [D] Represents the specifically bound concentration of radioligand in brain. Some mathematical relationships of binding potentials to other parameters are shown above the right column.
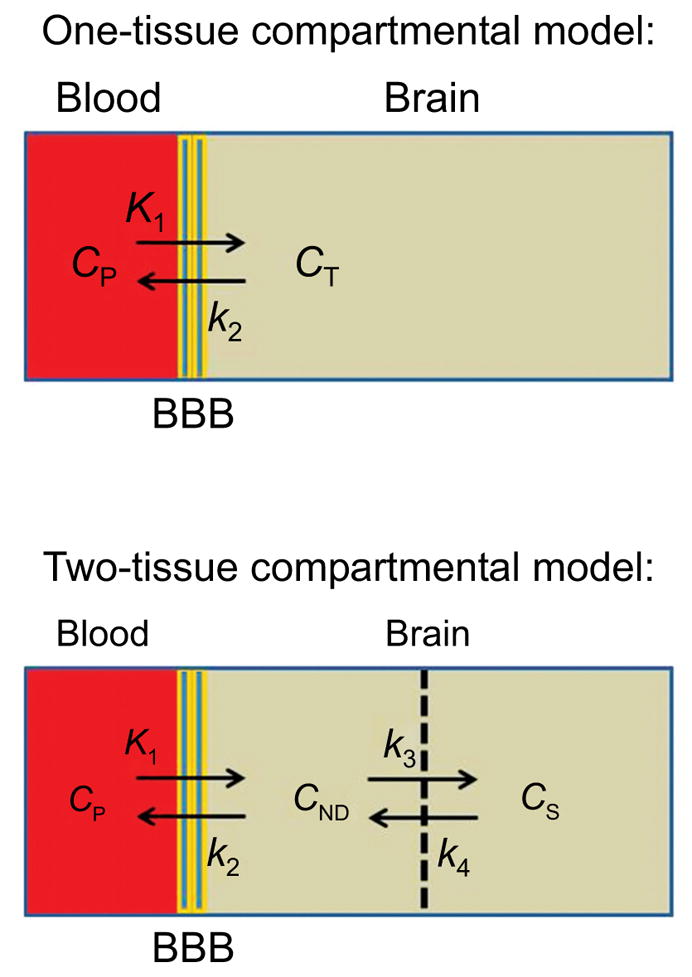
One and two tissue compartmental models that are frequently used as a basis for quantification of PET radioligand behavior: (CP, plasma radioligand concentration; CT, brain tissue radioligand concentration; CND, nonspecific plus free radioligand concentration; CS, specific radioligand concentration).
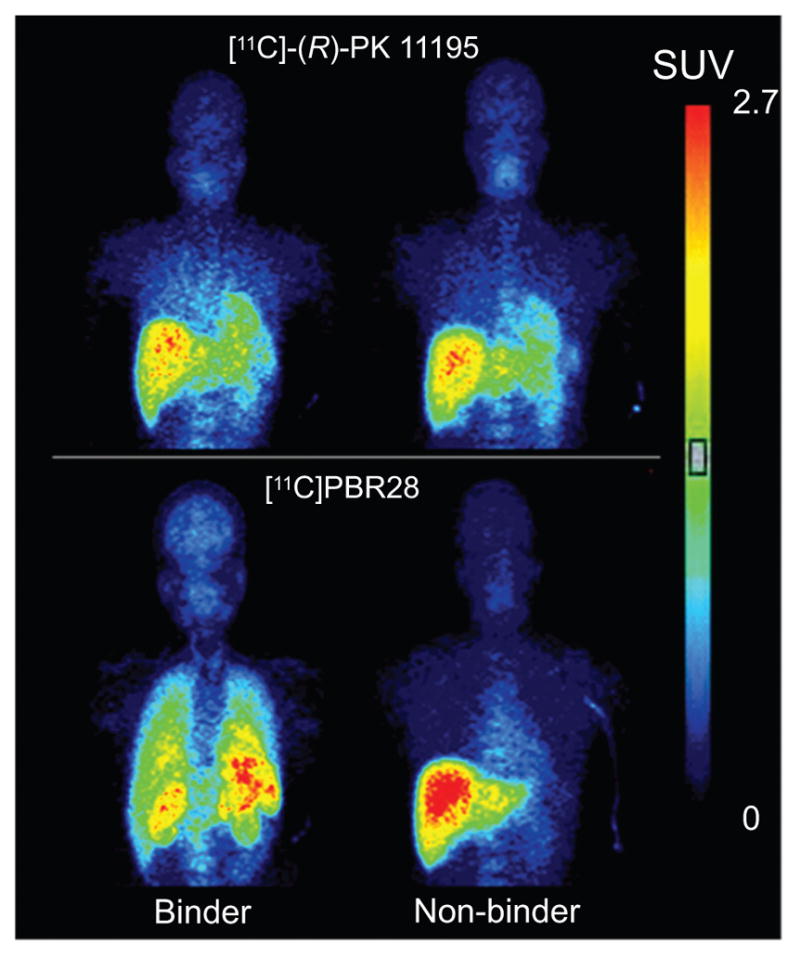
Imaging of TSPO in brain and body organs under baseline conditions in PBR28 binders (HABs) and non-binders (LABs) with the prototypical radioligand [11C](R)-PK11195 and with the later generation radioligand [11C] PBR28. From Kreisl et al. [43], with permission. Unlike [11C](R)-PK11195, [11C]PBR28 shows no TSPO-specific binding in brain or periphery of non-binder.
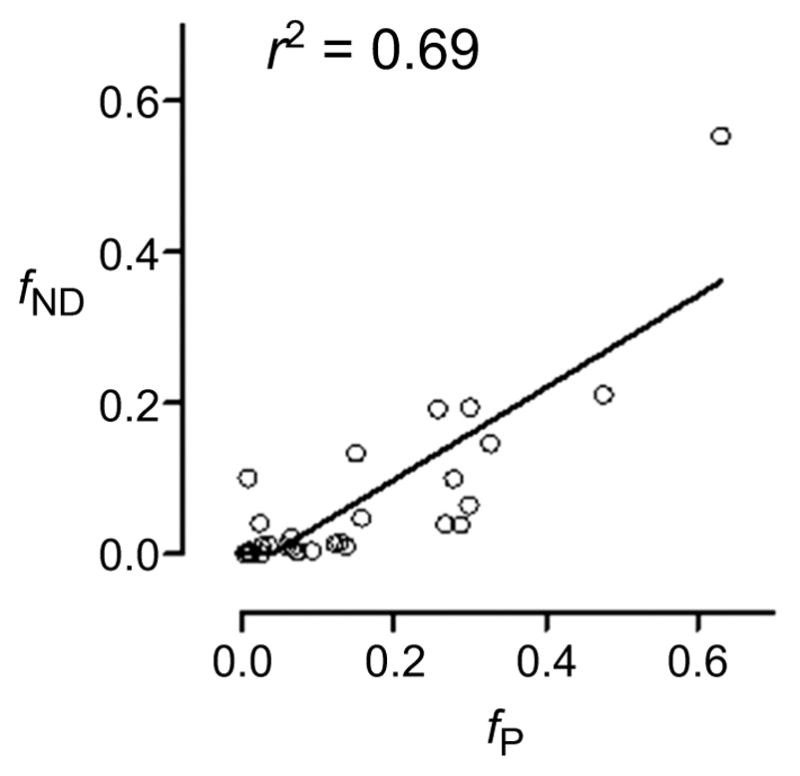
Plot of fND
versus fP for 28 ligands in pig. Data are sourced from from Guo et al. [99]. Although the plot shows a quite strong linear correlation, slope is far from unity, and differences between parameters can be large for many ligands.
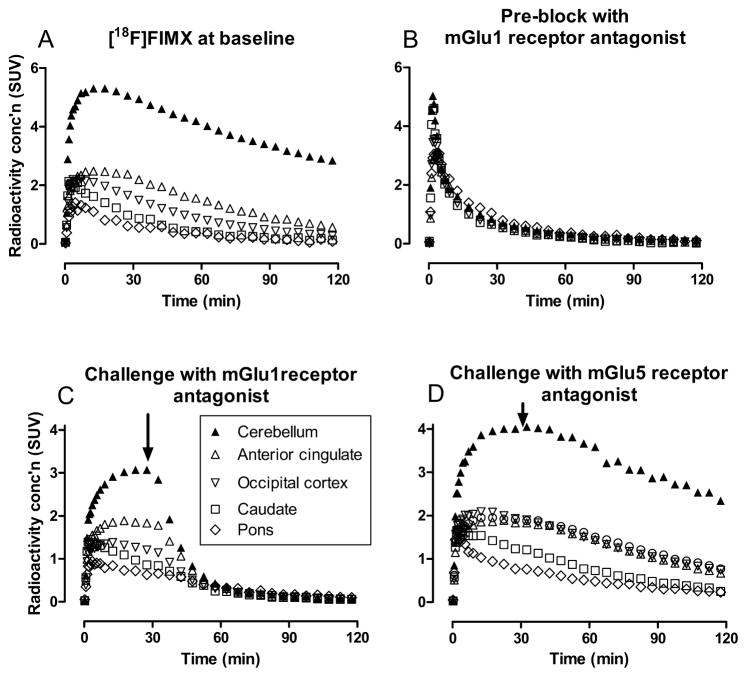
PET Time-activity curves in monkey brain regions after administration of [18F]FIMX. (A) At baseline; (B) after pre-block with a selective mGlu1 receptor antagonist; (C) at baseline with challenge from an mGlu1 receptor antagonist at 27.5 min; and (D) at baseline with challenge from an mGlu5 receptor antagonist at 27.5 min. (Adapted from [107]). The experiments show that [18F]FIMX has high specific binding to mGlu1 receptors at baseline.

Illustration of the spectrum of ligand efficacy with ligands for benzodiazepine receptors.
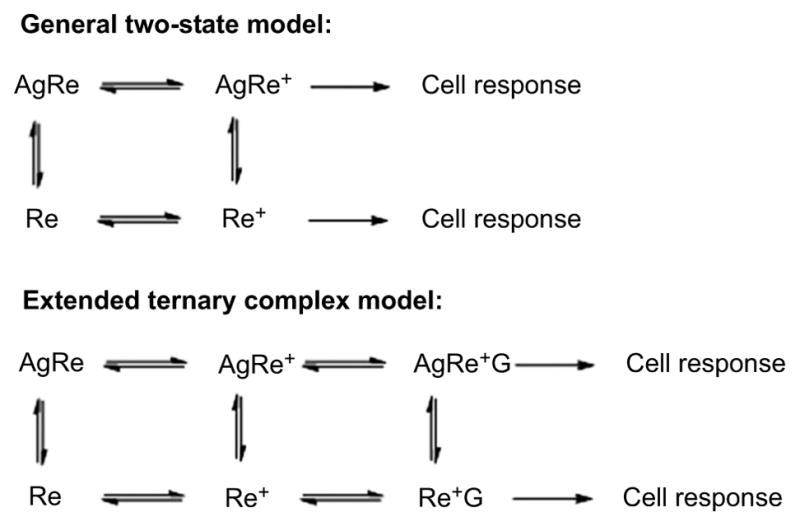
The general two-state and extended ternary complex models of GPCR function induced by an agonist. Ag is agonist, Re is receptor, Re* is receptor in activated state, and G is a G-protein.
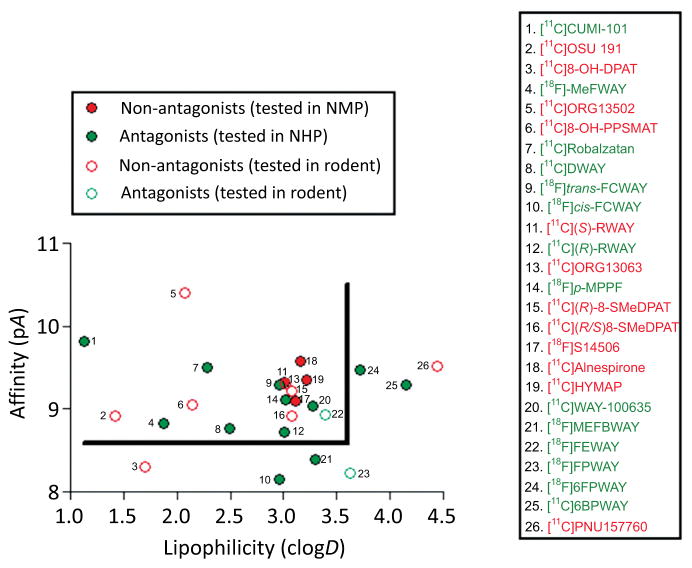
Plot of affinity (pA) versus computed lipophilicity (clogD) for antagonist and non-antagonist radioligands for brain 5-HT1A receptors. All 26 radioligands have been tested in monkey (solid symbols) or in rat (open symbols). Antagonists shown by green solid symbols and within the top left-hand sector bounded by the line gave strong performance in monkey, whereas agonist radioligands (solid red symbols) with similar affinity and lipophilicity give small or negligible signals. Similarly agonists perform poorly in rat (open red circles). Radioligands 1 (originally classed as an agonist), 4, 7, 8, 9, 14 and 20 have been used in human studies. The plot indicates that high affinity, moderate lipophilicity and antagonist pharmacology are desirable properties for obtaining sensitive radioligands for imaging brain 5-HT1A receptors in animal or human brain. clogD was calculated with Pallas software. Other data are from reference [120], and references therein, except for radioligands 1 [125], 4 [126], 11 [127], and 12 [127].
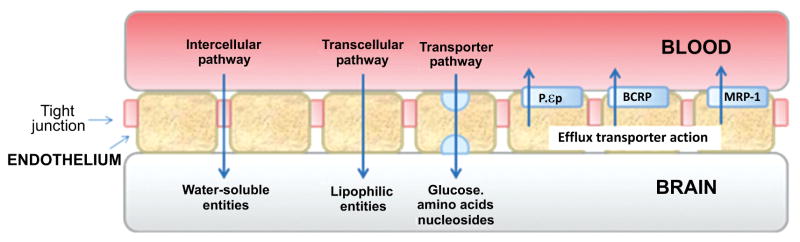
Representation of the structure of the BBB showing pathways into brain and major efflux transporters.
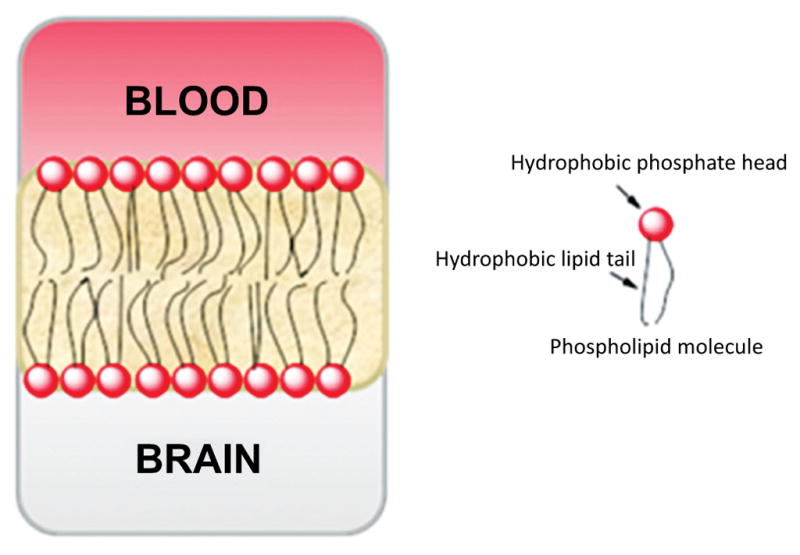
Representation of the structure of the phospholipid bilayer at the BBB.
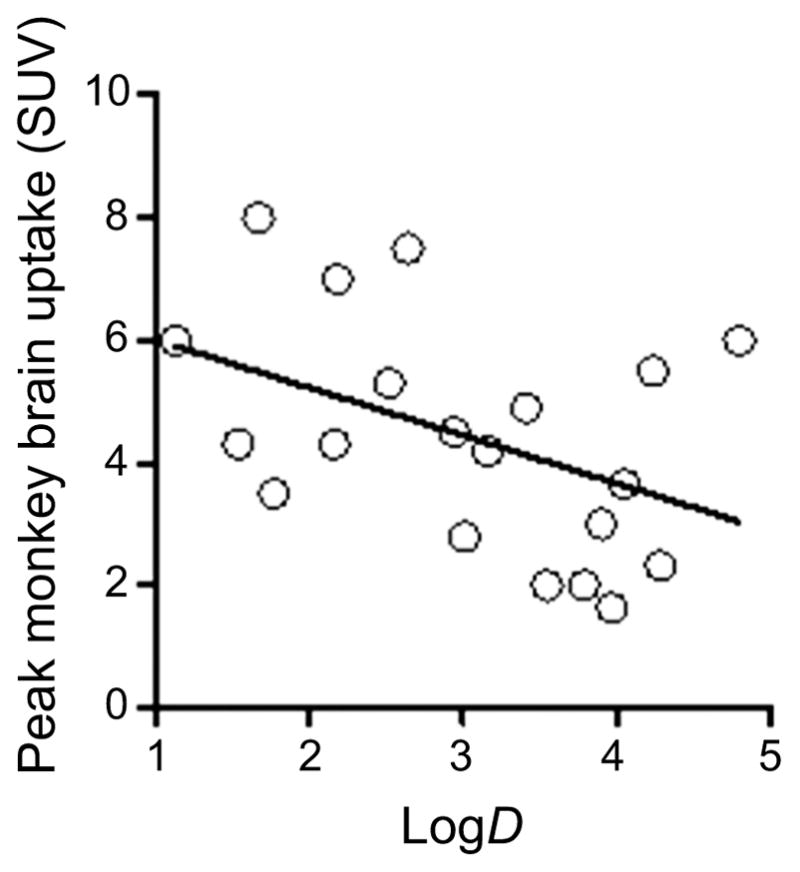
Plot of peak radioactivity concentration in rhesus monkey brain (SUV) versus radioligand lipophilicity (measured logD) for the 20 radioligands listed in Table 4. Line represents linear fit (r2 = 0.19).
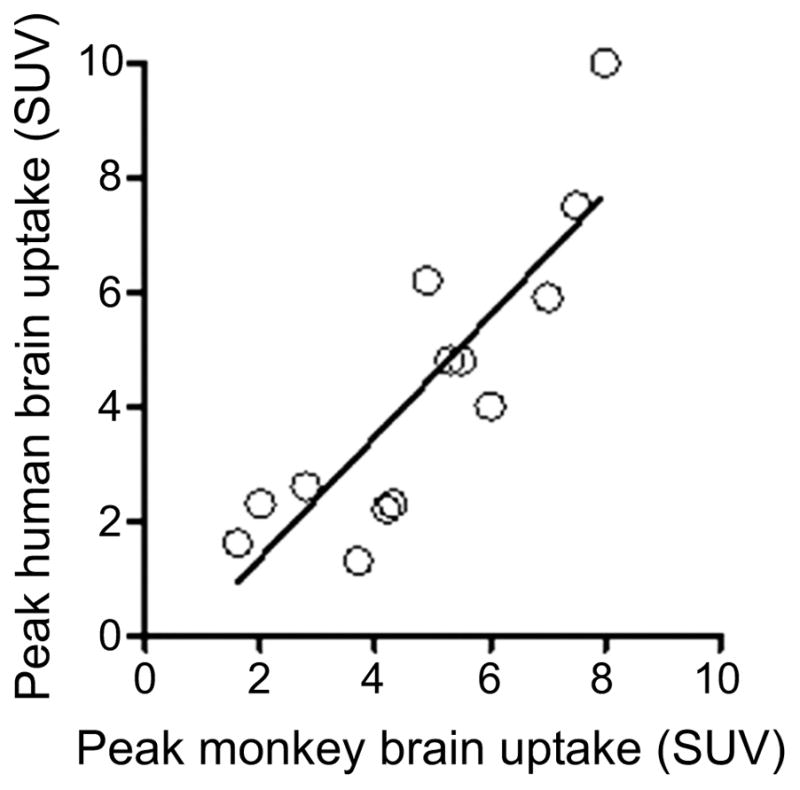
Relationship of peak human brain uptake to peak monkey brain uptake (SUV) for 14 radioligands in Table 4. Line represents linear fit (r2 = 0.74).
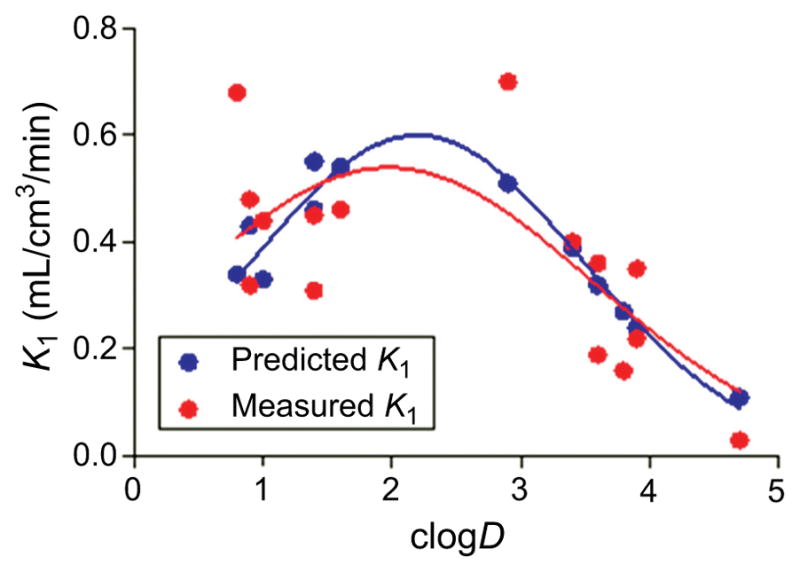
Plots of predicted and measured K1
versus lipophilicity (clogD) for 15 ligands in pig. The blue and red lines are Gaussian fits to the predicted and measured data, respectively. (Source data: Guo et al. [99]).
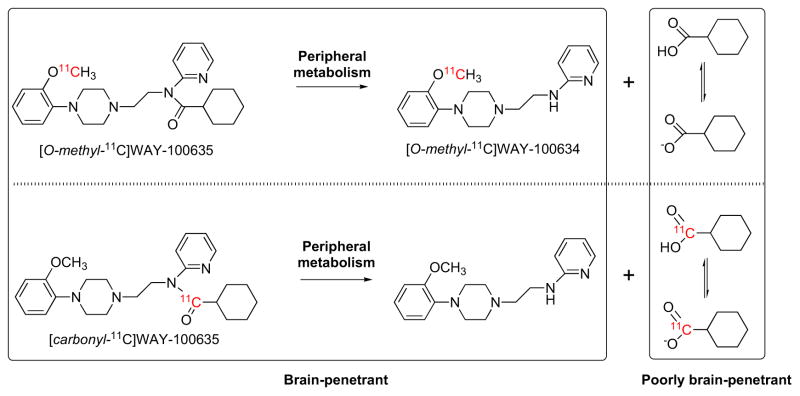
Metabolism of [O-methyl-11C]WAY-100635 and [carbonyl-11C]WAY-100635 in primates. Labeling in the carbonyl position avoids generating the brain-penetrant radioactive amine [O-methyl-11C]WAY-100634.
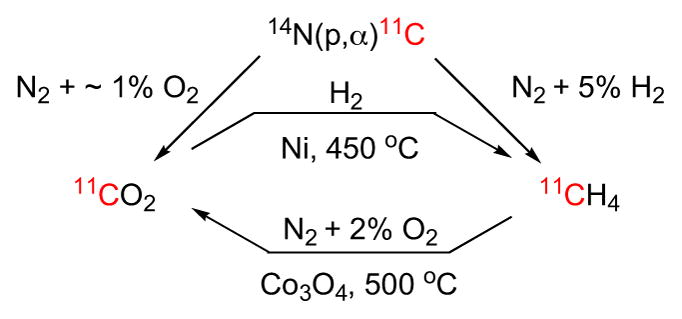
Cyclotron methods for preparing [11C]carbon dioxide or [11C]methane, and methods for their on-line intercon-versions.
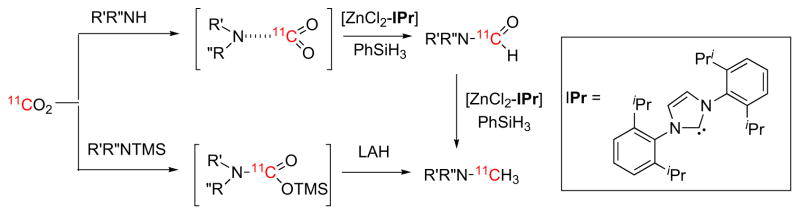
Preparation of [N-methyl-11C]amines via 11C-carbonylation of amines.
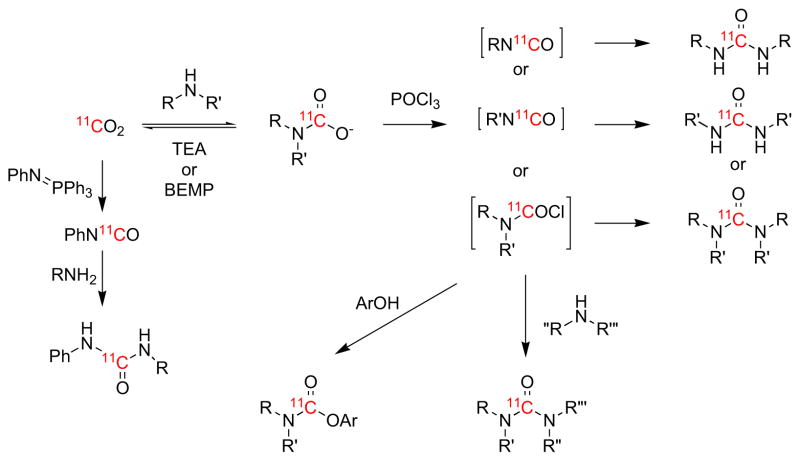
Utility of [11C]carbon dioxide for labeling ureas and carbamates.
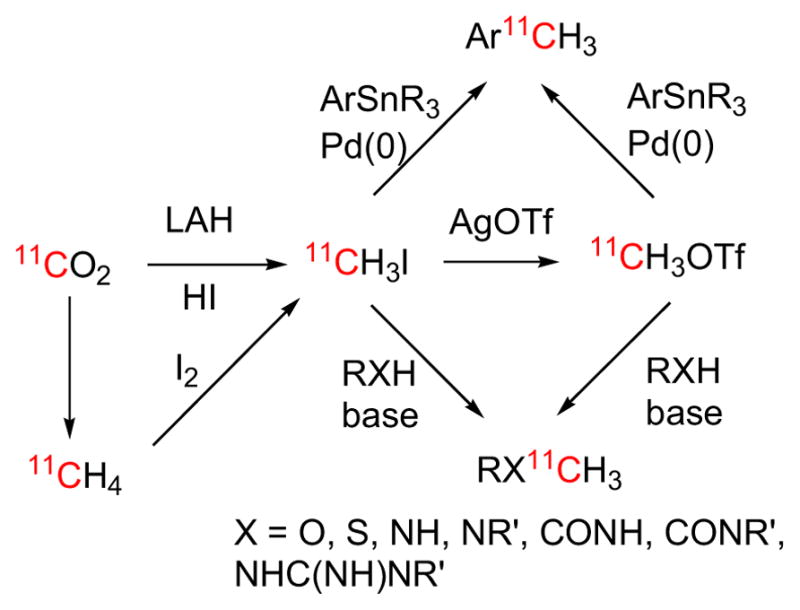
Preparation of [11C]methyl iodide and [11C]methyl triflate and utility for radiolabeling various structural motifs.
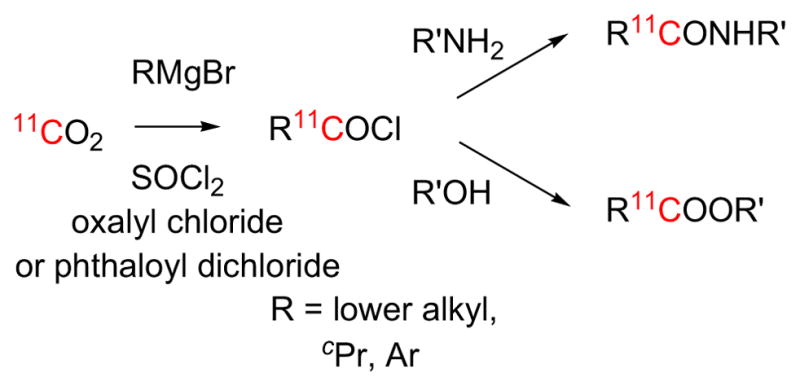
Preparation and utility of [11C]acid chlorides.
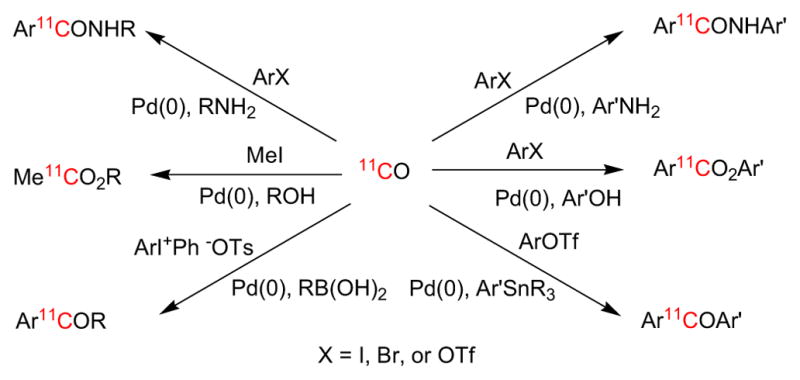
Synthesis of 11C-labeled ketones, esters, and amides from [11C]carbon monoxide.

Preparation of [11C]hydrogen cyanide and application to prepare [11C]aryl nitriles.
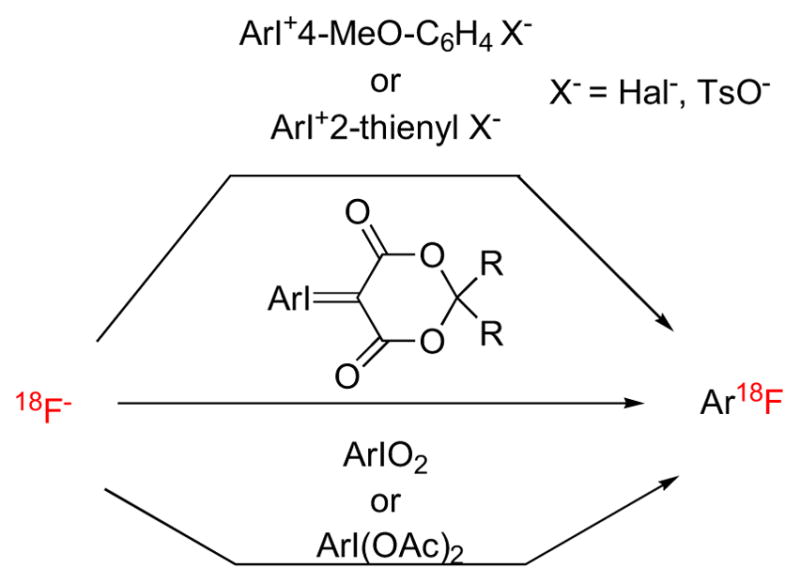
Preparation of [18F]aryl fluorides from hypervalent iodine substrates.
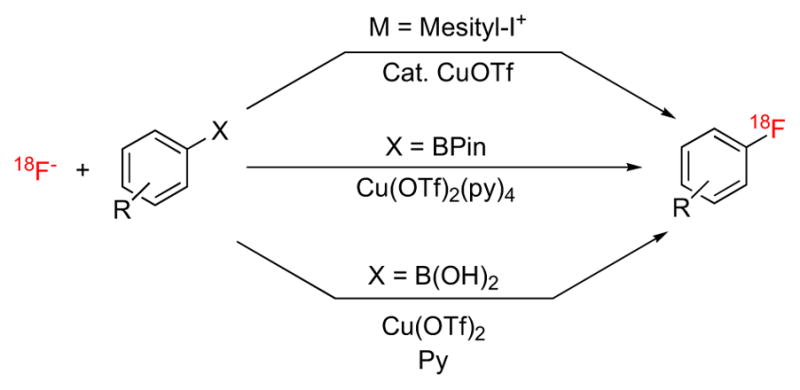
Cu-mediated routes to [18F]fluoroarenes from [18F]fluoride ion.
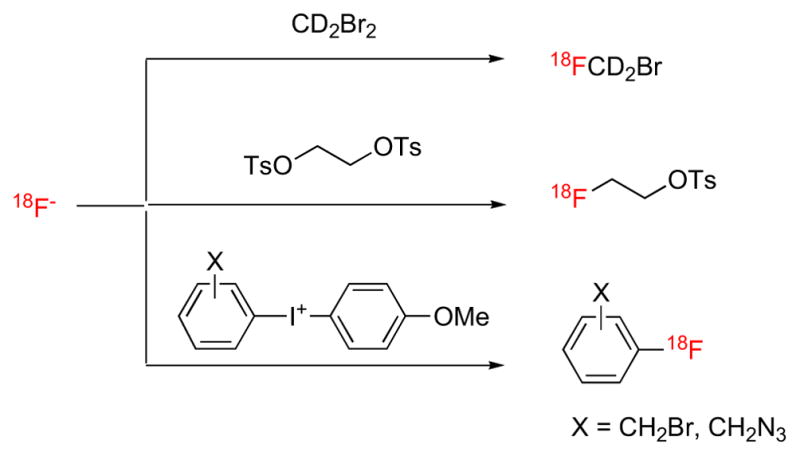
Examples of conversions of [18F]fluoride ion into secondary labeling agents.

Labeling of alkyl and aryl trifluoromethyl groups with [18F]fluoride ion.
References
-
- Imming P, Sinning C, Meyer A. Drugs, their targets and the nature and number of drug targets. Nature Rev. 2007;5:821–834. - PubMed
-
- Heiss WD, Herholz K. Brain receptor imaging. J Nucl Med. 2006;47:302–312. - PubMed
-
- Politis M, Piccini P. Positron emission tomography imaging in neurological disorders. J Neurol. 2012;259:1769–1780. - PubMed
-
- Savitz JB, Drevets WC. Neuroreceptor imaging in depression. Neurobiol Dis. 2013;52:49–65. - PubMed
-
- Hargreaves RJ. The role of molecular imaging in drug discovery and development. Clin Pharmacol Ther. 2008;83:349–353. - PubMed
Publication types
MeSH terms
Substances
Grants and funding
LinkOut - more resources
Full Text Sources
Other Literature Sources