

Sub-cellular modeling of platelet transport in blood flow through microchannels with constriction
- PMID: 27087267
- PMCID: PMC5488286
- DOI: 10.1039/c6sm00154h
Sub-cellular modeling of platelet transport in blood flow through microchannels with constriction
Abstract
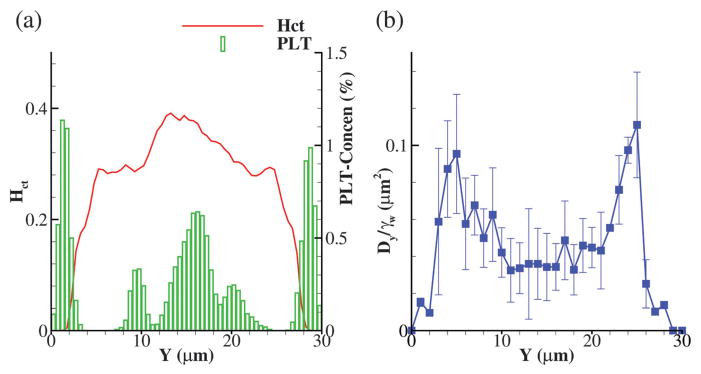
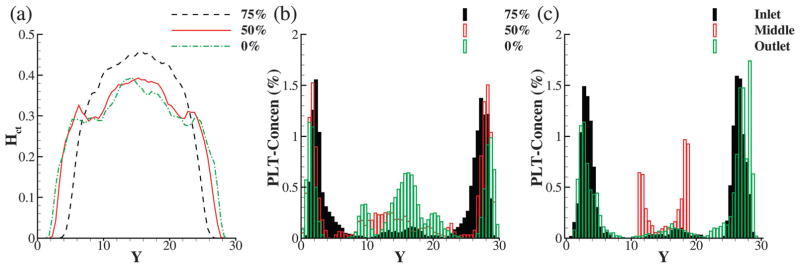
Platelet transport through arterial constrictions is one of the controlling processes influencing their adhesive functions and the formation of thrombi. We perform high-fidelity mesoscopic simulations of blood flow in microchannels with constriction, resembling arterial stenoses. The wall shear rates inside the constrictions reach levels as high as ≈8000 s(-1), similar to those encountered in moderate atherosclerotic plaques. Both red blood cells and platelets are resolved at sub-cellular resolution using the Dissipative Particle Dynamics (DPD) method. We perform a systematic study on the red blood cell and platelet transport by considering different levels of constriction, blood hematocrit and flow rates. We find that higher levels of constriction and wall shear rates lead to significantly enhanced margination of platelets, which may explain the experimental observations of enhanced post-stenosis platelet aggregation. We also observe similar margination effects for stiff particles of spherical shapes such as leukocytes. To our knowledge, such numerical simulations of dense blood through complex geometries have not been performed before, and our quantitative findings could shed new light on the associated physiological processes such as ATP release, plasma skimming, and thrombus formation.
Figures


Similar articles
-
Quantifying Platelet Margination in Diabetic Blood Flow.Biophys J. 2018 Oct 2;115(7):1371-1382. doi: 10.1016/j.bpj.2018.08.031. Epub 2018 Aug 30. Biophys J. 2018. PMID: 30224049 Free PMC article.
-
Novel Stenotic Microchannels to Study Thrombus Formation in Shear Gradients: Influence of Shear Forces and Human Platelet-Related Factors.Int J Mol Sci. 2019 Jun 18;20(12):2967. doi: 10.3390/ijms20122967. Int J Mol Sci. 2019. PMID: 31216638 Free PMC article.
-
Quantifying Shear-induced Margination and Adhesion of Platelets in Microvascular Blood Flow.J Mol Biol. 2023 Jan 15;435(1):167824. doi: 10.1016/j.jmb.2022.167824. Epub 2022 Sep 13. J Mol Biol. 2023. PMID: 36108775
-
Thrombus Structural Composition in Cardiovascular Disease.Arterioscler Thromb Vasc Biol. 2021 Sep;41(9):2370-2383. doi: 10.1161/ATVBAHA.120.315754. Epub 2021 Jul 15. Arterioscler Thromb Vasc Biol. 2021. PMID: 34261330 Free PMC article. Review.
-
Virchow's triad revisited: abnormal flow.Pathophysiol Haemost Thromb. 2003 Sep-2004 Dec;33(5-6):455-7. doi: 10.1159/000083845. Pathophysiol Haemost Thromb. 2003. PMID: 15692260 Review.
Cited by
-
Computational Biomechanics of Human Red Blood Cells in Hematological Disorders.J Biomech Eng. 2017 Feb 1;139(2):0210081-02100813. doi: 10.1115/1.4035120. J Biomech Eng. 2017. PMID: 27814430 Free PMC article. Review.
-
Identifying the start of a platelet aggregate by the shear rate and the cell-depleted layer.J R Soc Interface. 2019 Oct 31;16(159):20190148. doi: 10.1098/rsif.2019.0148. Epub 2019 Oct 2. J R Soc Interface. 2019. PMID: 31575344 Free PMC article.
-
Integrating blood cell mechanics, platelet adhesive dynamics and coagulation cascade for modelling thrombus formation in normal and diabetic blood.J R Soc Interface. 2021 Feb;18(175):20200834. doi: 10.1098/rsif.2020.0834. Epub 2021 Feb 3. J R Soc Interface. 2021. PMID: 33530862 Free PMC article.
-
Multiphysics and multiscale modeling of microthrombosis in COVID-19.PLoS Comput Biol. 2022 Mar 7;18(3):e1009892. doi: 10.1371/journal.pcbi.1009892. eCollection 2022 Mar. PLoS Comput Biol. 2022. PMID: 35255089 Free PMC article.
-
Quantifying Platelet Margination in Diabetic Blood Flow.Biophys J. 2018 Oct 2;115(7):1371-1382. doi: 10.1016/j.bpj.2018.08.031. Epub 2018 Aug 30. Biophys J. 2018. PMID: 30224049 Free PMC article.
References
-
- Nesbitt WS, Westein E, Tovar-Lopez FJ, Tolouei E, Mitchell A, Fu J, Carberry J, Fouras A, Jackson SP. Nat Med. 2009;15:665–673. - PubMed
-
- Jackson SP. Blood. 2007;109:5087–5095. - PubMed
-
- Burke AP, Kolodgie FD, Farb A, Weber DK, Malcom GT, Smialek J, Virmani R. Circulation. 2001;103:934–940. - PubMed
-
- Woldhuis B, Tangelder G, Slaaf DW, Reneman RS. Am J Physiol: Heart Circ Physiol. 1992;262:H1217–H1223. - PubMed
Publication types
MeSH terms
Grants and funding
LinkOut - more resources
Full Text Sources
Other Literature Sources
Medical