. 2016 May 5;98(5):857-868.
doi: 10.1016/j.ajhg.2016.02.025. Epub 2016 Apr 14.

A Method to Exploit the Structure of Genetic Ancestry Space to Enhance Case-Control Studies

Collaborators, Affiliations

A Method to Exploit the Structure of Genetic Ancestry Space to Enhance Case-Control Studies

Corneliu A Bodea et al. Am J Hum Genet. .

Abstract

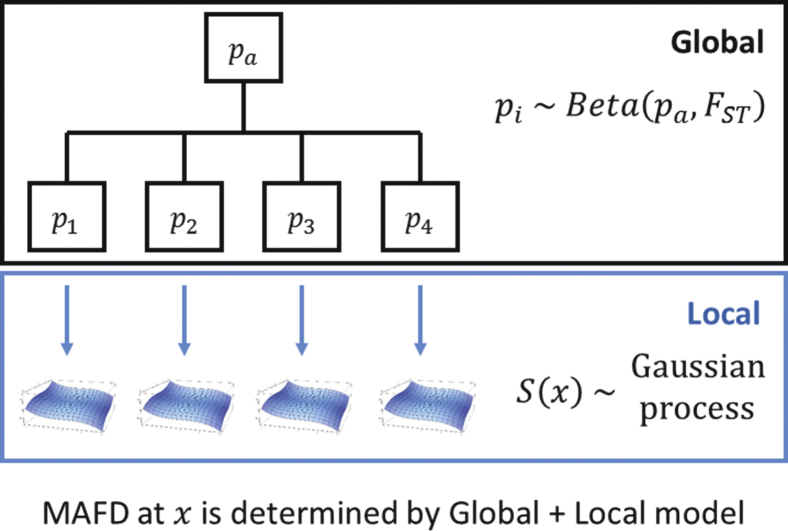
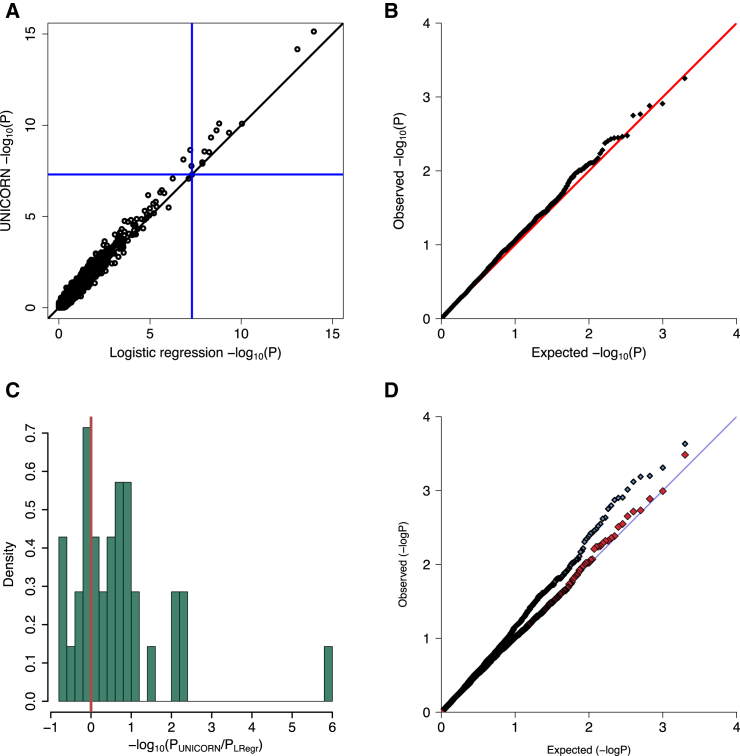
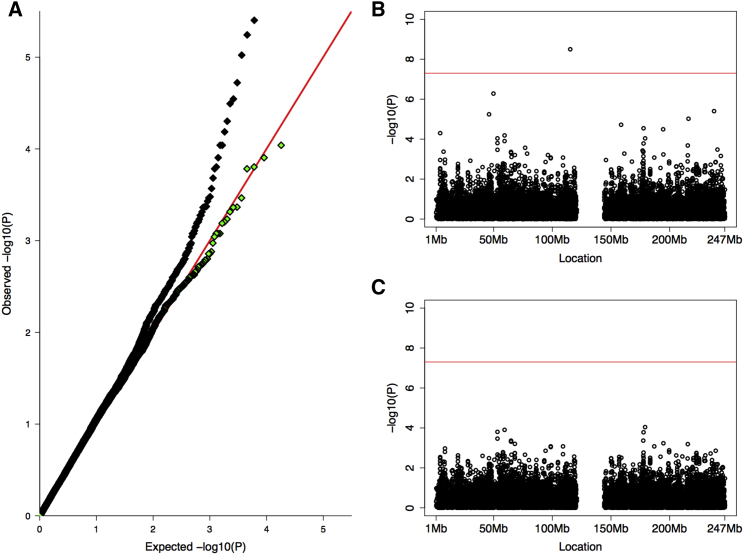
One goal of human genetics is to understand the genetic basis of disease, a challenge for diseases of complex inheritance because risk alleles are few relative to the vast set of benign variants. Risk variants are often sought by association studies in which allele frequencies in case subjects are contrasted with those from population-based samples used as control subjects. In an ideal world we would know population-level allele frequencies, releasing researchers to focus on case subjects. We argue this ideal is possible, at least theoretically, and we outline a path to achieving it in reality. If such a resource were to exist, it would yield ample savings and would facilitate the effective use of data repositories by removing administrative and technical barriers. We call this concept the Universal Control Repository Network (UNICORN), a means to perform association analyses without necessitating direct access to individual-level control data. Our approach to UNICORN uses existing genetic resources and various statistical tools to analyze these data, including hierarchical clustering with spectral analysis of ancestry; and empirical Bayesian analysis along with Gaussian spatial processes to estimate ancestry-specific allele frequencies. We demonstrate our approach using tens of thousands of control subjects from studies of Crohn disease, showing how it controls false positives, provides power similar to that achieved when all control data are directly accessible, and enhances power when control data are limiting or even imperfectly matched ancestrally. These results highlight how UNICORN can enable reliable, powerful, and convenient genetic association analyses without access to the individual-level data.


Figures

Figure 1
Figure 1
Overview of the UNICORN Model The UNICORN pipeline starts with a public base set of control subjects and constructs the corresponding base control ancestry space. All subsequent case and control subjects can be projected independently via GemTools onto this space. This approach ensures that, having only knowledge of the base set, new individuals can be compared to existing ancestries. An extended set of control subjects is then projected onto the base control ancestry space, which is used to estimate the minor allele frequency distribution (MAFD) over the ancestry space. To query the repository, researchers project their case subjects onto the base control ancestry space and submit the resulting coordinates to the UNICORN server. Users then receive control allele frequencies as well as the degree of uncertainty associated with these estimates for all relevant locations, based on the pre-computed MAFD. Users can then proceed with an association test. Users need to submit only ancestry coordinates and the system returns only frequency inferences for the corresponding locations (red arrows). No other information is exchanged.
Figure 2
Figure 2
Overview of the Inference Levels The Global step operates on a cluster-wide resolution, providing estimates for entire clusters based on a beta-binomial model of allele frequencies. The Local step operates within clusters, providing localized estimates across the ancestry space spanned by the individuals in each cluster. This step models allele frequencies as spatial processes operating within clusters. The Global and Local inference modules complement each other, the former picking up larger fluctuations in allele frequencies, and the latter generating a fine map that would otherwise have been hidden by the strong signal at the Global level.
Figure 3
Figure 3
Clines Detected by UNICORN in the POPRES Data for Two SNPs under Strong Selection Intensity of color displays allele frequency estimates that vary smoothly across the map. (A) Cline of a SNP within the LCT region (lactase persistence). (B) Cline of a SNP within the OCA2 region (hair, skin, and eye color).
Figure 4
Figure 4
Importance of the Choice of Base Sample for Ancestry Maps When projecting new samples onto an existing ancestry map, it is crucial that the base sample spans the full range of ancestries present in the new samples. If the projected samples contain unrepresented ancestries, they will still be mapped onto the ancestry range of the base set, thus distorting their true background and leading to strongly heterogenous clusters that do not accurately reflect the allele frequencies of the new samples. (A) Base = HGDP (black), projected = POPRES (turquoise). In this scenario we get poor resolution of ancestries in the POPRES sample. This set projects as a clump, because it looks very homogeneous relative to the more diverse HGDP base set. (B) Base = POPRES, projected = HGDP. In this scenario, the HGDP ancestries not present in the POPRES base set are still projected within the POPRES ancestry range.
Figure 5
Figure 5
IBD Analysis via UNICORN versus Logistic Regression Controlling for Ancestry (A) Comparison between UNICORN and LRegr on the full 7-study CD dataset. All significant SNPs detected by LRegr were also significant in UNICORN, and each of these SNPs was significant in the validation study as well. (B) UNICORN null distribution obtained by permuting affection status in the full case-control dataset. The resulting distribution of p values produced by UNICORN is well calibrated, indicating a good control of false positives. (C and D) UNICORN applied only to case subjects from the Belgian study using all control subjects excluding that study. (C) Difference in p value magnitude between UNICORN and LRegr applied only to Belgian case-controls. Results are shown only for SNPs that were found significant in the validation study. All SNPs showing a substantial difference favored UNICORN, particularly the SNP that had the highest signal in Jostins et al. (D) P-P plot for UNICORN (blue) compared to the null distribution with permuted phenotype labels (red). The blue P-P plot shows some signal was detected and the red P-P plot shows that UNICORN yields an appropriate null distribution when there is no signal present.
Figure 6
Figure 6
Detection and Removal of False Positives via Nonparametric Smoothing We created a UNICORN study by using individuals selected for European ancestry from the HGDP dataset and comparing them to the CD controls. Any signals in this comparison are probably due to technical artifacts. (A) P-P plot of UNICORN results before (black) and after (green) smoothing to reduce noise. Notice the strong presence of signal in the black P-P plot despite the expectation of no signal when comparing two control datasets. (B) Manhattan plot of UNICORN p values before smoothing exhibits isolated signals without support in the immediate LD neighborhood. (C) Isolated signals are removed after smoothing.

References

    1. Mailman M.D., Feolo M., Jin Y., Kimura M., Tryka K., Bagoutdinov R., Hao L., Kiang A., Paschall J., Phan L. The NCBI dbGaP database of genotypes and phenotypes. Nat. Genet. 2007;39:1181–1186. - PMC - PubMed
    1. Koike A., Nishida N., Inoue I., Tsuji S., Tokunaga K. Genome-wide association database developed in the Japanese Integrated Database Project. J. Hum. Genet. 2009;54:543–546. - PubMed
    1. Spielman R.S., McGinnis R.E., Ewens W.J. Transmission test for linkage disequilibrium: the insulin gene region and insulin-dependent diabetes mellitus (IDDM) Am. J. Hum. Genet. 1993;52:506–516. - PMC - PubMed
    1. Lange C., Laird N.M. Power calculations for a general class of family-based association tests: dichotomous traits. Am. J. Hum. Genet. 2002;71:575–584. - PMC - PubMed
    1. Bacanu S.-A., Devlin B., Roeder K. The power of genomic control. Am. J. Hum. Genet. 2000;66:1933–1944. - PMC - PubMed

Publication types