. 2016 May 5;165(4):910-20.
doi: 10.1016/j.cell.2016.03.029. Epub 2016 Apr 14.

Oncogenic KRAS Regulates Tumor Cell Signaling via Stromal Reciprocation

Affiliations

Oncogenic KRAS Regulates Tumor Cell Signaling via Stromal Reciprocation

Christopher J Tape et al. Cell. .

Erratum in

Abstract

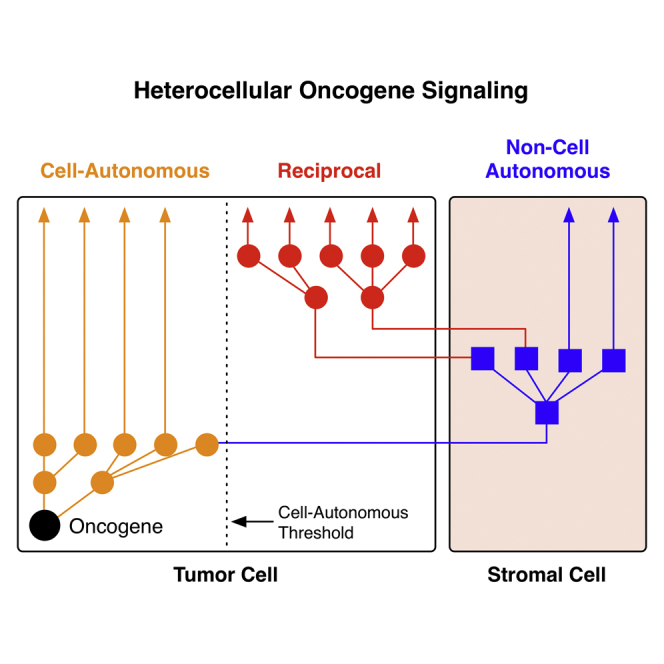
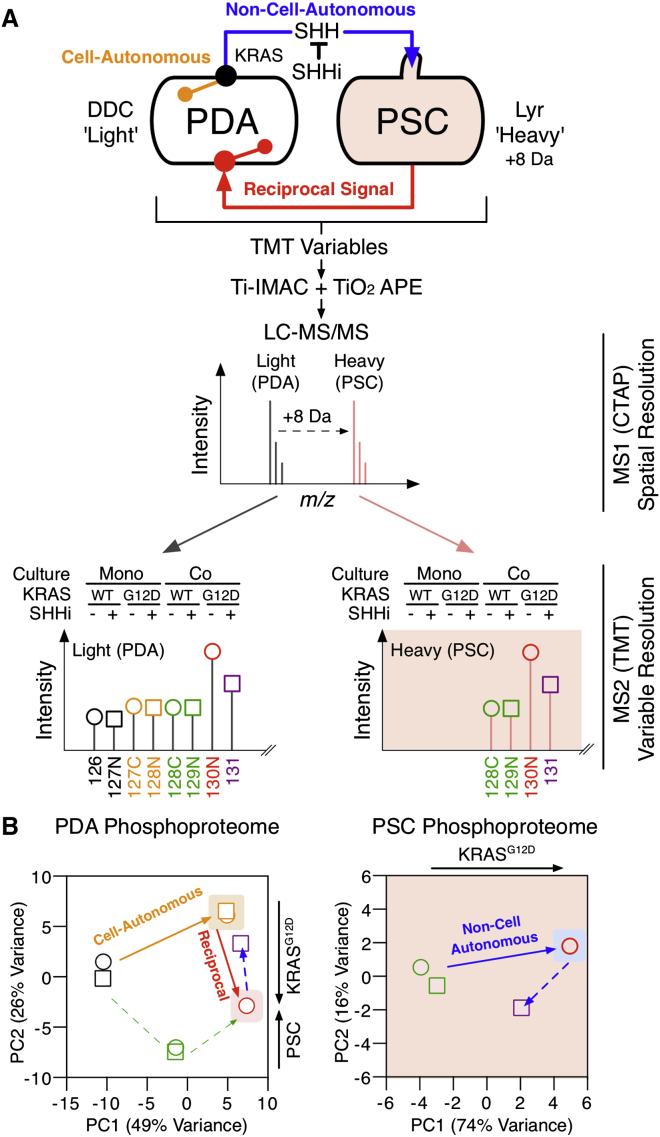
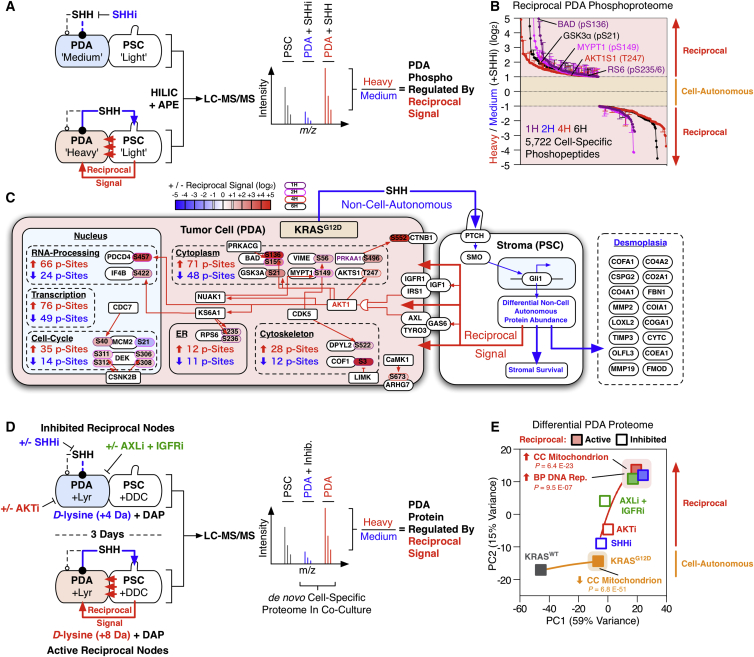
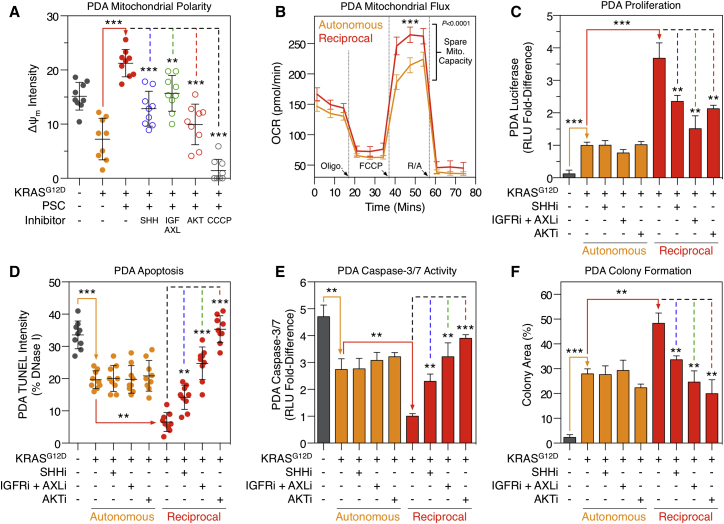
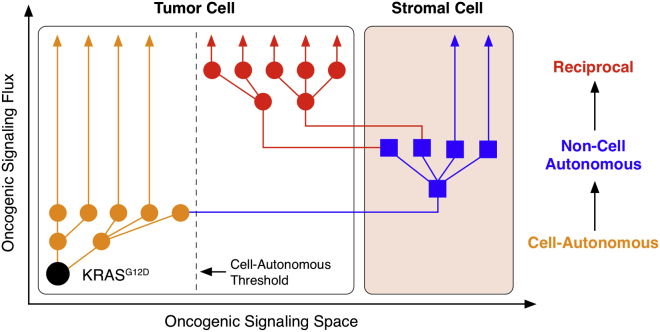
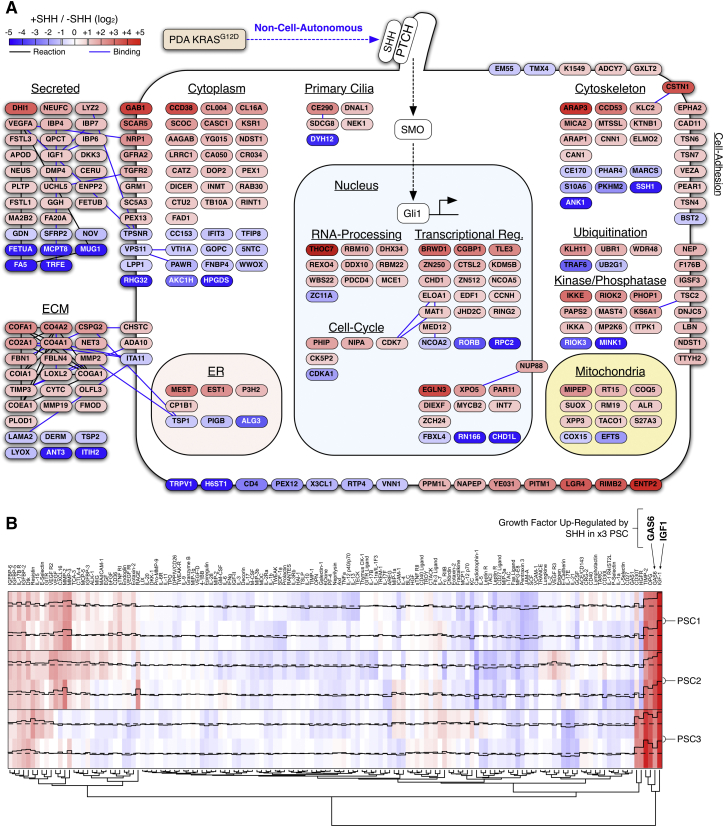
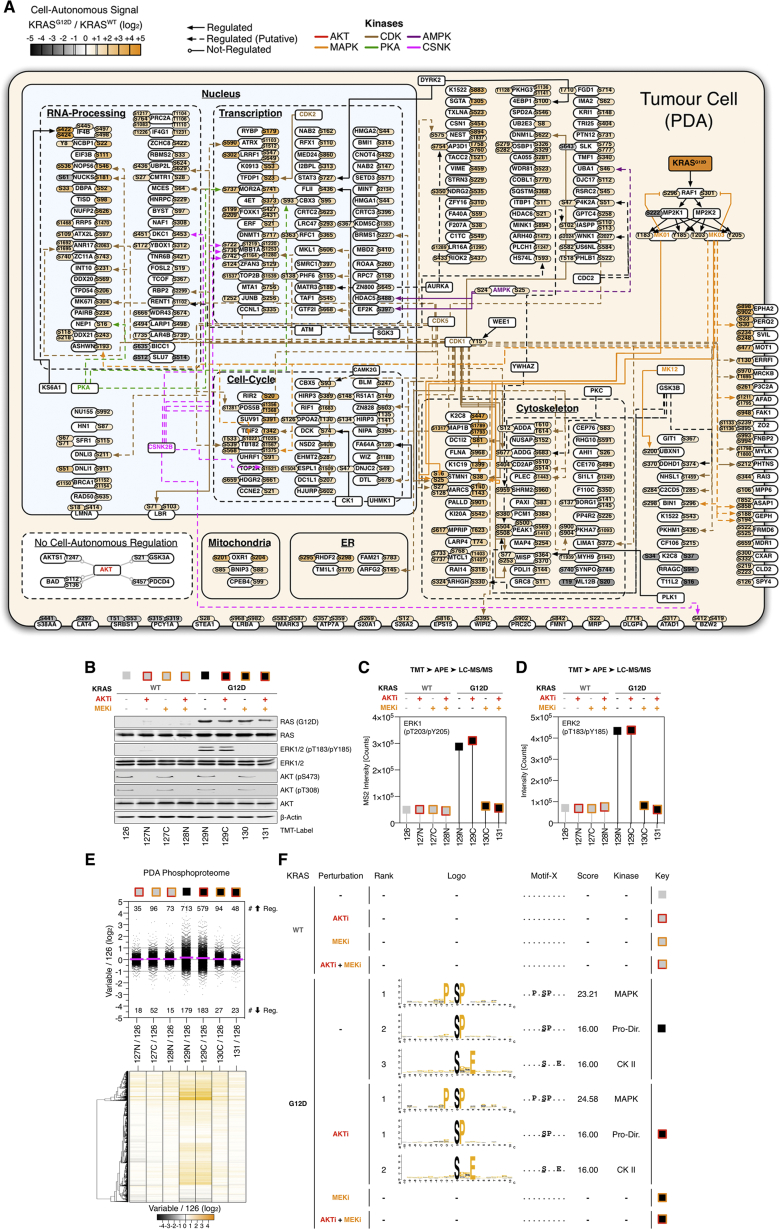
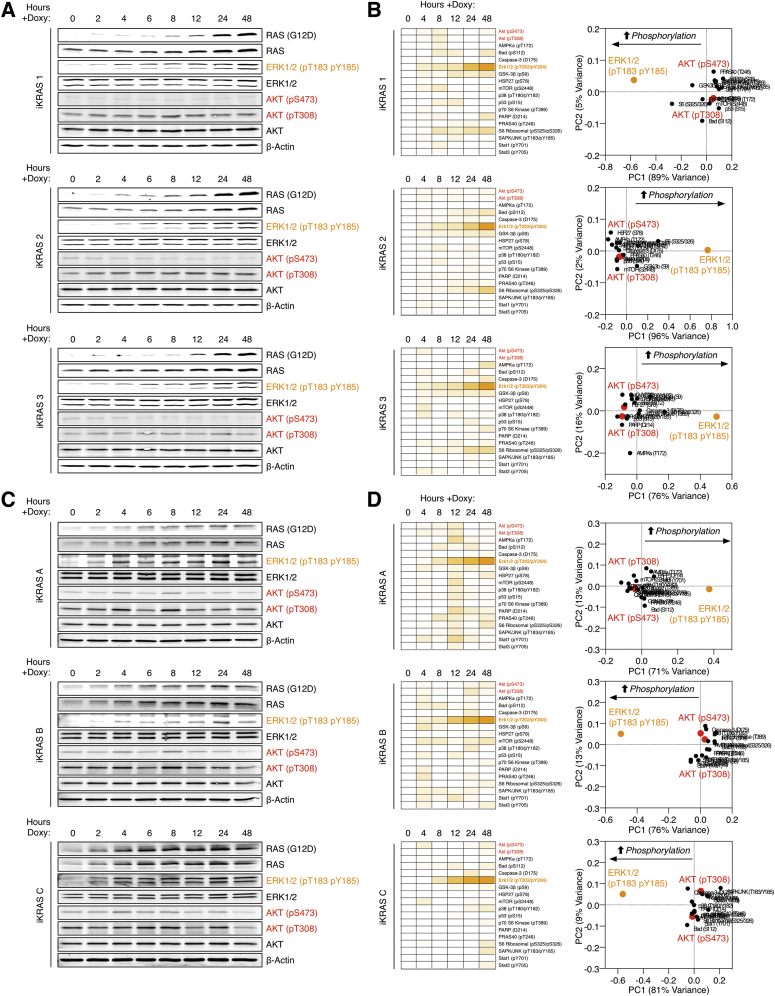
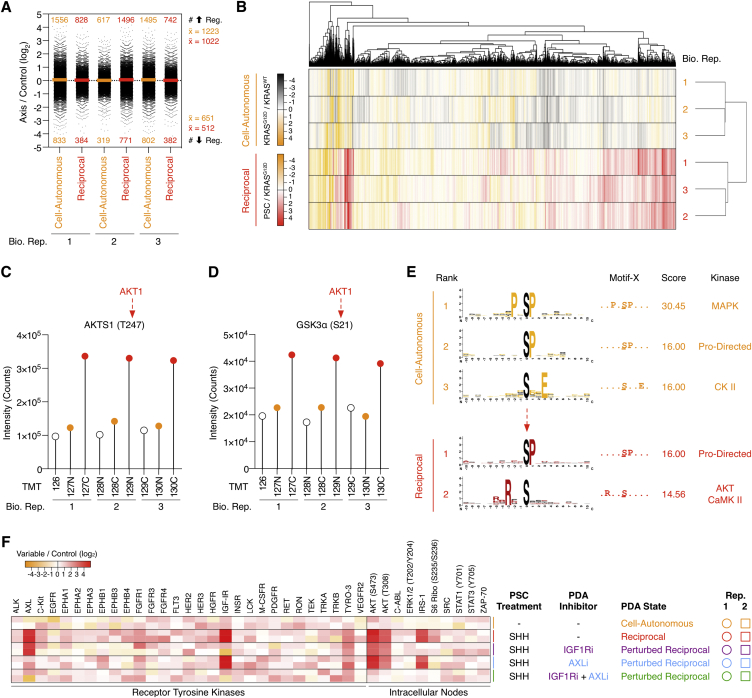
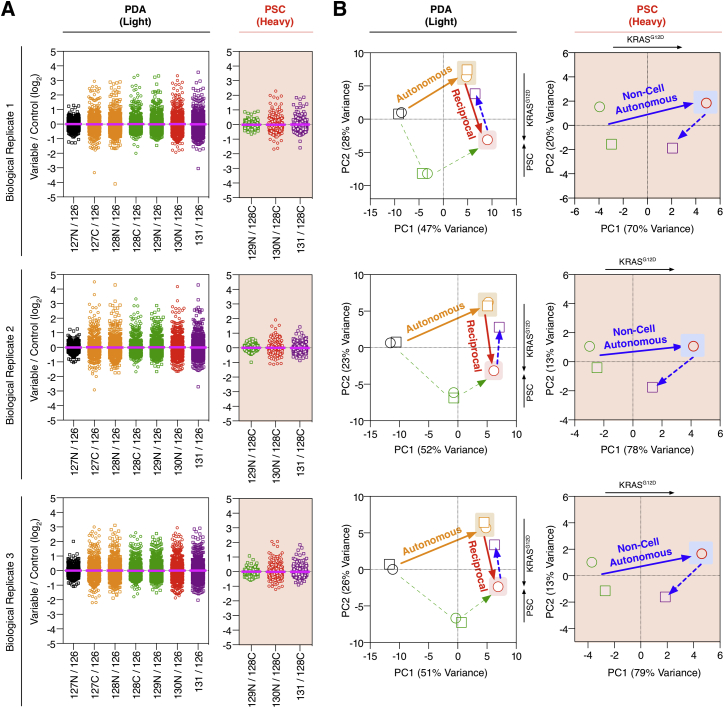
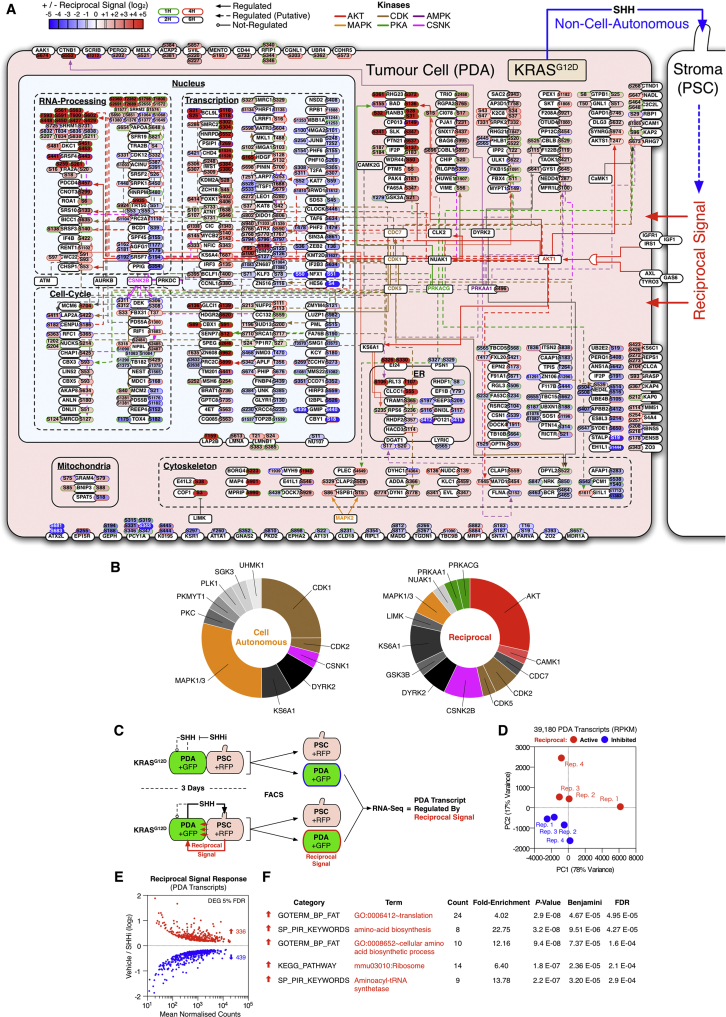
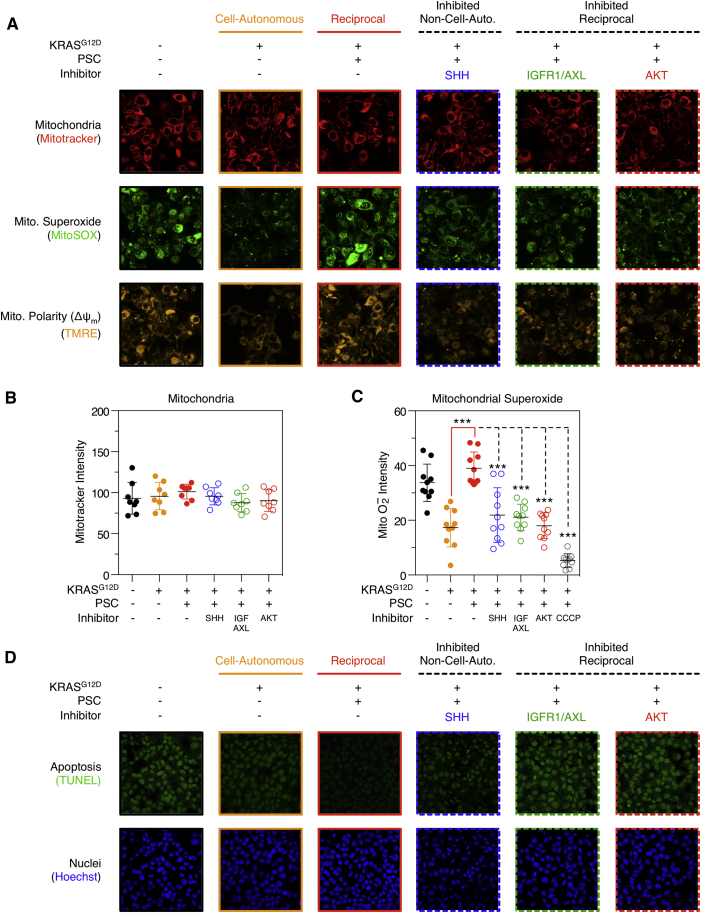
Oncogenic mutations regulate signaling within both tumor cells and adjacent stromal cells. Here, we show that oncogenic KRAS (KRAS(G12D)) also regulates tumor cell signaling via stromal cells. By combining cell-specific proteome labeling with multivariate phosphoproteomics, we analyzed heterocellular KRAS(G12D) signaling in pancreatic ductal adenocarcinoma (PDA) cells. Tumor cell KRAS(G12D) engages heterotypic fibroblasts, which subsequently instigate reciprocal signaling in the tumor cells. Reciprocal signaling employs additional kinases and doubles the number of regulated signaling nodes from cell-autonomous KRAS(G12D). Consequently, reciprocal KRAS(G12D) produces a tumor cell phosphoproteome and total proteome that is distinct from cell-autonomous KRAS(G12D) alone. Reciprocal signaling regulates tumor cell proliferation and apoptosis and increases mitochondrial capacity via an IGF1R/AXL-AKT axis. These results demonstrate that oncogene signaling should be viewed as a heterocellular process and that our existing cell-autonomous perspective underrepresents the extent of oncogene signaling in cancer. VIDEO ABSTRACT.


Figures

None
Graphical abstract
Figure 1
Figure 1
Tumor Cell KRASG12D Non-cell-autonomously Regulates PSCs (A) Soluble growth factor/cytokine/receptor array of conditioned media from three iKRAS PDA cell isolations (KRASG12D/KRASWT) (hierarchical clustering). KRASG12D increases GM-CSF, GCSF, and SHH protein secretion. (B) SHH ELISA of PDA and PSC conditioned media. PSC do not secrete SHH, whereas KRASG12D induces SHH secretion from PDA tumor cells (two-tailed t test) (n = 3). p < 0.05, ∗∗p < 0.01, ∗∗∗p < 0.001. (C) High-content imaging primary cilia quantification (via acetylated tubulin) for all cells (48 hr) (n = 3). PSCs and KRASWT PDA cells possess primary cilia, whereas KRASG12D do not; t test: p < 0.05, ∗∗p < 0.01, ∗∗∗p < 0.001. (D) PSCs and PDA cells (KRASG12D and KRASWT) transfected with a Gli1-luciferase reporter stimulated with SHH for 48 hr ± Smoothened (SMO-i) or Gli (Gli-i) inhibitors. Ligand-dependent SHH signaling (via canonical SMO and Gli activity) is only observed in PSCs and KRASWT PDA cells (n = 3). p < 0.05, ∗∗p < 0.01, ∗∗∗p < 0.001. (E) PSCs transfected with Gli1-luciferase reporter co-cultured with PDA cells ± SHH inhibitory antibody (SHHi). PDA KRASG12D secreted SHH initiates non-cell-autonomous signaling in PSCs. RLU fold-difference versus PSC+Gli1-luciferase in mono-culture (n = 3) (blue = stimulation, black = inhibition). p < 0.05, ∗∗p < 0.01, ∗∗∗p < 0.001. (F) PSC cytoplasmic, membrane, and secreted proteomes regulated by SHH (48 hr). (G) DAVID GO-enrichment analysis of SHH non-cell-autonomously regulated PSC proteome (p < E−06). (H and I) SHH upregulates IGF-1 and GAS6 protein in PSCs, but not in KRASG12D PDA cells. p < 0.05, ∗∗p < 0.01, ∗∗∗p < 0.001. See also Figure S1 and Data S1.
Figure 2
Figure 2
Cell-Autonomous KRASG12D Phosphoproteome (A) KRASWT and KRASG12D PDA cell lysates were isobarically labeled with tandem-mass tags (TMT) (126–131 mass-to-charge ratio [m/z]), mixed, and subjected to automatic phosphopeptide enrichment (APE) (n = 5). TMT-phosphopeptides were analyzed by high-resolution LC-MS/MS and normalized to total protein level changes. (B) KRASWT and KRASG12D phosphoproteomes cluster in PCA space. (C) Statistical regulation of the PDA KRASG12D cell-autonomous phosphoproteome (n = 5, two-tailed t test, Gaussian regression). Cell-autonomous enriched phospho-motifs shown. (D) PDA cell-autonomous regulation of 18 intracellular signaling nodes following KRASG12D induction across 48 hr (n = 3) in PCA space. (E) KRASWT and KRASG12D PDA cells treated ±MEK and AKT inhibitors analyzed by multivariate phosphoproteomics. KRASG12D cell-autonomous PDA phosphoproteomic state requires active MEK and is independent of AKT activity. See also Figures S2, S3, and Data S1.
Figure 3
Figure 3
Activated Stromal Cells Regulate Tumor Cell Signaling beyond Cell-Autonomous KRASG12D (A) Multi-axis phosphoproteomics workflow allows concurrent comparison of different signaling inputs (n = 3). (B) PCA distribution of multi-axis phosphoproteomics. Conditioned medium from SHH-activated PSCs distinctly regulate the PDA phosphoproteome beyond cell-autonomous KRASG12D (n = 3). (C) Multi-axis double volcano phosphoproteome (both cell-autonomous (orange) and reciprocal (red) axis shown). Conditioned medium from activated PSCs regulate AKT substrates and AKT motifs in KRASG12D PDA cells. (D) Phospho-nodes regulated in PDA tumor cells treated with PSC conditioned media ± SHH across 30 min. Activated PSCs regulate PDA IGF1R/IRS-1, AXL/TYRO-3 (2.5 min), and AKT (>5 min) phosphorylation. (E) KRASG12D PDA phosphoproteome ± PSC+SHH conditioned media, +/− MEK and AKT inhibitors. Unlike cell-autonomous KRASG12D, the reciprocal PDA phosphoproteome signaling state requires both MEK and AKT activity. (F) KRASG12D PDA phosphoproteome ± PSC+SHH conditioned media, +/− IGF1R and AXL inhibitors. Combined perturbation of IGF1R and AXL is required to partially restore the PDA cell-autonomous state. (G) PDA molecular logic model. See also Figure S4 and Data S1.
Figure 4
Figure 4
KRASG12D Heterocellular Reciprocal Signaling (A) Heterocellular multivariate phosphoproteomic workflow. CTAP “Light” PDA+DDCM.Tub-KDEL cells ± KRASG12D, +/− SHHi, and +/− “Heavy” PSC+LyrM37-KDEL. Each variable was TMT-labeled and enriched for phosphopeptides (by APE). CTAP labeling provides cell-specific data (MS1 scan) and TMT labeling provides variable-specific data (MS2 scan). (B) Concurrent measurement of cell-autonomous, non-cell-autonomous, and reciprocal phosphoproteomes in a heterocellular environment. Oncogenic reciprocal signaling requires a mutational cue, a trans-cellular signal, and a heterocellular context. See also Figure S5 and Data S1.
Figure 5
Figure 5
Reciprocal Signaling Regulates the Tumor Cell Phosphoproteome and Total Proteome (A) Comprehensive reciprocal signaling phosphoproteomic workflow. PDA cells were SILAC-labeled “Heavy” or “Medium” and co-cultured with “Light” PSCs pre-activated ± SHH respectively. Heterocellular proteomes were co-fractionated by HILIC and automatically enriched for phosphopeptides (by APE). When analyzed by LC-MS/MS, “Heavy”/”Medium” ratios report differential PDA phosphoproteome regulation in a heterocellular context. (B) Reciprocal signaling differential regulates the PDA phosphoproteome (including AKT substrates). (C) Heterocellular oncogenic signaling summary. AKT signaling, RNA-processing, and transcriptional regulation are regulated in PDA tumor cells by reciprocal signaling. (D) Isotopically CTAP-labeled PDA+LyrM37-KDEL cells and PSC+DDCM.tub-KDEL cells were continuously co-cultured ±SHHi, AKTi, or IGF1Ri + AXLi reciprocal node inhibitors. When analyzed by LC-MS/MS, “Heavy”/“Medium” ratios report differential PDA proteome in a heterocellular context. (E) Reciprocal signaling produces a differential proteomic state (including mitochondrial and DNA replication proteins) in PDA cells. Second order polynomial regression. See also Figure S6 and Data S1.
Figure 6
Figure 6
Reciprocal Signaling Regulates Tumor Cell Phenotypes (A) High-content live-cell TMRE analysis of PDA mitochondrial polarity. As predicted by heterocellular proteomics, reciprocal signaling restores mitochondrial polarity via SHH, IGF1R/AXL, and AKT (Δψm) (n = 9). p < 0.05, ∗∗p < 0.01, ∗∗∗p < 0.001. (B) PDA mitochondrial flux analysis. As predicted by heterocellular proteomics, reciprocal signaling increases spare mitochondrial capacity when compared to cell-autonomous KRASG12D alone (two-way ANOVA). OCR, oxygen consumption rate. p < 0.05, ∗∗p < 0.01, ∗∗∗p < 0.001. (C) Cell-autonomous and reciprocal proliferation of luciferase-labeled tumor cells. Reciprocal KRASG12D (heterocellular, red) increases PDA proliferation relative to cell-autonomous KRASG12D (homocellular, orange). Inhibitors of reciprocal nodes only perturb heterocellular tumor cells (n = 3). p < 0.05, ∗∗p < 0.01, ∗∗∗p < 0.001. (D) High-content TUNEL imaging of PDA apoptosis. Reciprocal signaling protects tumor cells from apoptosis beyond cell-autonomous KRASG12D. Inhibiting IGF1R/AXL or AKT increases apoptosis when reciprocal signaling is active (n = 9). p < 0.05, ∗∗p < 0.01, ∗∗∗p < 0.001. (E) Caspase 3/7 activity in (D) (n = 3). p < 0.05, ∗∗p < 0.01, ∗∗∗p < 0.001. (F) Semi-solid PDA colony formation. Reciprocal signals increase colony formation (via SHH, IGF1R/AXL, and AKT) relative to cell-autonomous KRASG12D alone (n = 3). p < 0.05, ∗∗p < 0.01, ∗∗∗p < 0.001. See also Figure S7.
Figure 7
Figure 7
Heterocellular Oncogenic Signaling In a homocellular context, tumor cell oncogenic signaling operates within distinct cell-autonomous phospho-networks. As heterotypic cell types can transduce different signals, a heterocellular system provides increased oncogenic signaling space over a homocellular system. Tumor cells can use heterocellularity to bypass the cell-autonomous threshold via non-cell-autonomous signaling. Activated stromal cells can then return unique reciprocal signals to the initiating oncogenic tumor cell. Reciprocal signaling subsequently allows oncogenes to adopt a tumor cell oncogenic signaling space beyond cell-autonomous signaling alone.
Figure S1
Figure S1
SHH Regulates Cytoplasmic, Membrane, and Secreted PSC Proteomes, Related to Figure 1 (A) Cellular heat map of regulated proteins from the experiment described in Figure 1F (Uniprot annotation). SHH stimulation of PSCs results in widespread differential regulation of secreted signaling molecules, cell-adhesion membrane proteins, components of the extracellular matrix (ECM), cytoplasmic molecules and nuclear proteins. String annotations for ‘Reaction’ and ‘Binding’ relationships are shown. (B) Soluble growth-factor and cytokine antibody array of conditioned media from PSCs stimulated with SHH or vehicle control (48 hr). SHH upregulates GAS6 and IGF1 across all three PSC isolations.
Figure S2
Figure S2
Cell-Autonomous KRASG12D Phosphoproteome, Related to Figure 2 (A) Cellular heat map of phosphoproteomic data described in Figure 2. Phosphosites in PDA tumor cells ± 1 log2, p < 0.01 (two-tailed t test) following KRASG12D induction (Uniprot annotation). Parent kinases are assigned as empirical (Uniprot) or putative (Scansite 3.0, ‘High-Stringency’, top 0.2% percentile). Cell-autonomous KRASG12D signaling is largely dictated by MAPK1/3 and CDK1. No cell-autonomous regulation of AKT substrates was observed. (B) PDA cells were cultured ± KRASG12D (1 μg/mL doxycycline) +/− AKTi (500 nM MK2206), +/− MEKi (500 nM PD 184352) or vehicle control for 12 hr. Immuno-blot analysis confirms expression of KRASG12D, ERK1/2 phosphorylation, and MEKi / AKTi activity. Each condition was individually digested, TMT-labeled, pooled, enriched for phosphopeptides and analyzed by LC-MS/MS. (C) Raw product ion TMT intensities for pERK1 (pT203/pY205). (D) Raw product ion TMT intensities for pERK2 (pT183/pY185). (E) Differential phosphopeptide abundance across all variables (regulated = +/− 1 log2) as data-spread (bold line = replicate mean) and hierarchical clustered heatmap. (F) Motif-X analysis of upregulated (variable / 126 = log2 ≥ 1) phosphopeptides. Active ERK conditions (KRASG12D, no MEK inhibitor) demonstrate enriched MAPK, Pro-Directed and CK II motifs. No regulated motifs were enriched from inactive ERK conditions (with MEK inhibitor).
Figure S3
Figure S3
PDA KRASG12D Expression Regulates Cell-Autonomous ERK1/2, but Not AKT, Related to Figure 2 (A) iKRAS PDA cells (1, 2 and 3) were switched from KRASWT (0 hr) to KRASG12D (via doxycycline) across 48 hr. Phosphorylated ERK1/2 (pT183/pY185) and AKT (pS473; pT308) were assessed by Western blot. While KRASG12D expression closely correlates with phosphorylated ERK1/2 (pT183/pY185), AKT (pS473; pT308) is not regulated. (B) PDA cells were switched from KRASWT (0 hr) to KRASG12D (via doxycycline) across 48 hr. 18 intracellular signaling nodes were monitored using a reverse-phase antibody capture array. In agreement with Western blot analysis, induction of KRASG12D expression leads to upregulation of ERK1/2 (pT183/pY185), but does not regulate AKT (pS473; pT308) or AKT substrates. (C) Identical experiment to (A), but with PDA cells (A–C) described by Collins et al. (2012). In these distinct PDA cells, KRASG12D expression also correlates with phosphorylated ERK1/2 (pT183/pY185), whereas cell-autonomous epithelial KRASG12D does not regulate AKT (pS473; pT308). (D) Identical experiment to b) but with iKRAS cells from Collins et al., 2012. Again, KRASG12D upregulates ERK1/2 (pT183/pY185), but does not regulate AKT (pS473; pT308) or AKT substrates.
Figure S4
Figure S4
Multi-axis Phosphoproteomics, Related to Figure 3 (A) Differential PDA phosphopeptide distributions across all biological replicates as data spread (bold line = replicate mean) from the experiment described in Figure 3A. (B) Hierarchal clustering of multi-axis phosphoproteomic biological replicates group each signaling axis. (C) Raw TMT product ion intensity spectra of the AKT substrate AKTS1 (pT247). (D) Raw TMT product ion intensity spectra of the AKT substrate GSK3α (pS21). (E) Motif-X analysis of upregulated (log2 ≥ 1) phosphopeptides. Cell-autonomous KRASG12D regulates MAPK, CDK and CK2 motifs. Reciprocal signaling introduces AKT/CaMK II motif regulation. (F) PDA (KRASG12D) receptor tyrosine kinase (RTK) and intracellular node phosphorylation following treatment with PSC conditioned medium ± SHH for 2.5 min. Combined PDA pre-treatment with IGF1R inhibitor (250 nM Picropodophyllin (PPP)) and AXL inhibitor (500 nM R428) is required to block early AKT phosphorylation.
Figure S5
Figure S5
Biological Replicates of Heterocellular Multivariate Phosphoproteomics, Related to Figure 4 (A) Cell-specific differential phosphopeptide abundance from CTAP ‘Light’ PDA+DDCM.Tub-KDEL and ‘Heavy’ (K +8 Da) PSC+LyrM37-KDEL cells across all variables and replicates (bold line = variable mean) (from Figure 4). (B) Differential cell-specific phosphoproteomic PCA states for each replicate. KRASG12D, active SHH and PSCs (reciprocal signaling axis) achieve a distinct phosphoproteomic state. (Cell-autonomous axis, orange; non-cell-autonomous, blue; reciprocal axis, red; non-oncogene driven stromal, green.)
Figure S6
Figure S6
PDA Reciprocal Phosphoproteome and Transcriptome, Related to Figure 5 (A) Cellular heat map of phosphoproteomic data described in Figure 5. Phosphosites in PDA tumor cells ± 1 log2, following reciprocal signal induction. Parent kinases are assigned as empirical (Uniprot) or putative (Scansite 3.0 ‘High-Stringency’, top 0.2% percentile). Reciprocal signaling upregulates AKT substrates and modifies proteins involved in RNA-processing and transcriptional regulation. (B) Uniprot parent kinase annotations of upregulated (≥1 log2) phosphosites by cell-autonomous (n = 24) and reciprocal (n = 28) signaling axis. Cell-autonomous KRASG12D signaling is dominated by CDK1 and MAPK1/3 activity. No AKT substrates are regulated by cell-autonomous KRASG12D. Conversely, reciprocal KRASG12D signaling regulates multiple AKT substrates and does not modulate any CDK1 substrates. (C) RNA-seq workflow. PDA+GFP cells were co-cultured with PSC+RFP cells ± SHHi for 3 days. PDA cells were resolved by FACS and subjected to RNA-seq analysis (n = 4). (D) PCA distribution of reads per killable per million mapped reads (RPKM) values. (E) Differentially expressed genes (DEG) at 5% FDR. (F) DAVID functional GO-enrichment analysis of upregulated DEGs (p < E-06). Reciprocal signaling upregulates transcripts associated with protein translation and amino acid biosynthesis in PDA cells.
Figure S7
Figure S7
KRASG12D Cell-Autonomous and Reciprocal Regulation of PDA Mitochondria, Related to Figure 6 (A) PDA tumor cells stained for total mitochondria (MitoTracker), mitochondrial superoxide (MitSOX) and mitochondrial polarity (Δψm) (TMRE). While cell-autonomous and reciprocal KRASG12D does not alter total mitochondria staining, reciprocal signaling upregulates mitochondrial superoxide and mitochondrial polarity. (B and C) High-content imaging quantification of mitochondrial intensity and superoxide (two-tailed t test:  = p < 0.05, ∗∗ = p < 0.01, ∗∗∗ = p < 0.001) (all error bars = SD, n = 10). (D) High-content imaging of TUNEL and Hoechst stained PDA cells.

References

    1. Almoguera C., Shibata D., Forrester K., Martin J., Arnheim N., Perucho M. Most human carcinomas of the exocrine pancreas contain mutant c-K-ras genes. Cell. 1988;53:549–554. - PubMed
    1. Baer R., Cintas C., Dufresne M., Cassant-Sourdy S., Schönhuber N., Planque L., Lulka H., Couderc B., Bousquet C., Garmy-Susini B. Pancreatic cell plasticity and cancer initiation induced by oncogenic Kras is completely dependent on wild-type PI 3-kinase p110α. Genes Dev. 2014;28:2621–2635. - PMC - PubMed
    1. Brock A., Krause S., Ingber D.E. Control of cancer formation by intrinsic genetic noise and microenvironmental cues. Nat. Rev. Cancer. 2015;15:499–509. - PubMed
    1. Collins M.A., Bednar F., Zhang Y., Brisset J.C., Galbán S., Galbán C.J., Rakshit S., Flannagan K.S., Adsay N.V., Pasca di Magliano M. Oncogenic Kras is required for both the initiation and maintenance of pancreatic cancer in mice. J. Clin. Invest. 2012;122:639–653. - PMC - PubMed
    1. Croce C.M. Oncogenes and cancer. N. Engl. J. Med. 2008;358:502–511. - PubMed

Publication types