. 2016 Apr 18:6:24672.
doi: 10.1038/srep24672.

Reduced costs of reproduction in females mediate a shift from a male-biased to a female-biased lifespan in humans

Affiliations

Reduced costs of reproduction in females mediate a shift from a male-biased to a female-biased lifespan in humans

Elisabeth Bolund et al. Sci Rep. .

Abstract

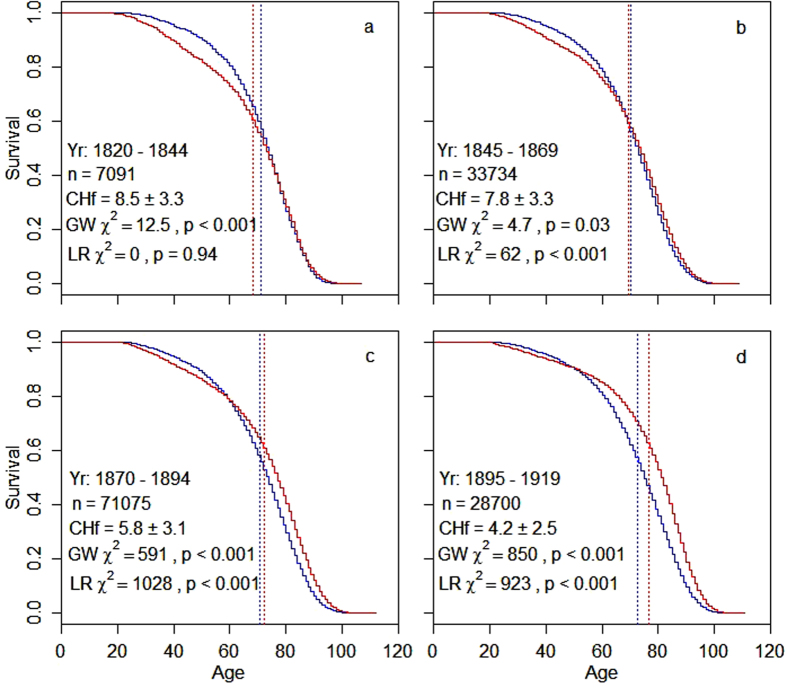
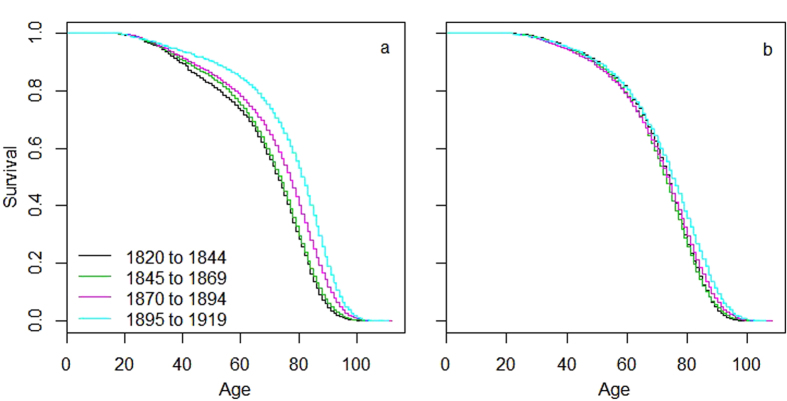
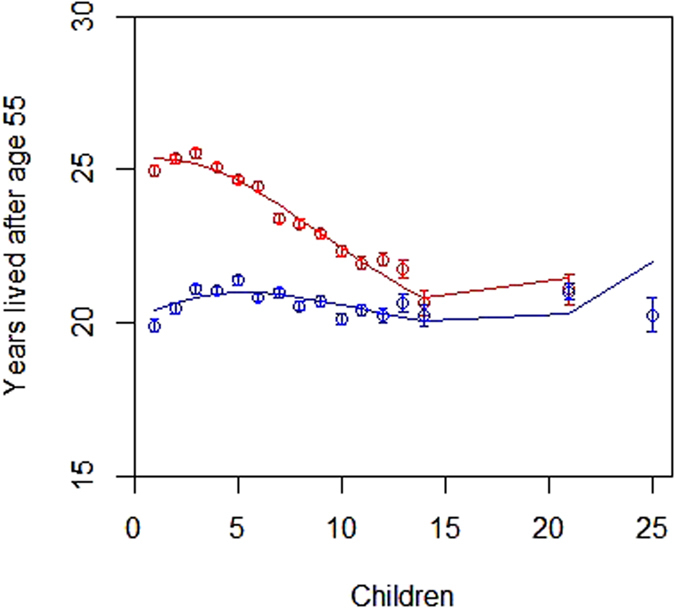
The causes underlying sex differences in lifespan are strongly debated. While females commonly outlive males in humans, this is generally less pronounced in societies before the demographic transition to low mortality and fertility rates. Life-history theory suggests that reduced reproduction should benefit female lifespan when females pay higher costs of reproduction than males. Using unique longitudinal demographic records on 140,600 reproducing individuals from the Utah Population Database, we demonstrate a shift from male-biased to female-biased adult lifespans in individuals born before versus during the demographic transition. Only women paid a cost of reproduction in terms of shortened post-reproductive lifespan at high parities. Therefore, as fertility decreased over time, female lifespan increased, while male lifespan remained largely stable, supporting the theory that differential costs of reproduction in the two sexes result in the shifting patterns of sex differences in lifespan across human populations. Further, our results have important implications for demographic forecasts in human populations and advance our understanding of lifespan evolution.


Figures

Figure 1
Figure 1. Age-specific survival after the onset of reproduction in four 25-year birth cohorts that cover the demographic transition in Utah.
Survival curves represent females (red) and males (blue) that reproduced and had full known reproductive history. Shown in each figure are the birth years contained in that cohort (Yr), the sample size (n), the average ± SD number of children born to females (CHf), the χ2 and p-values indicating differences in the survivor function between the two sexes from the Peto and Peto modification of the Gehan-Wilcoxon test (GW, this test weights differences in survivorship that occur early more heavily than differences at later survival times) and from a log-rank test (LR, this test weights differences at later survival times more heavily). Dotted vertical lines indicate the average lifespan of each sex in each cohort.
Figure 2
Figure 2. Change in adult survival over four 25-year birth cohorts.
Survival curves represent females (a) and males (b) that reproduced and had full known reproductive history. Colours indicate the birth years contained in each cohort. For sample sizes, see Fig. 2.
Figure 3
Figure 3. The number of years lived after the end of the potential reproductive period (age 55 years) related to the number of children born.
Curves represent females (red) and males (blue) that reproduced and were born between 1820 and 1920. The raw data are grouped here for visual purposes only while analyses (see main text) are performed on ungrouped data and account for a number of fixed and random effects. Points with associated SE refer to grouped averages for all individuals of each sex at each parity. For ease of illustration, individuals are grouped at high parities into categories with 15–21 children and 22–65 children (only males, plotted at value 25 on the x-axis). Lines represent the best fit from third order polynomial regressions weighted by the sample size in each group (sample sizes range from 282 to 7264).

References

    1. Maklakov A. A. & Lummaa V. Evolution of sex differences in lifespan and aging: Causes and constraints. Bioessays 35, 717–724, doi: 10.1002/bies.201300021 (2013). - DOI - PubMed
    1. Nussey D. H., Froy H., Lemaitre J.-F., Gaillard J.-M. & Austad S. N. Senescence in natural populations of animals: Widespread evidence and its implications for bio-gerontology. Ageing Res Rev 12, 214–225, doi: 10.1016/j.arr.2012.07.004 (2013). - DOI - PMC - PubMed
    1. Promislow D. Mate choice, sexual conflict, and evolution of senescence. Behavior Genetics 33, 191–201, doi: 10.1023/A:1022562103669 (2003). - DOI - PubMed
    1. Trivers R. L. In Sexual selection and the descent of man (ed Campbell B. G.) 136–207 (Aldine, 1972).
    1. Williams G. C. Pleiotropy, natural selection, and the evolution of senescence. Evolution 11, 398–411, doi: 10.2307/2406060 (1957). - DOI

Publication types

LinkOut - more resources