. 2016 Apr 18:6:24168.
doi: 10.1038/srep24168.

Early-onset obesity dysregulates pulmonary adipocytokine/insulin signaling and induces asthma-like disease in mice

Affiliations

Early-onset obesity dysregulates pulmonary adipocytokine/insulin signaling and induces asthma-like disease in mice

Katharina Dinger et al. Sci Rep. .

Abstract

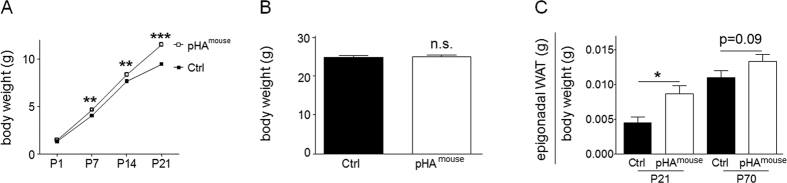
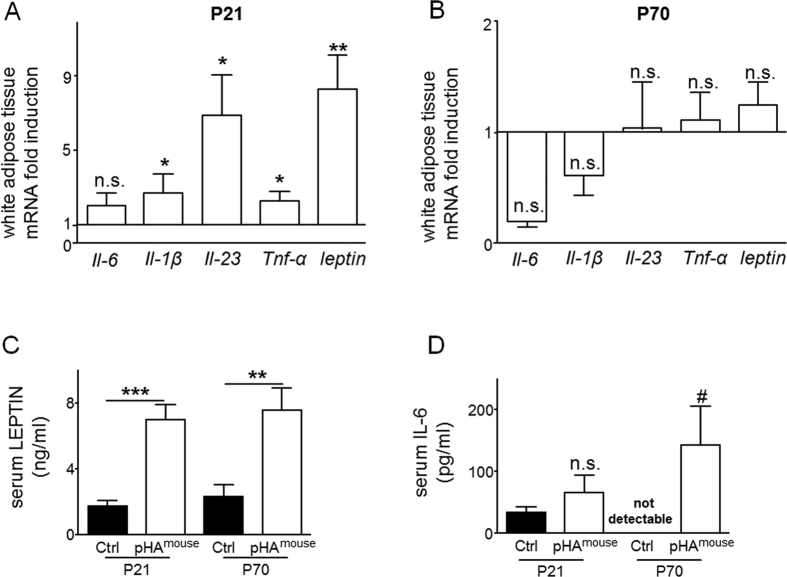
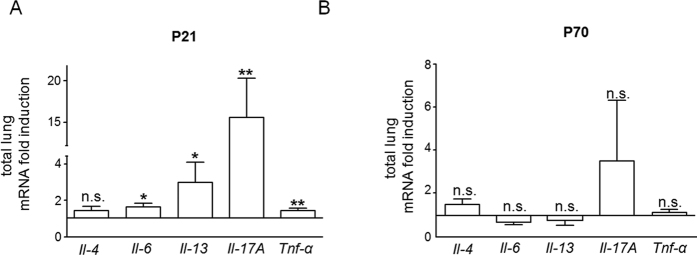
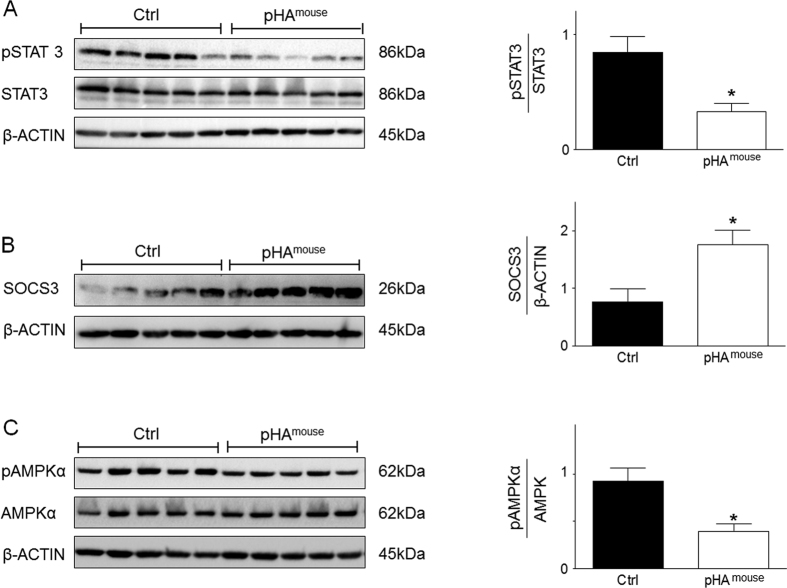
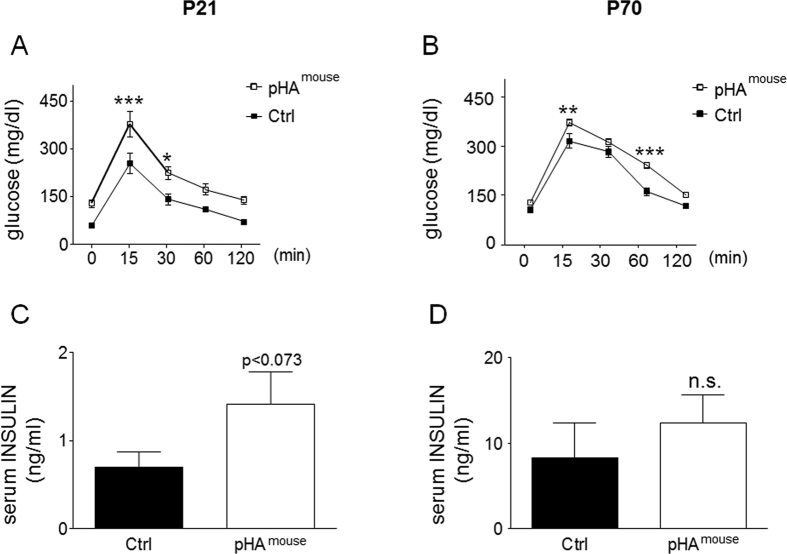
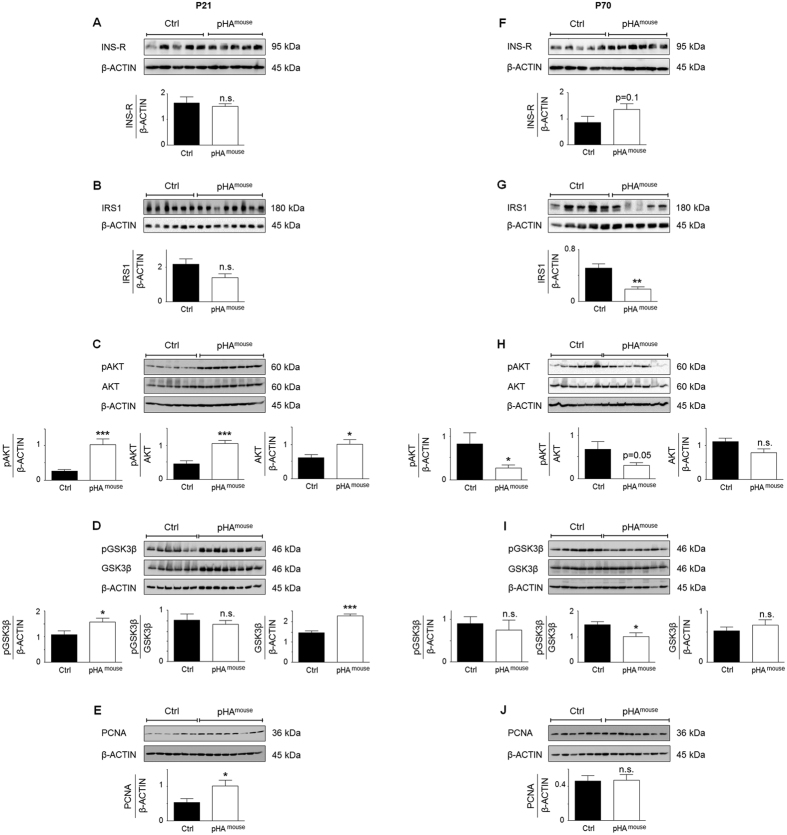
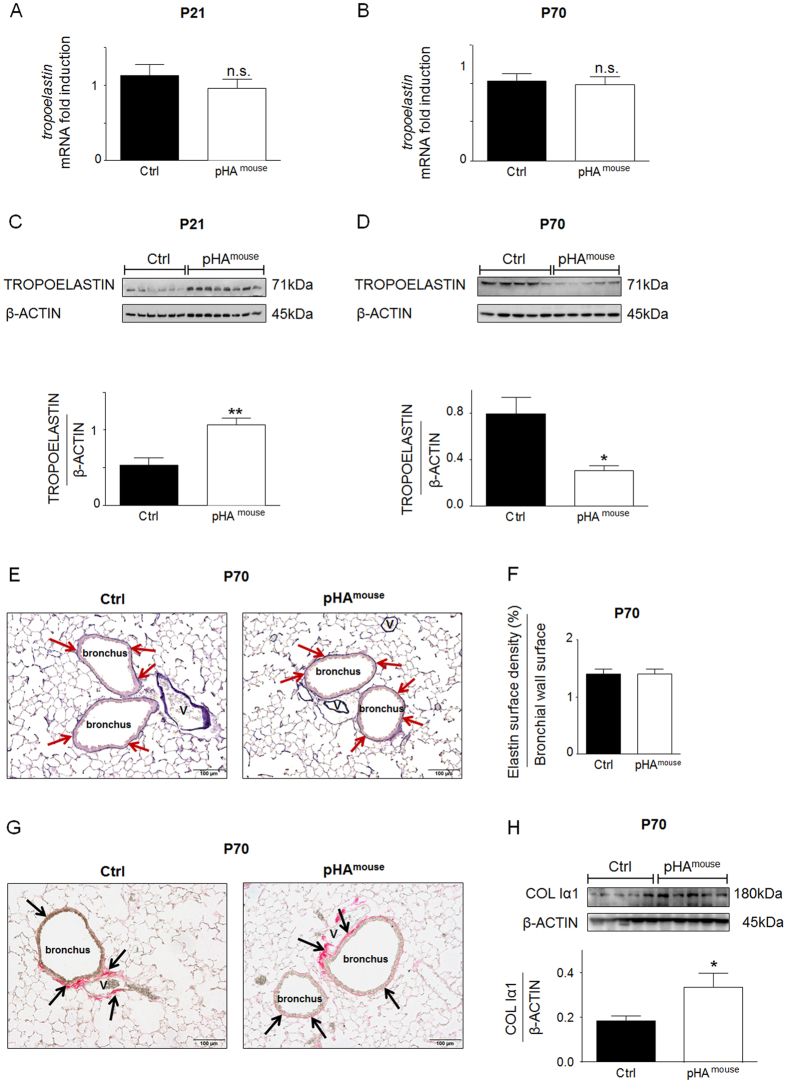
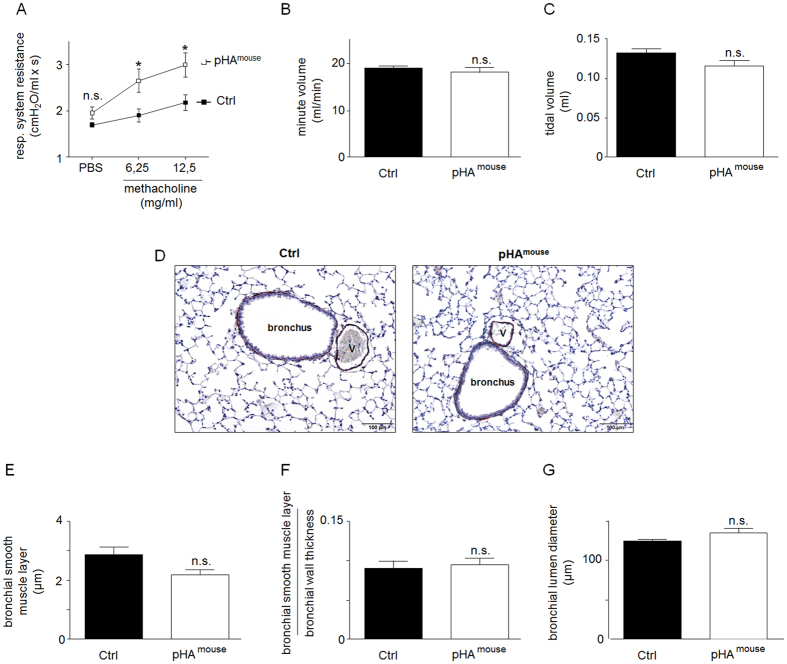
Childhood obesity is a risk factor for asthma, but the molecular mechanisms linking both remain elusive. Since obesity leads to chronic low-grade inflammation and affects metabolic signaling we hypothesized that postnatal hyperalimentation (pHA) induced by maternal high-fat-diet during lactation leads to early-onset obesity and dysregulates pulmonary adipocytokine/insulin signaling, resulting in metabolic programming of asthma-like disease in adult mice. Offspring with pHA showed at postnatal day 21 (P21): (1) early-onset obesity, greater fat-mass, increased expression of IL-1β, IL-23, and Tnf-α, greater serum leptin and reduced glucose tolerance than Control (Ctrl); (2) less STAT3/AMPKα-activation, greater SOCS3 expression and reduced AKT/GSK3β-activation in the lung, indicative of leptin resistance and insulin signaling, respectively; (3) increased lung mRNA of IL-6, IL-13, IL-17A and Tnf-α. At P70 body weight, fat-mass, and cytokine mRNA expression were similar in the pHA and Ctrl, but serum leptin and IL-6 were greater, and insulin signaling and glucose tolerance impaired. Peribronchial elastic fiber content, bronchial smooth muscle layer, and deposition of connective tissue were not different after pHA. Despite unaltered bronchial structure mice after pHA exhibited significantly increased airway reactivity. Our study does not only demonstrate that early-onset obesity transiently activates pulmonary adipocytokine/insulin signaling and induces airway hyperreactivity in mice, but also provides new insights into metabolic programming of childhood obesity-related asthma.


Figures

Figure 1
Figure 1. Maternal high-fat diet (HFD) feeding during lactation induces early postnatal hyperalimentation (pHA), early-onset overweight and increased white adipose tissue (WAT) in the murine offspring.
(A) Body weight gain (gram) from postnatal day 1 (P1) to P21. Early postnatal hyperalimentation (open square; n = 36 from 9 litters; pHAmouse group), Ctrl (solid square; n = 30 from 6 litters; Ctrl). (B) Body weight (gram) at P70 (Ctrl: n = 21 from 7 litters; pHAmouse: n = 18 from 6 litters). (C) WAT weight (gram) relative to body weight (gram) at P21 (Ctrl: n = 10 from 5 litters; pHAmouse: n = 11 from 6 litters) and at P70 (Ctrl: n = 11 from 6 litters; pHAmouse: n = 17 from 7 litters). pHAmouse group: white bar, Ctrl: black bar. Mean ± SEM; two way ANOVA test and Bonferroni posttest (A), Mann Whitney test. (B,C); *p < 0.05, **p < 0.01, ***p < 0.001; n.s. = not significant.
Figure 2
Figure 2. Early postnatal hyperalimentation (pHA) and early-onset obesity lead to transient increased mRNA expression of adipocytokines and persistent greater circulating concentrations of serum leptin and IL-6 in murine offspring.
(A,B) Total white adipose tissue (WAT) mRNA expression of genes encoding Il-1β, Il-6, Il-23, Tnf-α, and leptin was assessed by quantitative real-time PCR at postnatal day 21 P21 (A) (Ctrl: n = 9 from 5 litters; pHAmouse: n = 11 from 6 litters) and P70 (B) (Ctrl: n = 9 from 6 litters; pHAmouse: n = 9 from 6 litters). The Ctrl was normalized to 1; early postnatal hyperalimentation (white bar; pHAmouse group). (C) Serum level of leptin (ng/ml) at P21 (Ctrl: n = 8 from 5 litters; pHAmouse: n = 8 from 6 litters) and at P70 (Ctrl: n = 7 from 6 litters; pHAmouse: n = 7 from 4 litters). (D) Serum level of IL-6 (pg/ml) at P21 (Ctrl: n = 7 from 5 litters; pHAmouse: n = 5 from 5 litters) and at P70 (Ctrl: n = 4 from 3 litters; pHAmouse: n = 5 from 2 litters). pHAmouse group: white bar, Ctrl: black bar. Mean ± SEM; Mann Whitney test (*), two way ANOVA test and Bonferroni posttest (#); *,#p < 0.05, **p < 0.01, ***p < 0.001; n.s. = not significant.
Figure 3
Figure 3. Greater expression of pro-asthmatic cytokines (IL-4, IL-6, IL-13, IL-17A, and TNFα) in lungs of mice with early postnatal hyperalimentation (pHA) and early-onset obesity.
(A,B) Total lung mRNA expression of genes encoding Il-4, Il-6, Il-13, Il-17A and Tnf-α was assessed by quantitative real-time PCR at (A) P21 (Ctrl: n = 10 from 5 litters; pHAmouse: n = 10 from 6 litters) and at (B) P70 (Ctrl: n = 9–10 from 6 litters; pHAmouse: n = 10 from 6 litters). The Ctrl was normalized to 1; early postnatal hyperalimentation (white bar; pHAmousegroup). Mean ± SEM; Mann Whitney test; *p < 0.05, **p < 0.01; n.s. = not significant.
Figure 4
Figure 4. Early dysregulation of STAT3-AMPKα-SOCS3 signaling in lungs of mice with early postnatal hyperalimentation (pHA) and early-onset obesity at postnatal day 21 (P21).
(A) Immunoblots showing lung protein expression of total STAT3, and phosphorylation of STAT3 (pSTAT3) at P21; Ctrl: n = 5 from 4 litters; pHAmouse: n = 5 from 4 litters. (B) Assessment of suppressor of cytokine signaling 3 (SOCS3), a leptin/IL-6 target, by immunoblot at P21; Ctrl: n = 5 from 4 litters; pHAmouse: n = 5 from 4 litters. (C) Representative immunoblot for total AMPKα and phosphorylated AMPKα (p AMPKα) in lungs at P21; Ctrl: n = 6 from 4 litters; pHAmouse: n = 8 from 4 litters. β-ACTIN served as loading Control (Ctrl). The densitometric analyses are presented next to the respective immunoblot. pHAmousegroup: white bar; Ctrl: black bar. Mean ± SEM; Mann Whitney test; *p < 0.05.
Figure 5
Figure 5. Early-onset overweight with early-onset obesity induces glucose intolerance and mild hyperinsulinemia.
(A,B) Intraperitoneal glucose tolerance test (i.p. GTT) at postnatal day 21 (A) and 70 (B) (P21 and P70); blood glucose levels (mg/dl) 0, 15, 30, 60, and 120 min after i.p. injection of glucose. P21: Ctrl, n = 12 from 5 litters; pHAmouse: n = 6 from 6 litters: P70: Ctrl: n = 7 from 3 litters; pHAmouse: n = 16 from 5 litters. two way ANOVA test and Bonferroni posttest. Early postnatal hyperalimentation (open square; pHAmousegroup), Ctrl (solid square; Ctrl). (C,D) Serum levels of insulin (ng/ml) at P21 (C): Ctrl: n = 7 from 5 litters; pHAmouse: n = 7 from 6 litters, and P70 (D): Ctrl: n = 5 from 4 litters; pHAmouse, n = 6 from 3 litters. Mann Whitney test; *p < 0.05, **p < 0.01, ***p < 0.001; n.s. = not significant.
Figure 6
Figure 6. Early postnatal hyperalimentation (pHA) with early-onset obesity induces transient activation of intrinsic pulmonary insulin signaling at postnatal day 21 (P21), and inhibition at P70.
(A–E) Immunoblots showing indicators of insulin signaling at P21. (A) Protein expression of insulin receptor (INS-R) in lungs at P21; Ctrl: n = 5 from 4 litters; pHAmouse: n = 5 from 4 litters. (B) Protein abundance of insulin receptor substrate 1 (IRS1) in lungs at P21; Ctrl: n = 6 from 4 litters; pHAmouse: n = 8 from 4 litters. (C) Assessment of phosphorylated AKT (pAKT) and total AKT in the lungs at P21; Ctrl: n = 6 from 4 litters; pHAmouse: n = 8 from 4 litters. (D) Immunoblots showing phosphorylated and total GSK-3β in lungs at P21; Ctrl: n = 6 from 4 litters; pHAmouse: n = 8 from 4 litters. (E) Protein abundance of proliferating cell nuclear antigen (PCNA) as an index of proliferation at P21; Ctrl: n = 6 from 4 litters; pHAmouse: n = 8 from 4 litters. (F–J) Assessement of indicators of insulin signaling at P70 using immunoblots. (F) Protein expression of INS-R in the lungs at P70; Ctrl: n = 5 from 4 litters; pHAmouse: n = 5 from 4 litters. (G) Protein abundance of IRS1 in lungs at P70; Ctrl: n = 5 from 4 litters; pHAmouse: n = 5 from 4 litters. (H) Immunoblots for pAKT and total AKT in lungs at P70; Ctrl: n = 6 from 4 litters; pHAmouse: n = 8 from 4 litters. (I) Phosphorylated and total GSK-3β in lungs at P21; Ctrl: n = 6 from 4 litters; pHAmouse: n = 8 from 4 litters. (J) Immunoblots showing PCNA at P70; Ctrl: n = 6 from 4 litters; pHAmouse: n = 8 from 4 litters. Densitometric analyses were performed and are shown below the corresponding immunoblot; β-ACTIN served as loading Control (Ctrl). Mann Whitney or unpaired t-test. pHAmousegroup: white bar; Ctrl: black bar. Mean ± SEM; *p < 0.05, **p < 0.01, ***p < 0.001; n.s. = not significant.
Figure 7
Figure 7. Early postnatal hyperalimentation (pHA) with early-onset obesity temporo dynamically regulates murine pulmonary elastin synthesis and induces greater collagen Iα1 protein abundance.
(A,B) Assessment of tropoelastin mRNA in total lung homogenate by quantitative qRT-PCR at postnatal day 21 (P21) (A) (Ctrl: n = 10 from 5 litters; pHAmouse: n = 10 from 6 litters) and at P70 (B) (Ctrl: n = 9–10 from 6 litters; pHAmouse: n = 10 from 6 litters). (C,D) Lung protein abundance of TROPOELASTIN at P21 (C) (Ctrl: n = 6 from 4 litters; pHAmouse: n = 8 from 4 litters) and at P70 (D) (Ctrl: n = 5 from 4 litters; pHAmouse: n = 5 from 4 litters). β-ACTIN served as loading Control (Ctrl). Densitometric analyses below the corresponding immunoblot. (E) Representative images illustrating elastic fibers using Hart’s staining in paraffin-embedded and paraformaldehyde-fixed lungs of the Ctrl-group (left panel) and of the pHAmouse-group (right panel) at P70. Red arrows are depicting positive staining of elastic fibers of the conducting airways (100–200 μm diameter). (F) Summary data of the quantification of positive elastic fiber staining surrounding the bronchi (100–200 μm) at P70. Elastin surface density was related to bronchial wall surface; pHAmouse group: n = 6 from 4 litterss, Ctrl: n = 6 from 5 litterss. (G) Representative images illustrating sirius-red staining used to visualize connective tissue of the peribronchial area (black arrows); pHAmouse group: n = 6 from 4 litterss, Ctrl: n = 6 from 5 litterss. (H) Immunoblot showing protein abundance of collagen Iα1 (COL Iα1) at P70. β-ACTIN served as loading Control (Ctrl); Ctrl: n = 5 from 4 litters; pHAmouse: n = 5 from 4 litters. Early postnatal hyperalimentation (pHAmouse group) compared to the Ctrl (Ctrl). pHAmouse group: white bar; Ctrl: black bar. Mean ± SEM; Mann Whitney test. *p < 0.05, **p < 0.01; n.s. = not significant.
Figure 8
Figure 8. Early postnatal hyperalimentation pHA with early-onset obesity leads to greater airway resistance in murine model at postnatal day (P70) despite unaltered bronchial structure.
(A) Airway resistance (Res) after methacholine stimulation measured by direct plethysmography. Exposure of the mice at postnatal day 70 (P70) to PBS, followed by methacholine: 6.25 mg/ml and 12.5 mg/ml. Res was significantly increased after methacholine stimulation at P70 in the group with early postnatal hyperalimentation (pHAmousegroup, n = 14 from 4 litters; open square) compared to the Ctrl (Ctrl, n = 9 from 6 litters; solid square); two-way ANOVA and Bonferroni posttest. (B) Minute volume and (C) tidal volume were measured during direct plethysmography; Mann Whitney test. pHAmouse group: white bar; Ctrl: black bar; Mean ± SEM; Significance for each bar is indicated by p values. (D) Representative images of bronchi stained for α-smooth muscle actin (α-SMA) as an indicator of smooth muscle cells. Summary data for (E) measurement of the thickness of the bronchial smooth muscle layer (bSML) in the Ctrl-group and in the pHAmouse-group at P70; (F) ratio of thickness of the bSML and bronchial wall thickness; (G) diameter of the lumen of the bronchi. Only bronchi with 100–200 μm diameter were used for assessment of bSML and bronchial wall thickness. pHAmousegroup (n = 6 from 4 litterss): white bar; Ctrl (n = 6 from 5 litterss): black bar. Mean ± SEM; Mann Whitney test. *p < 0.05, **p < 0.01; n.s. = not significant.

References

    1. Ogden C. L. et al. Prevalence of overweight and obesity in the United States, 1999–2004. JAMA 295, 1549–1555, doi: 10.1001/jama.295.13.1549 (2006). - DOI - PubMed
    1. Ogden C. L., Carroll M. D., Kit B. K. & Flegal K. M. Prevalence of obesity and trends in body mass index among US children and adolescents, 1999-2010. JAMA 307, 483–490, doi: 10.1001/jama.2012.40 (2012). - DOI - PMC - PubMed
    1. Rother E. et al. Hypothalamic JNK1 and IKKbeta activation and impaired early postnatal glucose metabolism after maternal perinatal high-fat feeding. Endocrinology 153, 770–781, doi: 10.1210/en.2011-1589 (2012). - DOI - PubMed
    1. Sonnenschein-van der Voort A. M. et al. Fetal and infant growth and asthma symptoms in preschool children: the Generation R Study. Am J Respir Crit Care Med 185, 731–737, doi: 10.1164/rccm.201107-1266OC (2012). - DOI - PubMed
    1. Black M. H., Smith N., Porter A. H., Jacobsen S. J. & Koebnick C. Higher prevalence of obesity among children with asthma. Obesity (Silver Spring) 20, 1041–1047, doi: 10.1038/oby.2012.5o (2012). - DOI - PMC - PubMed

Publication types

MeSH terms