. 2016:2016:4131395.
doi: 10.1155/2016/4131395. Epub 2015 Dec 27.

The Gate Theory of Pain Revisited: Modeling Different Pain Conditions with a Parsimonious Neurocomputational Model

Affiliations

The Gate Theory of Pain Revisited: Modeling Different Pain Conditions with a Parsimonious Neurocomputational Model

Francisco Javier Ropero Peláez et al. Neural Plast. 2016.

Abstract

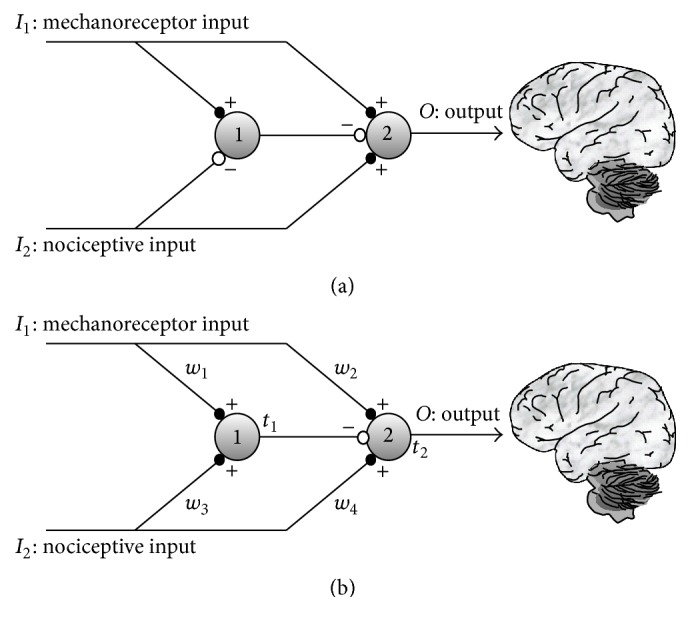
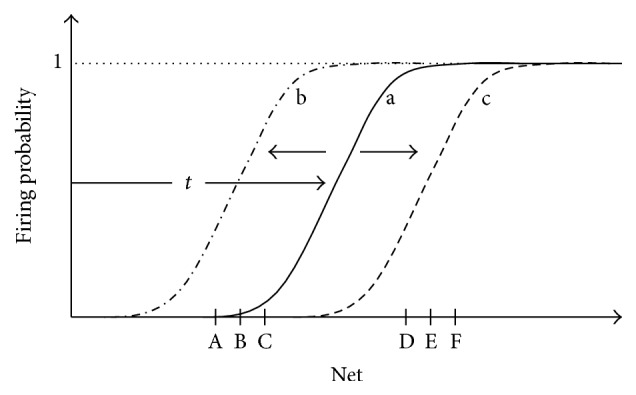
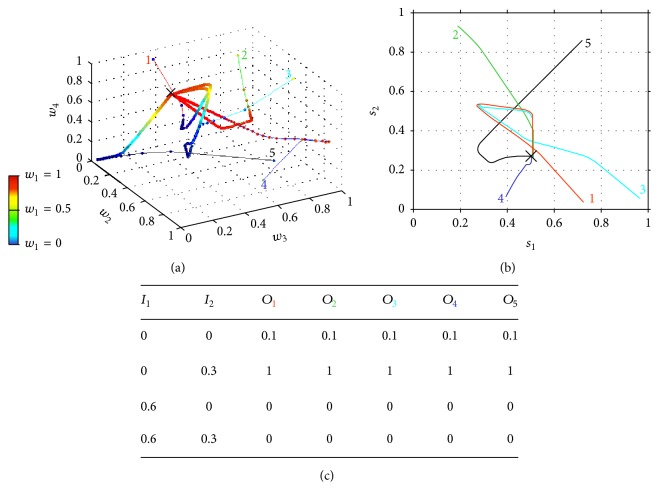
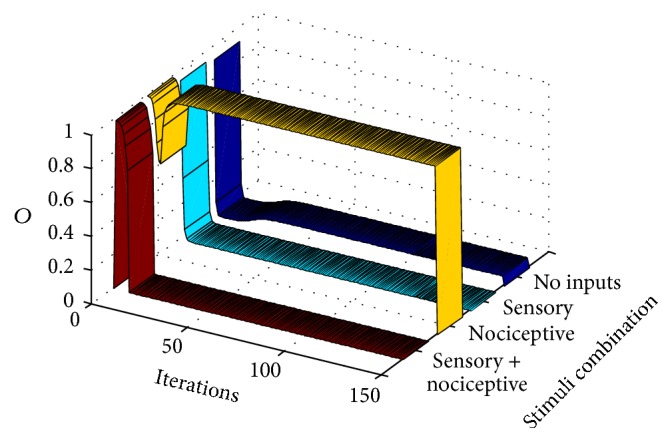
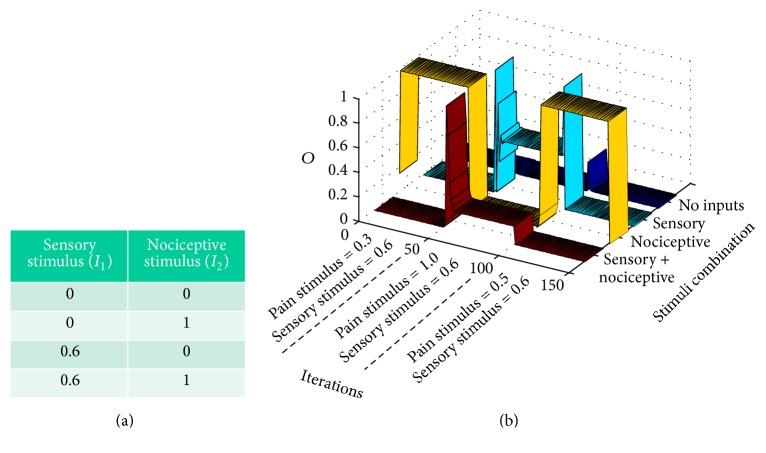
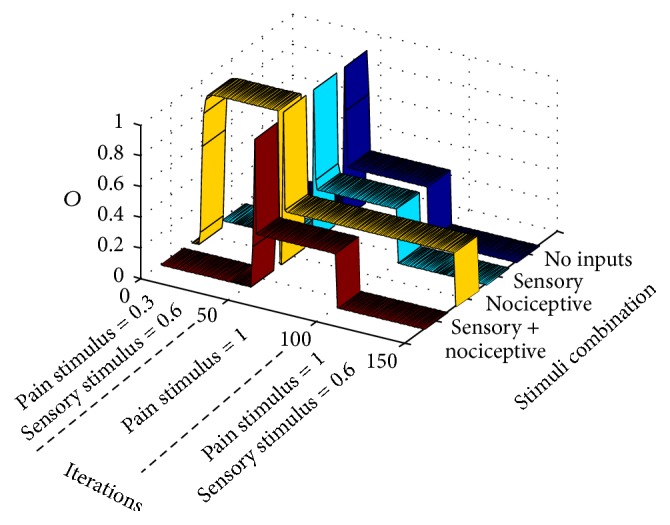
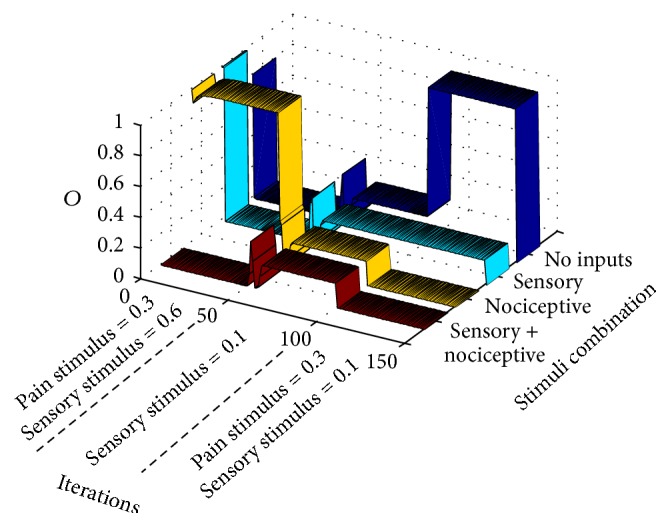
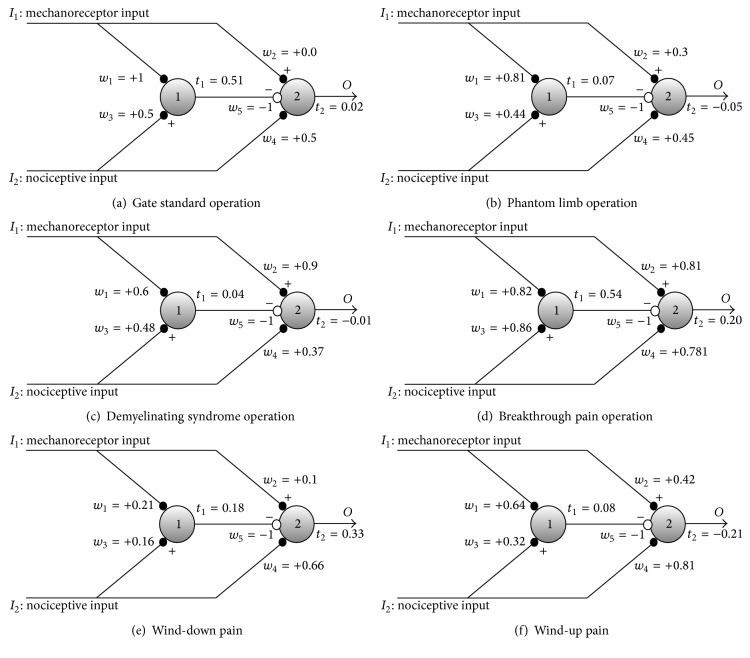
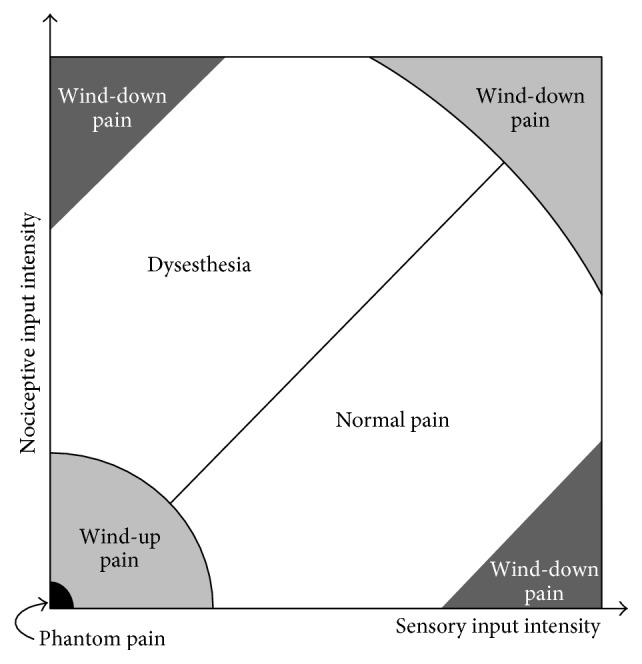
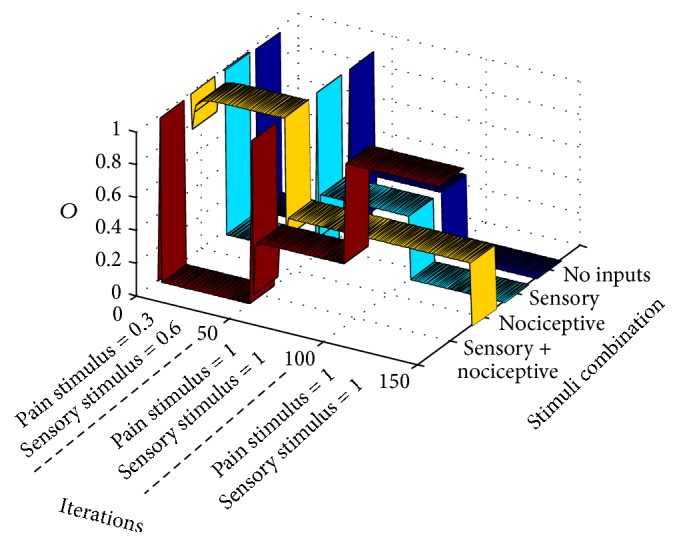
The gate control theory of pain proposed by Melzack and Wall in 1965 is revisited through two mechanisms of neuronal regulation: NMDA synaptic plasticity and intrinsic plasticity. The Melzack and Wall circuit was slightly modified by using strictly excitatory nociceptive afferents (in the original arrangement, nociceptive afferents were considered excitatory when they project to central transmission neurons and inhibitory when projecting to substantia gelatinosa). The results of our neurocomputational model are consistent with biological ones in that nociceptive signals are blocked on their way to the brain every time a tactile stimulus is given at the same locus where the pain was produced. In the computational model, the whole set of parameters, independently of their initialization, always converge to the correct values to allow the correct computation of the circuit. To test the model, other painful conditions were analyzed: phantom limb pain, wind-up and wind-down pain, breakthrough pain, and demyelinating syndromes like Guillain-Barré and multiple sclerosis.


Figures

Figure 1
Figure 1
(a) The gate control mechanism proposed by Melzack and Wall in 1965. Both nociceptive and mechanoreceptors signals are projected to neurons in the substantia gelatinosa, represented by neuron 1, and towards the first central transmission neurons, represented by neuron 2. Mechanoreceptor signals are more intense (higher transmission rate) than nociceptive signals. Nociceptive signals inhibit neuron 1 (white dotted connection in figure) and, at the same time, produce excitation on neuron 2. (b) Current proposal: all nociceptive and mechanoreceptor axon terminals are excitatory. Synaptic weights (w i) change according to NMDA plasticity. Firing thresholds, t 1 and t 2, of neurons 1 and 2 also vary according to intrinsic plasticity.
Figure 2
Figure 2
Intrinsic plasticity is the property of real neurons that allows the neuron's sigmoidal activation function to shift either leftwards or rightwards, so that the sigmoid is placed over intervals corresponding to the average net input of the neuron. (a) Initial position of the sigmoidal activation function. (b) If the values of net inputs of the neuron are low (as in case of inputs A, B, and C), the activation function shifts leftwards. (c) If net input values are high (as in D, E, and F), the sigmoid gradually shifts rightwards.
Figure 3
Figure 3
Evolution of gate circuit parameters when considering both intrinsic and synaptic plasticity. Five program simulations (5 thin colored lines) are depicted, starting with different initial weights and shifts. (a) Evolution of weights: each coordinate (w 2, w 3, w 4) represents the set of synaptic weights in each iteration, with the color of the point representing the value of weight w 1. Along iterations, all lines converge to the same coordinate (w 1, w 2, w 3, w 4) = (1, 0, 0.5, 0.5). (b) After 5000 iterations, the shift parameters of the activation function of the SG neuron (s 1) and of the T neuron (s 2) also converge to a certain point (0.5, 0.27). (c) With the final set of weights and shift parameters, the probability of a CT neuron's firing is given by the table being I 1 the mechanoreceptor input probability and I 2 the nociceptive input probability.
Figure 4
Figure 4
This graph shows the output, O, of the CT neuron in the gate circuit along computer iterations. It shows that the circuit quickly adapts, for eliciting standard gate outputs when standard pain and sensory signal are input to the circuit (a standard training epoch is given to the circuit in each iteration). Each ribbon represents the output of the circuit when a certain combination of inputs is introduced as input to the circuit. The dark blue ribbon yields the output (the CT neuron action potential probability) when no inputs are introduced. Cyan, yellow, and red ribbons yield the CT neuron output under conditions in which only sensory, nociceptive, or both inputs are, respectively, input to the gate circuit.
Figure 5
Figure 5
Evolution of gate circuit parameters with only intrinsic plasticity. (a) Evolution of the shift parameters of neurons 1 (SG) and 2 (CT) in five different simulations (different line colors). Crosses represent the values of shift parameters at the last iteration. (b) Truth table after each one of the simulations. Colors in the indexes refer to the same color curves in (a).
Figure 6
Figure 6
Evolution of gate circuit parameters with only synaptic plasticity. (a) Five computer simulations (five colors of narrow lines) representing synaptic weights evolution during 5000 iterations, once the shifts of activation functions are fixed. Because there are four weights and we have a 3D coordinates system, one of the coordinates, w 1, is measured by a scale of colors ranging from 0 to 1. A cross indicates last iteration. (b) Truth table for each one of the simulations.
Figure 7
Figure 7
Modeling phantom limb pain: after presenting a standard training epoch to the gate model during 50 iterations, (a) a null training epoch is input to the gate along 50 more iterations in order to model the period after amputation. (b and c) After 100 iterations, very weak input signals are input to the gate model. Graphs correspond to two stability points. Both graphs show that pain signals are emitted from CT neurons in a situation in which there are no inputs to the gate in a condition known as dysesthesia (blue ribbon). Graph (b) shows a situation of a setpoint in which weak nociceptive inputs elicit a pain signal from CT neurons (yellow ribbon).
Figure 8
Figure 8
Modeling demyelinating syndromes: after 50 iterations with standard training epochs, signals from sensory receptors are weakened like in a demyelinating syndrome. Abnormal pain sensations only take place from iteration 100 with pain sensations when a sensory signal is input to the gate (dysesthesia).
Figure 9
Figure 9
Modeling breakthrough pain: after 50 iterations with standard training epochs, an intense nociceptive stimulus is input to the gate. Initially, wind-down pain (yellow ribbon) takes place concomitantly with a mild episode of dysesthesia (cyan ribbon). After a period in which pain seems to be relieved, pain is again installed as in breakthrough pain.
Figure 10
Figure 10
Modeling wind-down pain: after 50 iterations of standard training epochs, signals from nociceptive receptors become very intense. From iterations 50 to 100, the gate circuit, instead of receiving different stimuli like in previous cases, receives an intense nociceptive stimulus of value 1. For testing pain responses to other types of stimuli during the phase of intense nociceptive stimulation, all types of plasticity (synaptic and intrinsic) are blocked from iterations 100 to 150 (this procedure was not done in previous examples). As seen, after a long intense pain stimulation, the circuit becomes less responsive to all types of stimuli.
Figure 11
Figure 11
Modeling wind-up pain. After 50 iterations with standard training epochs, signals from mechanoreceptors become weak but repetitive, without any other type of stimulation. This situation is modeled from iterations 50 to 100 in which the gate circuit, instead of receiving different stimuli like in previous cases, only receives a repetitive weak sensory stimulus. For understanding pain responses to other types of stimuli during the phase of repetitive weak sensory stimulation, all types of plasticity (synaptic and intrinsic) are blocked from iterations 100 to 150 (as done in previous example). As can be seen, after a prolonged weak sensory stimulation, the circuit relays a pain output in the case of no stimulation (between periods of weak sensory stimulation).
Figure 12
Figure 12
Synaptic weights and firing threshold values when the gate circuit arrives to stability for the different cases previously explained. When placing the different type of inputs in the gate circuit, neuron 2 response is according to the type of response expected in each case. In the case of graph (b), we considered the parameters of gate circuit that only produces phantom pain when no inputs at all enter the gate (see Figure 7(c)).
Figure 13
Figure 13
Different pain conditions for the different combinations of sensory and mechanoreceptor inputs according to the results of the gate circuit computer model. When the sensory input intensity (normalized firing rate) is higher than the nociceptive input intensity (below the diagonal), the circuit behaves in a “normal pain” mode. Above the diagonal, nociceptive input intensity is higher than the sensory input intensity. In this condition, the parameters of the gate circuit evolve so that pain is triggered in abnormal situations generating dysesthesia. When sensory and/or nociceptive inputs are very low, the gate circuit parameters evolve to produce wind-up pain. Phantom pain is included in this case as an extreme situation. Finally, when either nociceptive or mechanoreceptor stimulus is extremely high, wind-down pain is produced (see Figure 14).
Figure 14
Figure 14
Modelling the hypothetical situation where, after a period of standard stimulation, gate circuit inputs are both very intense as from iteration 50 to iteration 100. After iteration 100, the four different combinations of nociceptive/sensory inputs are presented to the circuit. In the present case, as in Figures 10 and 11 cases, plasticity is blocked from iterations 100 to 150, in order to analyze the response of the circuit. As can be noticed, pain response is only intense when both sensory and nociceptive inputs are intense and are simultaneously applied. When only a nociceptive intense input is applied, the pain response is moderate. No pain response is obtained in the remaining cases.

References

    1. Melzack R., Wall P. D. Pain mechanisms: a new theory. Science. 1965;150(3699):971–979. doi: 10.1126/science.150.3699.971. - DOI - PubMed
    1. Wall P. D. The gate control theory of pain mechanisms. A re-examination and re-statement. Brain. 1978;101(1):1–18. doi: 10.1093/brain/101.1.1. - DOI - PubMed
    1. Nathan P. W., Rudge P. Testing the gate-control theory of pain in man. Journal of Neurology, Neurosurgery and Psychiatry. 1974;37(12):1366–1372. doi: 10.1136/jnnp.37.12.1366. - DOI - PMC - PubMed
    1. Nathan P. W. The gate control theory of pain: a critical review. Brain. 1976;99(1):123–158. doi: 10.1093/brain/99.1.123. - DOI - PubMed
    1. Desai N. S., Rutherford L. C., Turrigiano G. G. Plasticity in the intrinsic excitability of cortical pyramidal neurons. Nature Neuroscience. 1999;2(6):515–520. doi: 10.1038/9165. - DOI - PubMed

LinkOut - more resources