. 2016 Jul;15(7):782-791.
doi: 10.1038/nmat4624. Epub 2016 Apr 18.

Bioresorbable silicon electronics for transient spatiotemporal mapping of electrical activity from the cerebral cortex

Affiliations

Bioresorbable silicon electronics for transient spatiotemporal mapping of electrical activity from the cerebral cortex

Ki Jun Yu et al. Nat Mater. 2016 Jul.

Abstract

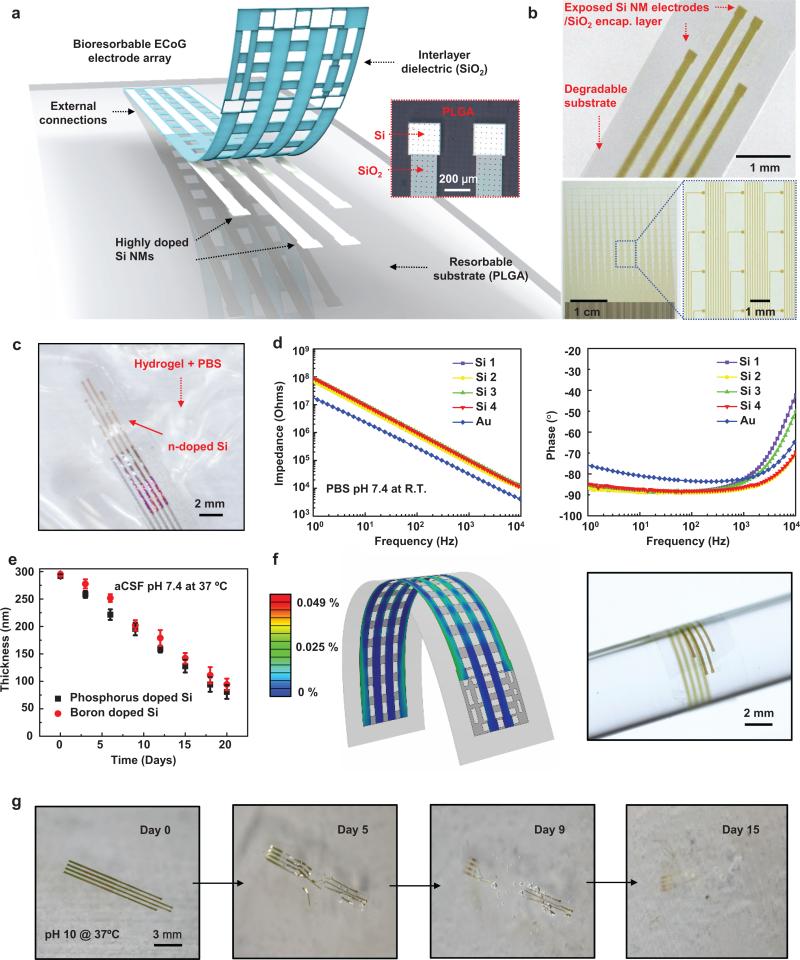
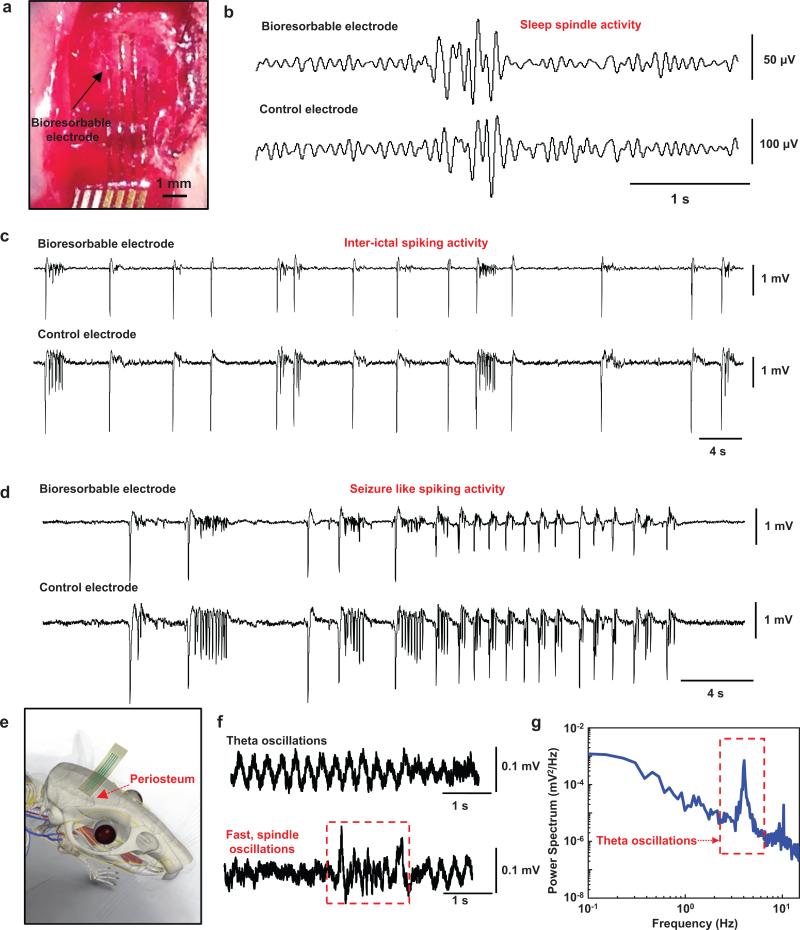
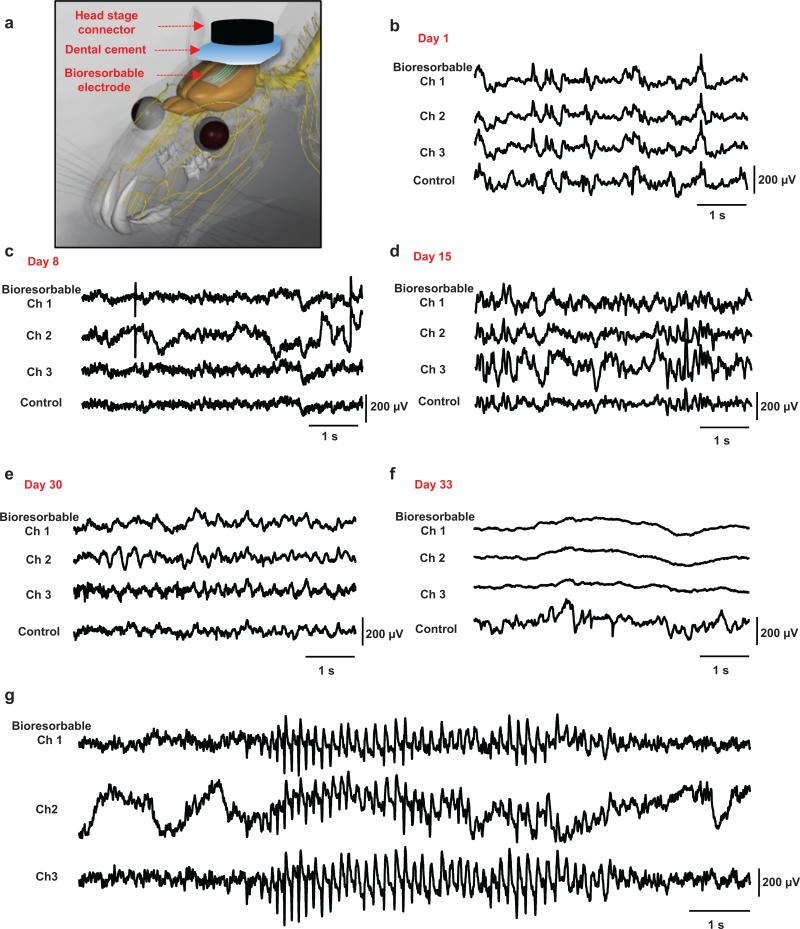
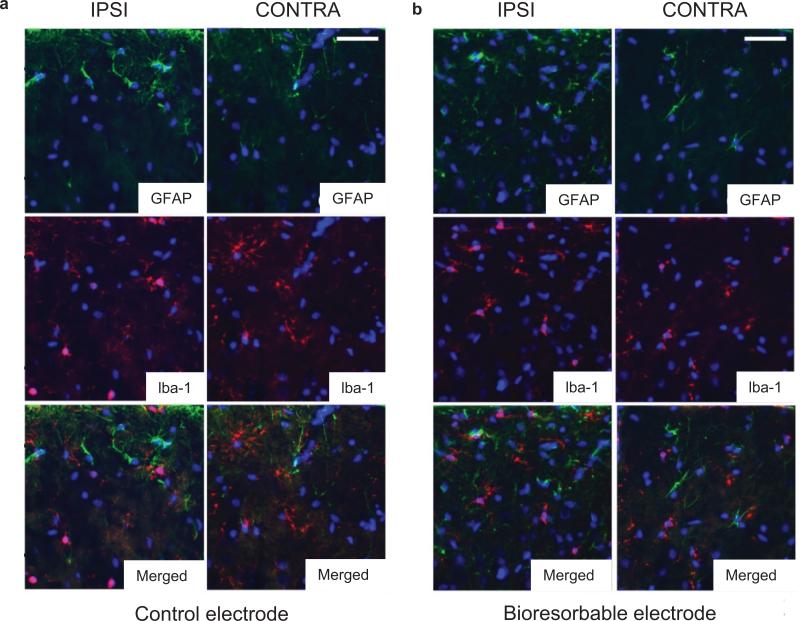
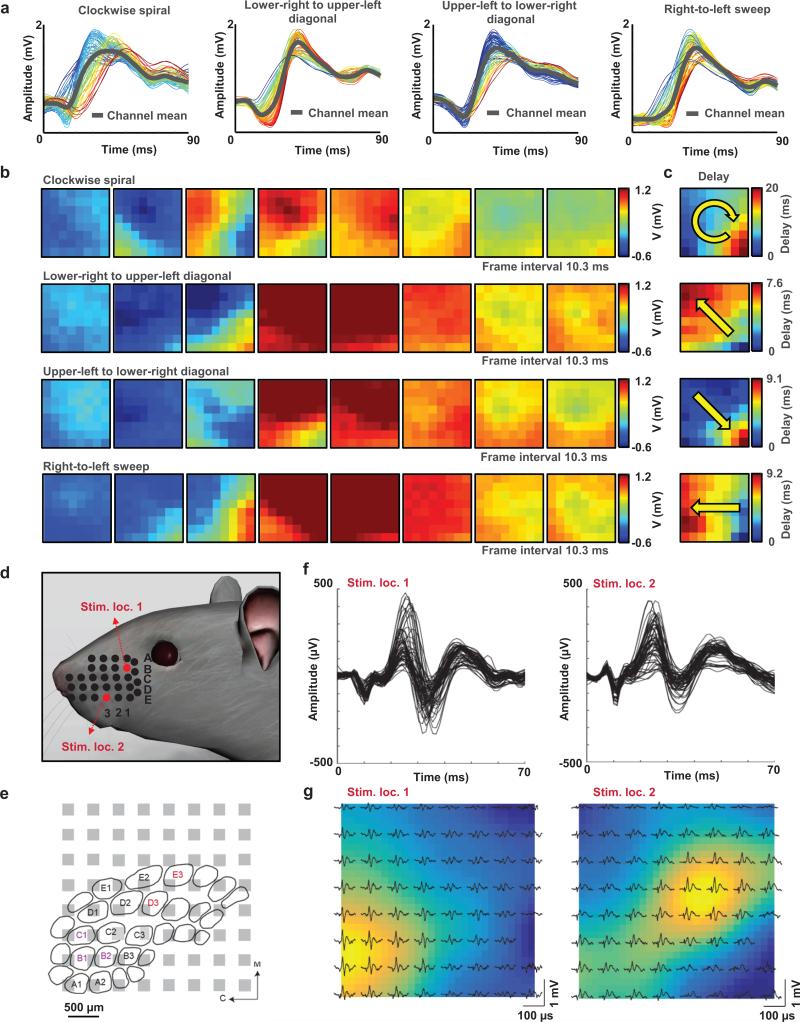
Bioresorbable silicon electronics technology offers unprecedented opportunities to deploy advanced implantable monitoring systems that eliminate risks, cost and discomfort associated with surgical extraction. Applications include postoperative monitoring and transient physiologic recording after percutaneous or minimally invasive placement of vascular, cardiac, orthopaedic, neural or other devices. We present an embodiment of these materials in both passive and actively addressed arrays of bioresorbable silicon electrodes with multiplexing capabilities, which record in vivo electrophysiological signals from the cortical surface and the subgaleal space. The devices detect normal physiologic and epileptiform activity, both in acute and chronic recordings. Comparative studies show sensor performance comparable to standard clinical systems and reduced tissue reactivity relative to conventional clinical electrocorticography (ECoG) electrodes. This technology offers general applicability in neural interfaces, with additional potential utility in treatment of disorders where transient monitoring and modulation of physiologic function, implant integrity and tissue recovery or regeneration are required.


Figures

Figure 1
Figure 1. Thin, flexible neural electrode arrays with fully bioresorbable construction based on patterned silicon nanomembranes (Si NMs) as the conducting component
a, Schematic exploded view illustration of the construction of a passive, bioresorbable neural electrode arrays for ECoG and sub-dermal EEG measurements. A photolithographically patterned, n-doped Si NMs (~300 nm thick) defines the electrodes and interconnects. A film of SiO2 (~100 nm thick) and a foil of PLGA (~30 μm thick) serves as a bioresorbable encapsulating layer and substrate, respectively. The device connects to an external data acquisition (DAQ) system through an anisotropic conductive film interfaced to the Si NMs interconnects at contact pads at the edge. A magnified optical image of electrodes on the right highlights the sensing (Si NMs) and insulating (SiO2) regions. b, Photographs of bioresorbable neural electrode arrays with 4 channels (top) and 256 (16 × 16 configuration) channels (bottom). c, Microscope image of a device on a hydrogel substrate immersed in an aqueous buffer solution (pH 7.4) at 37 °C. d, Electrochemical impedance spectra measured at four different recording sites in an array configured for ECoG. e, Dissolution kinetics for phosphorus and boron doped Si NMs (~300 nm thick, dopant concentration 1020 /cm3) during immersion in artificial cerebrospinal fluid (aCSF) pH 7.4 at 37 °C. f, Distribution of principal strains extracted from finite-element modeling (FEM) of a device bent to a radius of curvature of 1 mm (center) and corresponding displacement profile (left) and image of an array wrapped around a cylindrical tube with a radius of 2 mm (right). g, Images collected at several stages of accelerated dissolution induced by immersion in an aqueous buffer solution (pH 10) at 37 °C.
Figure 2
Figure 2. In vivo neural recordings in rats using a passive, bioresorbable electrode array
The data presented here are representative of three separate acute experiments, each with a duration of ~5-6 hours. a, Photograph of four-channel bioresorbable electrode array placed on the cortical surface of the left hemisphere of a rat. b, Sleep spindles recoded by a bioresorbable electrode and a nearby commercial stainless steel microwire electrode, as a control placed at 0.5 mm depth from the cortical surface. c, Interictal spiking activity captured by the bioresorbable electrode and the control electrode after topical application of bicuculine methodide. Both electrodes interface with the same hemisphere. Data were processed through a 0.1 Hz-5 kHz bandpass filter. Recordings by the bioresorbable electrode and the control electrode show consistent interictal spikes. d, Interictal spiking activity recorded by the bioresorbable electrode and the control electrode 30 minutes after topical application of bicuculine methodide. Both recordings exhibit high signal-to-noise ratio (Si: 42, Control electrodes: 32) for detecting epileptiform activity. e, Cartoon illustration of a bioresorbable array placed on the periosteum for subdermal EEG recordings. f, Theta oscillations and fast spindle-like oscillations recorded subdermally using bioresorbable electrodes during isoflurane anesthesia. g, Power density spectra of the theta oscillations recorded over a 5 min time window. The spectrum shows a clear peak at the expected frequency range.
Figure 3
Figure 3. In vivo chronic recordings in rats using a passive, bioresorbable electrode array
The data presented here is representative of chronic recording experiments with a duration of 30 days. a, Photograph of a four-channel bioresorbable electrode array implanted on left hemisphere of the brain of a rat, for chronic recordings, with a coating gelfoam and a layer of dental cement. The array connects to a custom-built circular interface board through a flexible ACF cable. The inset shows the array and craniaotomy after application of a first layer of dental cement. b-f, Representative ECoG signals recorded by the bioresorbable array and the control electrode on day 1, 8, 15, 30 and 33. Recordings from three electrodes from the bioresorbable array exhibit large scale oscillatory behavior consistent with small local and temporal variations. After functional dissolution (Day 33), signals from the bioresorbable array show no ECoG activity while the control electrode continues to show expected cortical potentials. g, High voltage rhythmic spikes observed during absence-like seizure activity recorded chronically.
Figure 4
Figure 4. Immunohistology analysis
Double labeling for astrocytic marker GFAP (green) and microglia/macrophages marker Iba-1 (red) demonstrates moderate subpial gliosis at the implantation sites of both control (a, upper left panels) and bioresorbable (b, upper right panels) electrodes and a marked increase in the densities of activated round microglial cells, exclusively underneath the control electrodes (middle left panels). Cell nuclei are visualized with DAPI stain (blue). Scale bars represent 30 μm.
Figure 5
Figure 5. Bioresorbable actively multiplexed neural electrode array
a, Schematic exploded view illustration of an actively multiplexed sensing system for high resolution ECoG, in a fully bioresorbable construction. This 8 × 8 embodiment includes 128 metal-oxide-semiconductor field-effect transistors (MOSFETs) where Si NMs serve as both the active semiconductor material and the neural interface electrodes. The metallization, the gate dielectric and the interlayer dielectric rely on thin films of Mo (~300 nm thick) and SiO2 (~100 nm thick) and trilayers of SiO2 (~300 nm thick) / Si3N4 (~400 nm thick) /SiO2 (~300 nm thick), respectively. A second layer of Mo (~300 nm thick) defines column interface lines. A similar trilayer serves as the encapsulation. A film of poly(lactide-co-glycolide) (PLGA, ~30 μm thick) forms the substrate. b, Optical micrograph images of a pair of unit cells at various stages of fabrication (left) and a picture of a complete system (right). c, The left frame shows linear (red) and log scale (blue) transfer curves for a representative n-channel MOSFET, for Vg swept from −5 to +5 V. The channel length (Lch), and width (W) are 15 μm and 80 μm, respectively. The threshold voltage, mobility and on/off ratio are ~1 V, ~400 cm2/V·s and ~108, respectively, with Mo for source, drain and gate electrodes, and SiO2 for gate dielectrics. The right frame shows current-voltage characteristics, for Vg from 0 to 2.5 V with 0.5 V steps. d, Output response of a unit cell with respect to an input sine wave (200 mV peak to peak) upon insertion in aqueous phosphate buffer solution (PBS, pH 7.4) at room temperature. e, Images collected at several stages of accelerated dissolution of a system immersed into an aqueous buffer solution (pH 12) at 37 °C.
Figure 6
Figure 6. Acute in vivo microscale electrocortigoraphy (μECoG) with a 64-channel, bioresorbable, actively multiplexed array of measurement electrodes
a, Data recorded from picrotoxin-induced spikes (clockwise spiral, lower-right to upper-left diagonal, upper-left to lower-right diagonal, and right-to-left sweep). The results correspond to measurements across the 64 channels of the array, and the average response (grey) from all channels. The waveforms are color-coded according to the relative latency of the spike maximum (blue is earliest, red is latest). b, Movie frames corresponding to each spike pattern, showing the varied spatial-temporal μECoG voltage patterns from all 64 electrodes at the labeled time. Blue indicates negative, and dark red indicates the highest peak-to-peak voltage observed for each electrode site. The frame interval and color scale are provided for each set of eight movie frames. c, Relative delay map for the band-pass filtered data of each spike activity from frame b, illustrating a clear phase singularity indicated by arrow. d, Illustration of the whisker stimulation locations (Stim. loc.: B1 and Stim. loc.: E3) in a rat model. e, Illustration of the barrel cortex and estimated relative location of the recording array based on evoked potential results. Visibly-activated whiskers indicated by color corresponding to the stimulation location. M = medial, C = caudal. f, Temporal characteristics of the potentials evoked by stimulation location 1 (left) and 2 (right). g,Spatial distribution of the potentials evoked by stimulation location 1 and 2. The color map indicates the evoked potential size, interpolated across the array.

References

    1. Niedermeyer E, da Silva FL. Electroencephalography: basic principles, clinical applications, and related fields. Lippincott Williams & Wilkins; 2005.
    1. Stacey WC, Litt B. Technology insight: neuroengineering and epilepsy— designing devices for seizure control. Nat. Clin. Pract. Neurol. 2008;4:190–201. - PMC - PubMed
    1. McKhann GM, Schoenfeld-McNeill J, Born DE, Haglund MM, Ojemann GA. Intraoperative hippocampal electrocorticography to predict the extent of hippocampal resection in temporal lobe epilepsy surgery. Journal of neurosurgery. 2000;93:44–52. - PubMed
    1. Whitmer D, et al. High frequency deep brain stimulation attenuates subthalamic and cortical rhythms in Parkinson's disease. Frontiers in human neuroscience. 2012;6 - PMC - PubMed
    1. Litt B, et al. Epileptic seizures may begin hours in advance of clinical onset: a report of five patients. Neuron. 2001;30:51–64. - PubMed

Publication types