. 2016 May 12;533(7602):200-5.
doi: 10.1038/nature17164. Epub 2016 Apr 18.

The Atlantic salmon genome provides insights into rediploidization

Affiliations

The Atlantic salmon genome provides insights into rediploidization

Sigbjørn Lien et al. Nature. .

Abstract

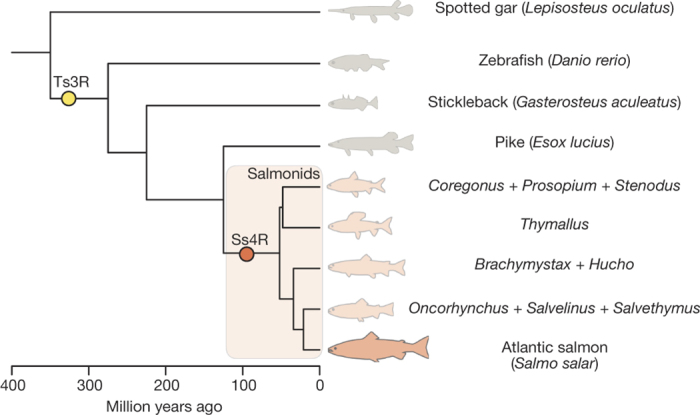
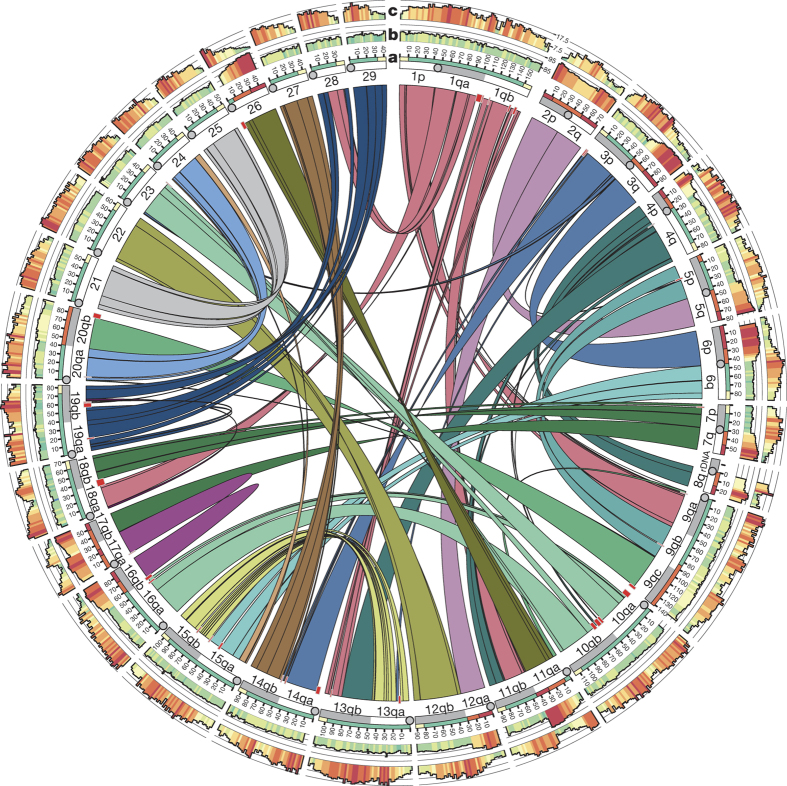
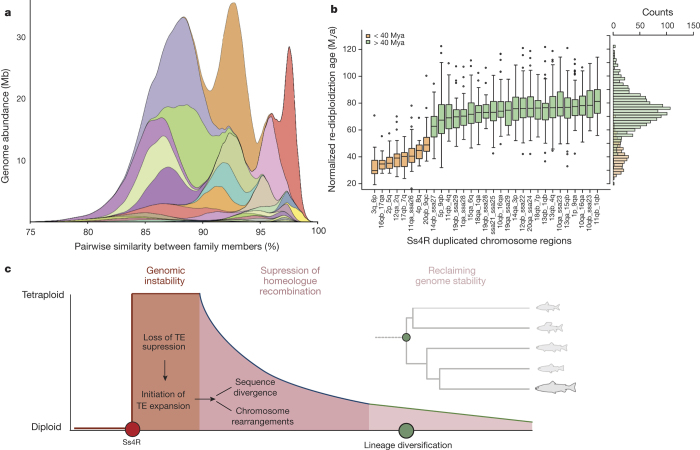
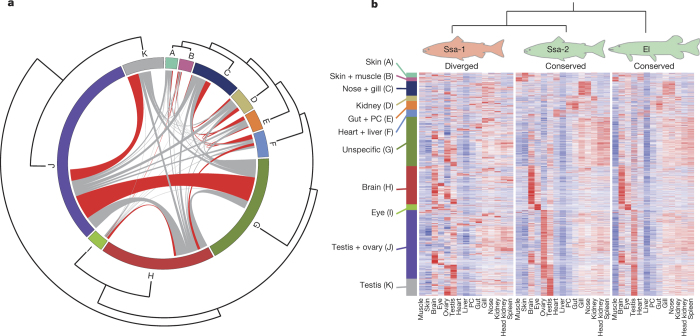
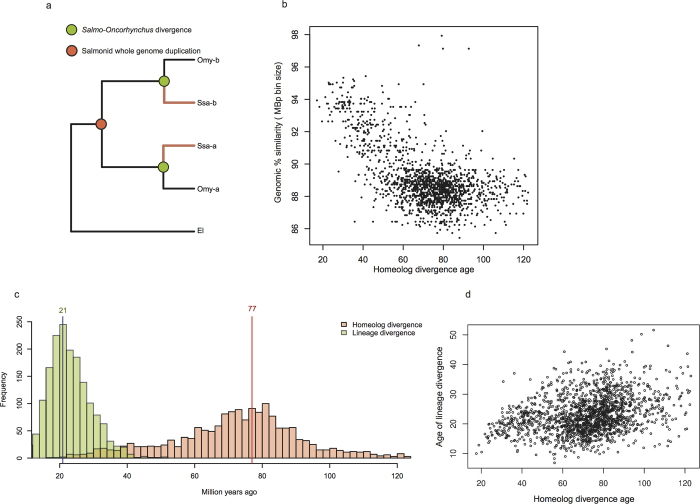
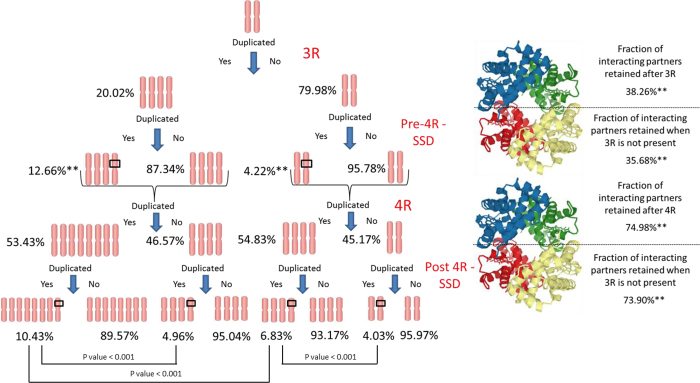
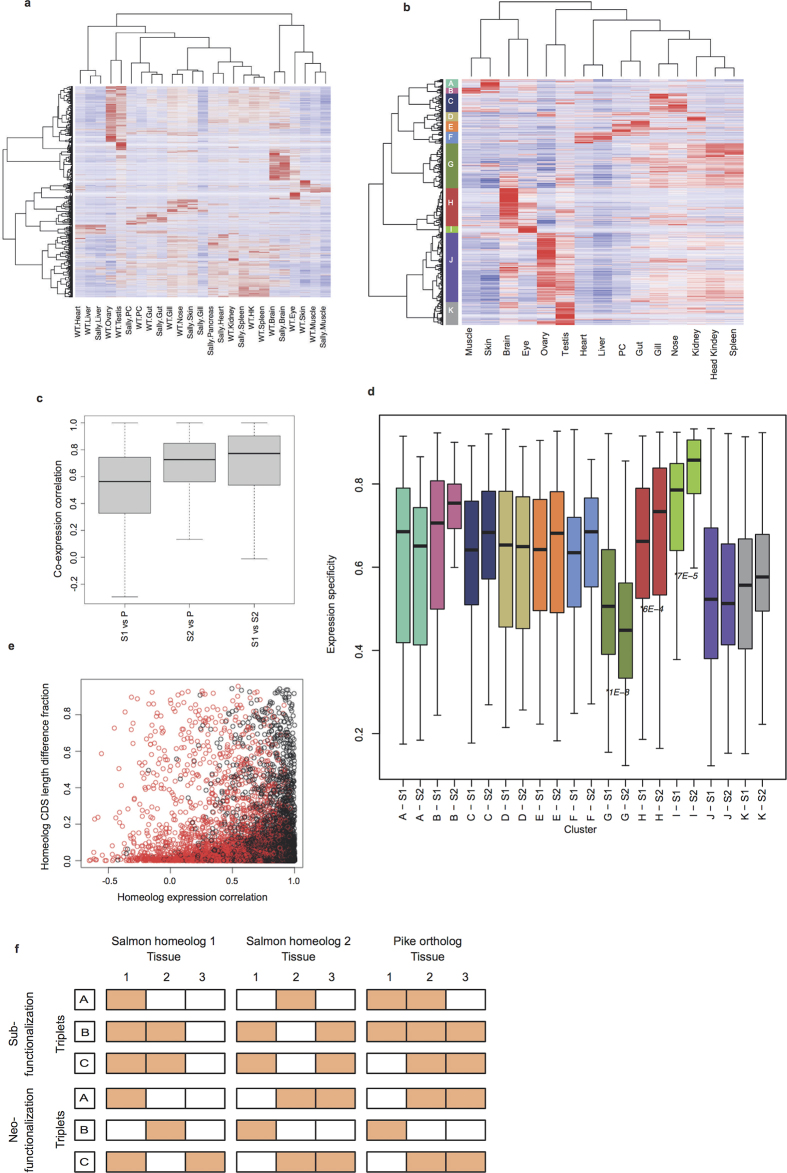
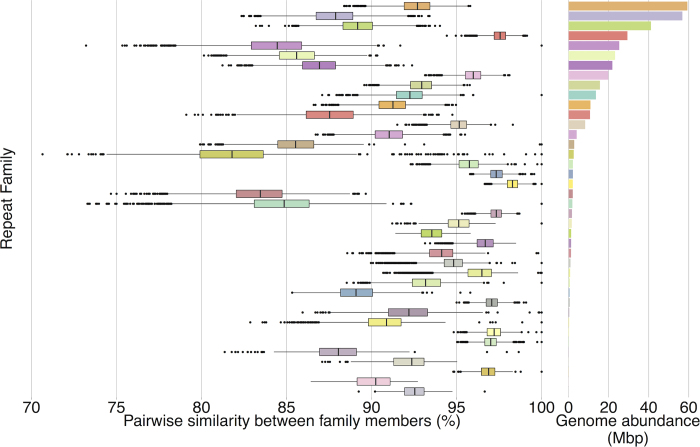
The whole-genome duplication 80 million years ago of the common ancestor of salmonids (salmonid-specific fourth vertebrate whole-genome duplication, Ss4R) provides unique opportunities to learn about the evolutionary fate of a duplicated vertebrate genome in 70 extant lineages. Here we present a high-quality genome assembly for Atlantic salmon (Salmo salar), and show that large genomic reorganizations, coinciding with bursts of transposon-mediated repeat expansions, were crucial for the post-Ss4R rediploidization process. Comparisons of duplicate gene expression patterns across a wide range of tissues with orthologous genes from a pre-Ss4R outgroup unexpectedly demonstrate far more instances of neofunctionalization than subfunctionalization. Surprisingly, we find that genes that were retained as duplicates after the teleost-specific whole-genome duplication 320 million years ago were not more likely to be retained after the Ss4R, and that the duplicate retention was not influenced to a great extent by the nature of the predicted protein interactions of the gene products. Finally, we demonstrate that the Atlantic salmon assembly can serve as a reference sequence for the study of other salmonids for a range of purposes.


Conflict of interest statement

The authors declare no competing financial interests.

Figures

Figure 1
Figure 1. Phylogenetic relationship of salmonids and relevant teleost lineages.
Divergence ages for salmonids are taken from ref. and older divergences from ref. . Parahucho is not included in the figure due to uncertainty of its phylogenetic position. Ages do not represent the exact point estimates from the respective studies. Yellow and red circles represent the teleost specific whole genome duplication (Ts3R) and salmonid-specific whole genome duplication (Ss4R), respectively. PowerPoint slide
Figure 2
Figure 2. The duplicated Atlantic salmon genome.
Homeologous regions in the Atlantic salmon genome subdivided into 98 collinear blocks along the 29 European Atlantic salmon chromosomes. Red rectangles represent blocks of sequence without identifiable duplicated regions elsewhere in the genome. a, This track shows grouping of salmon sequence into regions; red = high (>95% sequence similarity), orange = elevated (90–95% sequence similarity), green = low (~87% sequence similarity), yellow = telomeric regions (10 Mb) characterized by highly elevated male recombination (see ref. 10). b, This track shows genomic similarity (in 1 Mb intervals) between duplicated regions (red = high, yellow = medium, green = low sequence similarity). c, Ths track shows frequency of Tc1-mariner transposon elements in the Atlantic salmon genome. PowerPoint slide
Figure 3
Figure 3. Post-Ss4R rediploidization.
a, Fig. 3a shows a significant and ongoing expansion of transposable elements from the Tc1-mariner superfamily with major peaks at an average of 87%, 93% and 98% similarity between family members. The colours correspond to the same colours as in the box plot in Extended Data Fig. 5. b, Age estimates of the time from homeologue divergence to Salmo–Oncorhynchus divergence for each individual homeologous region. Only chromosome regions with >10 gene trees were included. c, A three-step hypothetical model of post-Ss4R rediploidization (widths of model compartments do not reflect actual time scales). The green circle indicates the beginning of the salmonid radiation. PowerPoint slide
Figure 4
Figure 4. Homeologue divergence.
a, Circos plot distribution of homeologous gene pairs and their assignment to 11 co-expression clusters based on 15 different tissues. Lines connect Ss4R pairs that belong to different co-expression clusters. For visualization purposes, we sorted the Ss4R pairs according to type of co-expression divergence. Red lines signify significant resampling tests (P < 0.05) for enrichment of homeologue divergence between two specific co-expression clusters. b, Heatmap of 2,272 triplets (two salmon homeologues and a pike orthologue), in which one of the Atlantic salmon homeologues has diverged in gene expression regulation. PowerPoint slide
Extended Data Figure 1
Extended Data Figure 1. Atlantic salmon and rainbow trout comparative map.
Alignment of Atlantic salmon (Salmo salar) and rainbow trout (Oncorhynchus mykiss) chromosome sequences using LASTZ demonstrates conservation of large collinear syntenic blocks between the two species.
Extended Data Figure 2
Extended Data Figure 2. Dating or Ss4R rediploidization.
a, Schematic representation of a gene tree topology reflecting rediploidization of Ss4R homeologues before Salmo–Oncorhynchus divergence. b, Correlation between genomic similarity in 1 Mb windows and Ss4R rediploidization (that is, divergence) age. c, Distribution of Salmo–Oncorhynchus divergence age and Ss4R divergence age from time calibrated gene trees estimated with BEAST. Modes of each distribution are indicated with a vertical line. d, Correlation between estimated age of Salmo–Oncorhynchus divergence and Ss4R divergence age.
Extended Data Figure 3
Extended Data Figure 3. Duplication count analysis and interacting partner co-retention.
The duplication process is depicted with the associated conditional probabilities for each type of duplication based upon a sampling of gene families that includes Lepisosteus oculatus. WGD events occur at both the Ts3R and Ss4R levels with individual gene duplications occurring at Pre-Ss4R–SSD and Post-Ss4R–SSD. Pre-Ss4R conditional probabilities are only dependent on Ts3R WGD being present and Ss4R WGD are only conditional on a Ts3R WGD being present. Retained interacting partners were determined from the STRING database as partners with (binding) physical interaction. Interacting partners were determined based on being retained after the same Ts3R WGD or a Ss4R WGD as the query sequence and having a homologue in Danio rerio. Two asterisks indicate significance at α < 0.001 (Bonferroni corrected) based on a two-proportion pooled z-test from a binomial distribution.
Extended Data Figure 4
Extended Data Figure 4. Tissue gene expression regulation.
a, Hierarchical clustering of tissue gene expression in adult salmon from fresh water. WT = expression data from normal diploid Atlantic salmon. Sally = expression data from the double haploid fish used for reference genome sequencing. b, Classification of 11 co-expression clusters. Gene expression are from 15 tissues from a diploid adult Atlantic salmon from freshwater. Co-expression clusters are either associated with expression patterns from a single tissue or multiple tissues with similar physiological functions. Co-expression clusters A–K are named accordingly after the tissue(s) that contributes the most to its characteristic expression regulation profile: skin; skin and muscle; nose and gill; kidney; gut and pyloric ceca; heart and liver; unspecific; brain; eye; testis and ovary; testis. c, Gene expression correlation between salmon Ss4R homeologues and Northern pike orthologues. P = pike, S1 = salmon homeologue with lowest tissue expression correlation with pike, S2 = salmon homeologue with highest tissue expression correlation to. d, Tissue expression specificity. Tissue expression specificity of Ss4R homeologues with novel gene regulation (S1) and conserved gene regulation (S2) compared to pike. Gene co-expression clusters are denoted A–K (see description in figure legend for b). Significantly different tissue specificity between diverged (S1) and conserved (S2) homeologues are indicated with a P value in the figure. e, Relationship between CDS-length difference and Ss4R expression regulation divergence. CDS length divergence are calculated as a fraction of the longest CDS in each Ss4R pair. Red colour represents homeologue pairs that are in different co-expression clusters (see above sections a and b for details). f, Illustration of sub- and neofunctionalization as defined by the analyses of ‘on’ and ‘off’ expression patterns. Red colour indicates a gene being ‘on’ in one tissue compared to its Ss4R duplicate and the assumed ancestral state of the diploid pike outgroup.
Extended Data Figure 5
Extended Data Figure 5. Historical activity of 40 Tc1-mariner transposable elements and their abundance in the Atlantic salmon genome.
Families with increased pairwise similarity between members have experienced less neutral sequence divergence since they were rendered inactive and reflect more recent additions to the genome.

Comment in

References

    1. Nelson, J. S. Fishes of the World (John Wiley & Sons, 2006)
    1. Smith JJ, et al. Sequencing of the sea lamprey (Petromyzon marinus) genome provides insights into vertebrate evolution. Nature Genet. 2013;45:415–421. doi: 10.1038/ng.2568. - DOI - PMC - PubMed
    1. Jaillon O, et al. Genome duplication in the teleost fish Tetraodon nigroviridis reveals the early vertebrate proto-karyotype. Nature. 2004;431:946–957. doi: 10.1038/nature03025. - DOI - PubMed
    1. Kasahara M, et al. The medaka draft genome and insights into vertebrate genome evolution. Nature. 2007;447:714–719. doi: 10.1038/nature05846. - DOI - PubMed
    1. Nakatani Y, Takeda H, Kohara Y, Morishita S. Reconstruction of the vertebrate ancestral genome reveals dynamic genome reorganization in early vertebrates. Genome Res. 2007;17:1254–1265. doi: 10.1101/gr.6316407. - DOI - PMC - PubMed

Publication types

Substances