. 2016 May;34(5):539-46.
doi: 10.1038/nbt.3527. Epub 2016 Apr 18.

Characterizing genomic alterations in cancer by complementary functional associations

Affiliations

Characterizing genomic alterations in cancer by complementary functional associations

Jong Wook Kim et al. Nat Biotechnol. 2016 May.

Abstract

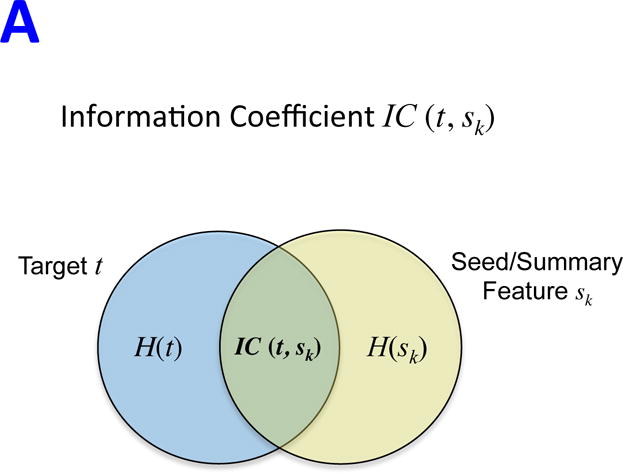
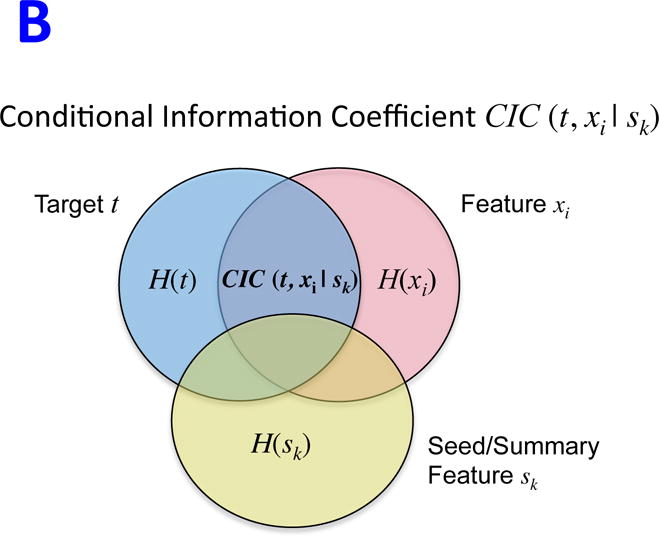
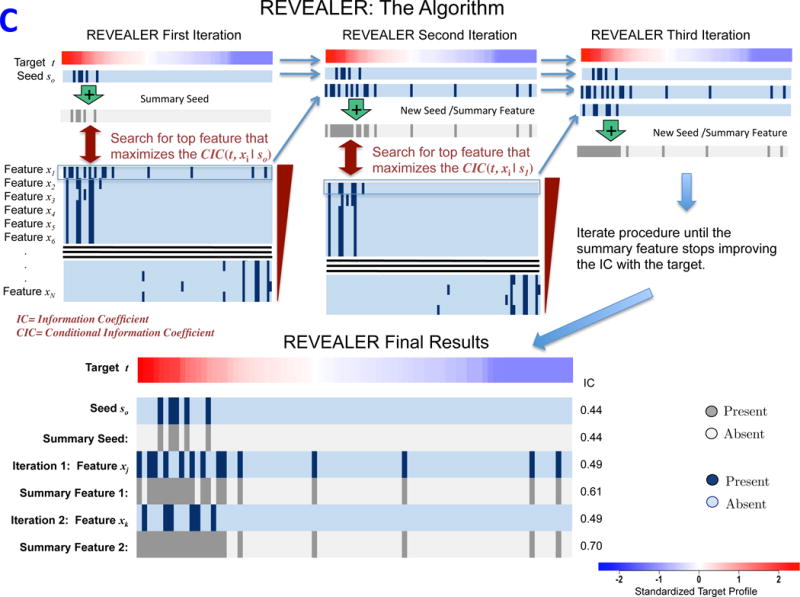
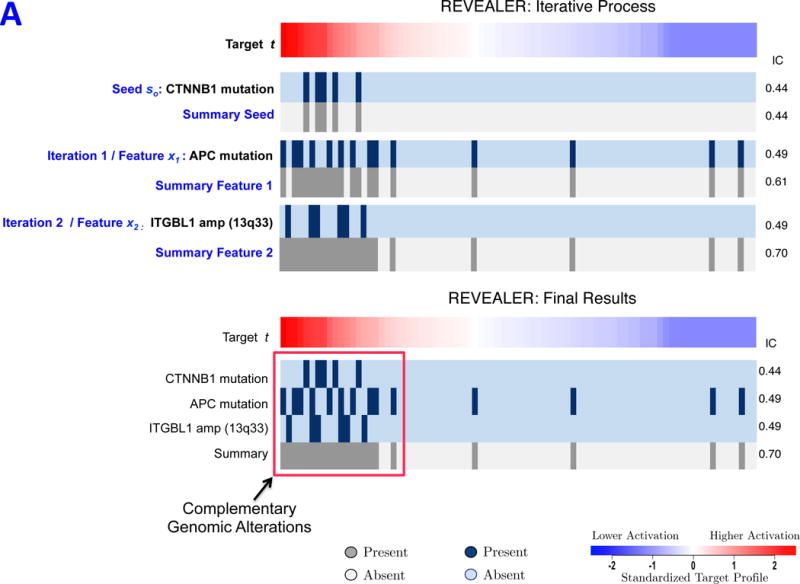
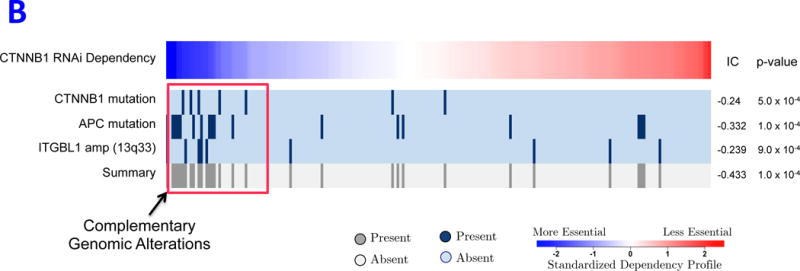
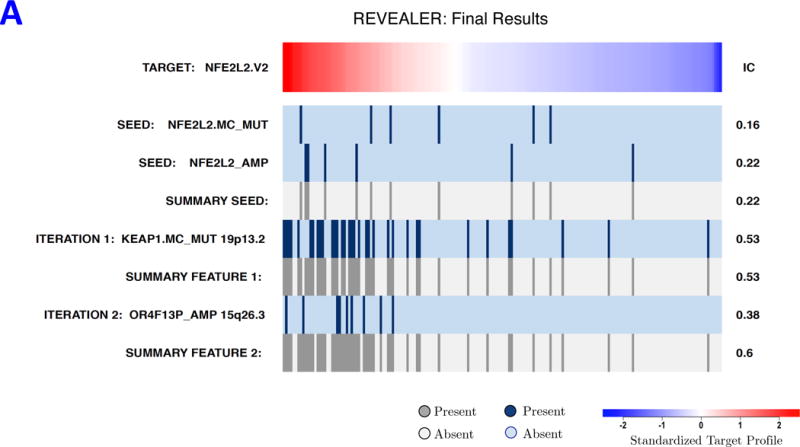
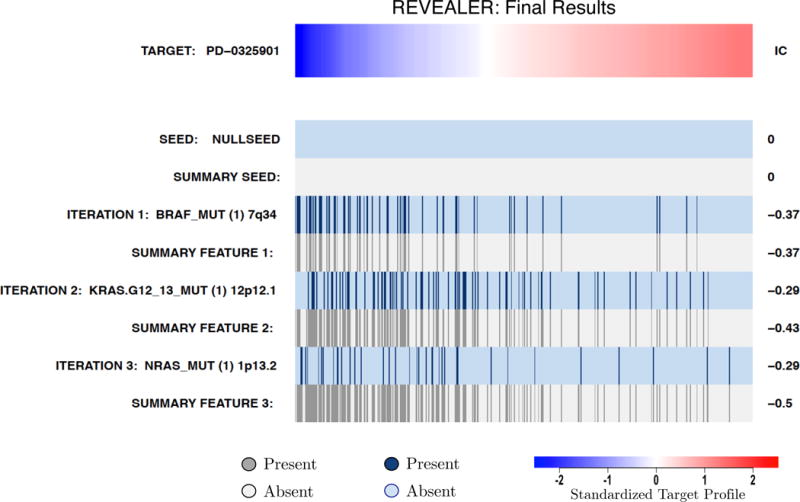
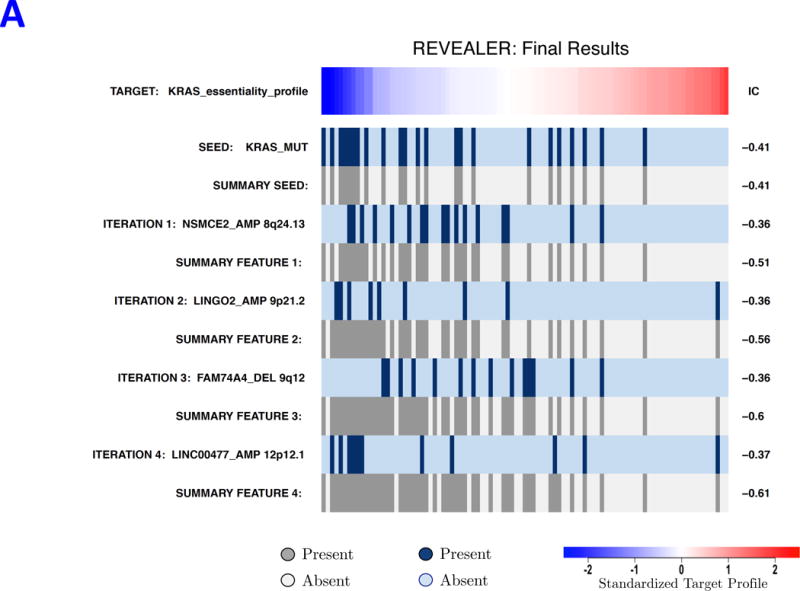
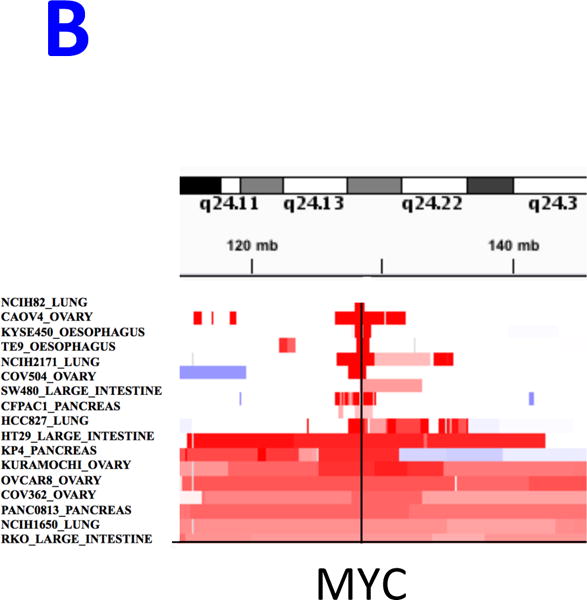
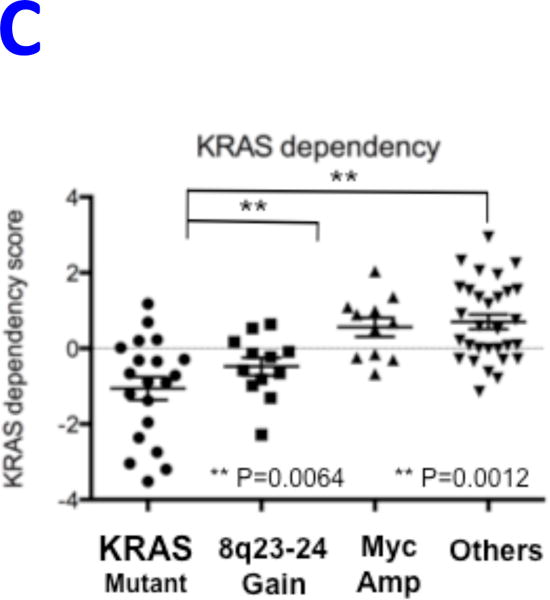
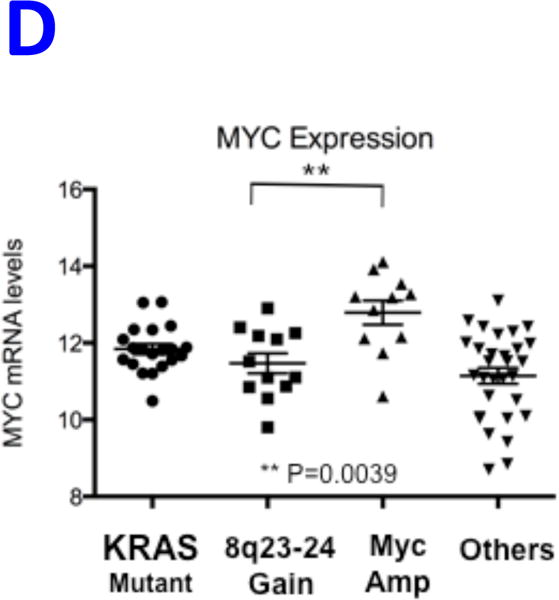
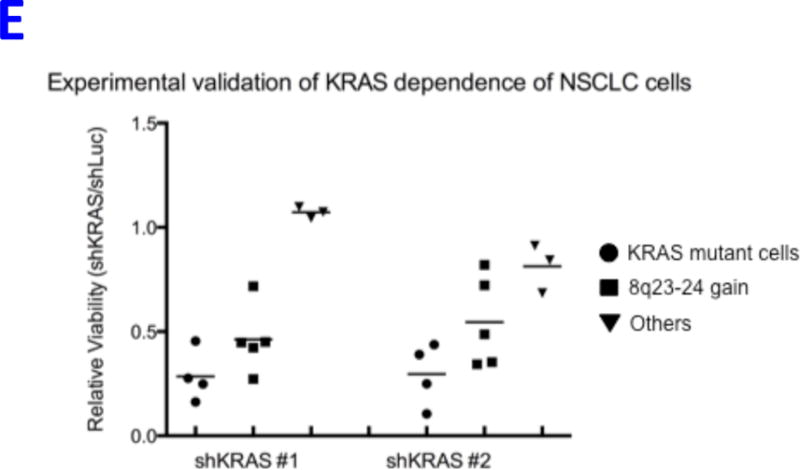
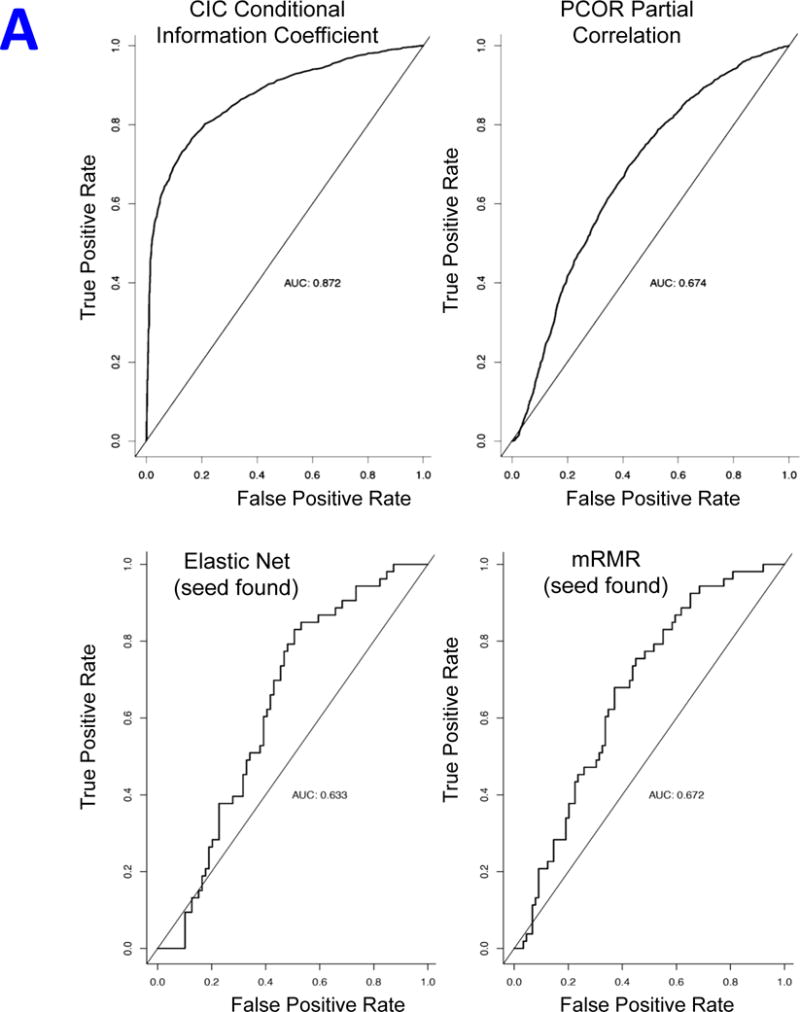
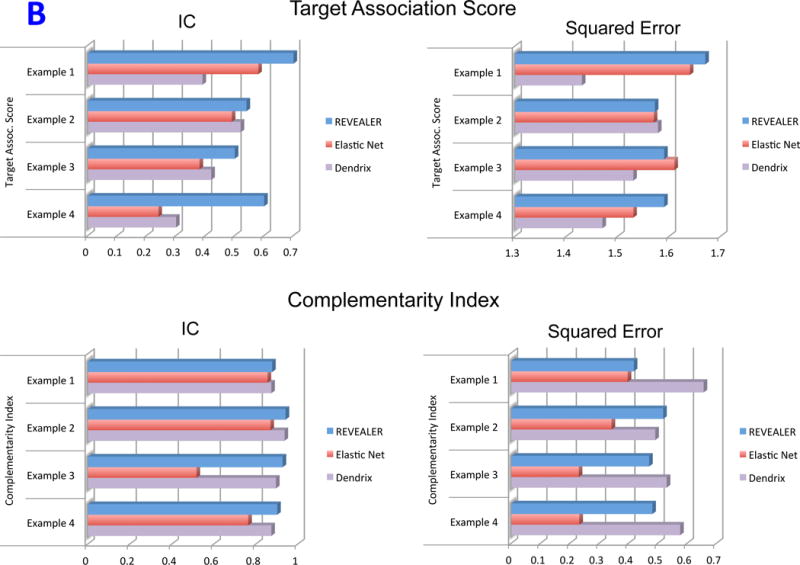
Systematic efforts to sequence the cancer genome have identified large numbers of mutations and copy number alterations in human cancers. However, elucidating the functional consequences of these variants, and their interactions to drive or maintain oncogenic states, remains a challenge in cancer research. We developed REVEALER, a computational method that identifies combinations of mutually exclusive genomic alterations correlated with functional phenotypes, such as the activation or gene dependency of oncogenic pathways or sensitivity to a drug treatment. We used REVEALER to uncover complementary genomic alterations associated with the transcriptional activation of β-catenin and NRF2, MEK-inhibitor sensitivity, and KRAS dependency. REVEALER successfully identified both known and new associations, demonstrating the power of combining functional profiles with extensive characterization of genomic alterations in cancer genomes.


Conflict of interest statement

Competing financial interests statement: I declare that the authors have no competing interest as defined by Nature Publishing Group, or other interests that might be perceived to influence the results and discussion reported in this paper.

Figures

Figure 1
Figure 1
REVEALER Information-based metrics. A)The Information Coefficient IC(t, sk) represents the information shared by the target and the seed or summary feature. B) The Conditional Information Coefficient CIC(t, xi | sk) represents the information shared by the target and a feature, such as a genomic alteration, conditional to the seed feature. C) Detailed schematics of the REVEALER algorithm.
Figure 1
Figure 1
REVEALER Information-based metrics. A)The Information Coefficient IC(t, sk) represents the information shared by the target and the seed or summary feature. B) The Conditional Information Coefficient CIC(t, xi | sk) represents the information shared by the target and a feature, such as a genomic alteration, conditional to the seed feature. C) Detailed schematics of the REVEALER algorithm.
Figure 2
Figure 2
REVEALER results for transcriptional activation of β-catenin in cancer. A) This heatmap illustrates the use of the REVEALER approach to find complementary genomic alterations that match the transcriptional activation of β-catenin in cancer. The target profile is a TCF4 reporter that provides an estimate of the degree of activation of β-catenin. The “seed” is the β-catenin activating mutations, the known “cause” of high values in the target. REVEALER iterates two times and finds APC mutations and the amplification of 13q33 as complementary alterations. At the bottom the heatmap shows the complete set genomic alterations associated with activation of β-catenin found by REVEALER. As can be seen in the figure the features are highly complementary and account for 17 out of the top 20 samples with highest reporter values. B) Profiles of the features shown in Figure 2A, compared with an shRNA profile of β-catenin dependence in 209 cell lines (Supplementary Information). The 3 features are associated with a high degree of β-catenin essentiality but are also highly complementary to each other. The IC scores and nominal p-values with respect to the target are shown on the right side of the heatmap.
Figure 2
Figure 2
REVEALER results for transcriptional activation of β-catenin in cancer. A) This heatmap illustrates the use of the REVEALER approach to find complementary genomic alterations that match the transcriptional activation of β-catenin in cancer. The target profile is a TCF4 reporter that provides an estimate of the degree of activation of β-catenin. The “seed” is the β-catenin activating mutations, the known “cause” of high values in the target. REVEALER iterates two times and finds APC mutations and the amplification of 13q33 as complementary alterations. At the bottom the heatmap shows the complete set genomic alterations associated with activation of β-catenin found by REVEALER. As can be seen in the figure the features are highly complementary and account for 17 out of the top 20 samples with highest reporter values. B) Profiles of the features shown in Figure 2A, compared with an shRNA profile of β-catenin dependence in 209 cell lines (Supplementary Information). The 3 features are associated with a high degree of β-catenin essentiality but are also highly complementary to each other. The IC scores and nominal p-values with respect to the target are shown on the right side of the heatmap.
Figure 3
Figure 3
REVEALER results for transcriptional NRF2 activation in lung cancer. A) The target profile is the single-sample GSEA profile of a group of NRF2-driven genes in a group of 182 lung cancer cell lines. The seed feature was defined as the status of NRF2 mutation or amplification. The first iteration of REVEALER identifies KEAP1 mutation, a known co-activator of NRF2, as a potential cause of activation of NRF2 complementary to the seed feature. The second iteration identifies amplification of chr15q22/26 containing the locus of NOX5 (NADPH oxidase 5). B) Results of luciferase assay using antioxidant response element (ARE) reporter as readout of NRF2 pathway activation and open-reading frame (ORF) constructs for NOX5 (REVEALER result), NRF2 (positive control) and LacZ and no vector as negative controls (two tailed unpaired t-test: NOX5 vs. LacZ *p>0.01, NRF2 vs. LacZ **p>0.001).
Figure 3
Figure 3
REVEALER results for transcriptional NRF2 activation in lung cancer. A) The target profile is the single-sample GSEA profile of a group of NRF2-driven genes in a group of 182 lung cancer cell lines. The seed feature was defined as the status of NRF2 mutation or amplification. The first iteration of REVEALER identifies KEAP1 mutation, a known co-activator of NRF2, as a potential cause of activation of NRF2 complementary to the seed feature. The second iteration identifies amplification of chr15q22/26 containing the locus of NOX5 (NADPH oxidase 5). B) Results of luciferase assay using antioxidant response element (ARE) reporter as readout of NRF2 pathway activation and open-reading frame (ORF) constructs for NOX5 (REVEALER result), NRF2 (positive control) and LacZ and no vector as negative controls (two tailed unpaired t-test: NOX5 vs. LacZ *p>0.01, NRF2 vs. LacZ **p>0.001).
Figure 4
Figure 4
REVEALER results for the drug sensitivity to a MEK-inhibitor example. The target is the MEK-inhibitor PD0325901 sensitivity profile in cancer cell lines and no seed feature (NULLSEED). REVEALER iterates 3 times and identifies BRAF, KRAS and NRAS mutations, all well-known oncogenes upstream of MEK, as complementary “causes” of MEK-inhibitor sensitivity.
Figure 5
Figure 5
REVEALER results for KRAS-dependency. A) The target profile is the relative KRAS-dependence score in 100 cancer cell lines. The seed feature is the mutation status of KRAS, a well-known cause of activation, and the genomic features matrix represents mutations and copy number alterations in the same cell lines. REVEALER identifies a copy number gain (CNG) across a region on chromosome 8q23–24 as the most complementary genomic alteration to KRAS mutation in order to explain KRAS dependency. Other features such as amplifications in chr9p21, and chr12p12 and deletions in chr9q12 are also identified but with lesser incremental benefit. B) Pattern of copy number changes in cancer cells that have gain in 8q23–24 show that copy number changes centromeric to MYC have two distinct patterns. Red indicates regions of chromosomal gain (log2 ratio >0.6). C) Dot plot of relative KRAS dependence across cell lines with various genotypes (X-axis). Differential KRAS dependence between cells were examined between cells with copy number gain on 8q23–24 relative to cells with other genotype (student t-test with Welch’s Correction ***p<0.0001). D) Dot plot of relative MYC mRNA expression across cell lines with various genotypes (X-axis). Differential MYC mRNA levels were assessed between cells with copy number gain on 8q23–24 vs. MYC amplification (student t-test with Welch’s Correction ***p<0.0001). E) Validation of KRAS dependence in non-small cell lung cancer cells with indicated genotypic status. Cancer cells which harbor 8q23–24 gain from the CCLE were chosen and their relative KRAS dependence was assessed for cells that either have mutations in KRAS or those that harbor 8q23–24 alteration (KRAS mutant cells: NCIH2009, NCIH1944, A549, NCIH1792), 8q23–24 gain: NCIH2110, NCIH1781, NCIH1648, NCIH2126, NCIH2342, Others: NCIH28, NCIH1437, NCIH2228). Relative viability was assessed using CellTiter-Glo assay (Promega) and by normalizing the luminescence values of shKRAS infected cells with shLuciferase controls 7 days post-infection.
Figure 5
Figure 5
REVEALER results for KRAS-dependency. A) The target profile is the relative KRAS-dependence score in 100 cancer cell lines. The seed feature is the mutation status of KRAS, a well-known cause of activation, and the genomic features matrix represents mutations and copy number alterations in the same cell lines. REVEALER identifies a copy number gain (CNG) across a region on chromosome 8q23–24 as the most complementary genomic alteration to KRAS mutation in order to explain KRAS dependency. Other features such as amplifications in chr9p21, and chr12p12 and deletions in chr9q12 are also identified but with lesser incremental benefit. B) Pattern of copy number changes in cancer cells that have gain in 8q23–24 show that copy number changes centromeric to MYC have two distinct patterns. Red indicates regions of chromosomal gain (log2 ratio >0.6). C) Dot plot of relative KRAS dependence across cell lines with various genotypes (X-axis). Differential KRAS dependence between cells were examined between cells with copy number gain on 8q23–24 relative to cells with other genotype (student t-test with Welch’s Correction ***p<0.0001). D) Dot plot of relative MYC mRNA expression across cell lines with various genotypes (X-axis). Differential MYC mRNA levels were assessed between cells with copy number gain on 8q23–24 vs. MYC amplification (student t-test with Welch’s Correction ***p<0.0001). E) Validation of KRAS dependence in non-small cell lung cancer cells with indicated genotypic status. Cancer cells which harbor 8q23–24 gain from the CCLE were chosen and their relative KRAS dependence was assessed for cells that either have mutations in KRAS or those that harbor 8q23–24 alteration (KRAS mutant cells: NCIH2009, NCIH1944, A549, NCIH1792), 8q23–24 gain: NCIH2110, NCIH1781, NCIH1648, NCIH2126, NCIH2342, Others: NCIH28, NCIH1437, NCIH2228). Relative viability was assessed using CellTiter-Glo assay (Promega) and by normalizing the luminescence values of shKRAS infected cells with shLuciferase controls 7 days post-infection.
Figure 6
Figure 6
Simulated data results. A) Summary ROC curves for the simulated data benchmark using the CIC/information-based metric, the PCOR/partial correlation the Elastic Net and mRMR feature selection. B) Bar plot of the across-method comparative analysis of top features shown in Table 1 (IC metric), and the corresponding results using the square error metric instead of the IC.
Figure 6
Figure 6
Simulated data results. A) Summary ROC curves for the simulated data benchmark using the CIC/information-based metric, the PCOR/partial correlation the Elastic Net and mRMR feature selection. B) Bar plot of the across-method comparative analysis of top features shown in Table 1 (IC metric), and the corresponding results using the square error metric instead of the IC.

References

    1. Meyerson M, Gabriel S, Getz G. Advances in understanding cancer genomes through second-generation sequencing. Nat Rev Genet. 2010;11:685–696. - PubMed
    1. Lawrence MS, et al. 2013, Mutational heterogeneity in cancer and the search for new cancer- associated genes. Nature. 2013 Jul 11;499(7457):214–8. - PMC - PubMed
    1. Lawrence MS, Stojanov P, Mermel CH, Robinson JT, Garraway LA, Golub TR, Meyerson M, Gabriel SB, Lander ES, Getz G. Discovery and saturation analysis of cancer genes across 21 tumour types. Nature. 2014 Jan 23;505(7484):495–501. - PMC - PubMed
    1. Cancer Genome Atlas Research Network. Weinstein JN, Collisson EA, Mills GB, Shaw KR, Ozenberger BA, Ellrott K, Shmulevich I, Sander C, Stuart JM. The Cancer Genome Atlas Pan-Cancer analysis project. Nat Genet. 2013 Oct;45(10):1113–20. - PMC - PubMed
    1. Beroukhim R, et al. Assessing the significance of chromosomal aberrations in cancer: methodology and application to glioma. Proc Natl Acad Sci U S A. 2007;104:20007–20012. - PMC - PubMed

Publication types

MeSH terms