. 2016 May 2;126(5):1911-25.
doi: 10.1172/JCI83000. Epub 2016 Apr 18.

Collectin-11 detects stress-induced L-fucose pattern to trigger renal epithelial injury

Collectin-11 detects stress-induced L-fucose pattern to trigger renal epithelial injury

Conrad A Farrar et al. J Clin Invest. .

Abstract

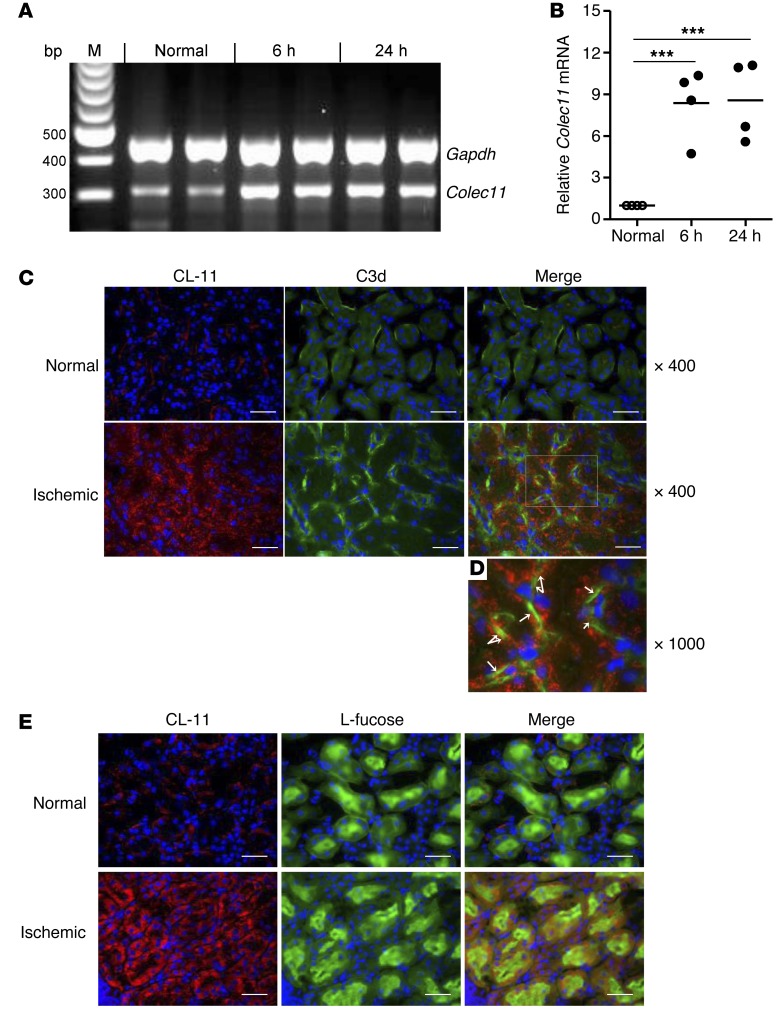
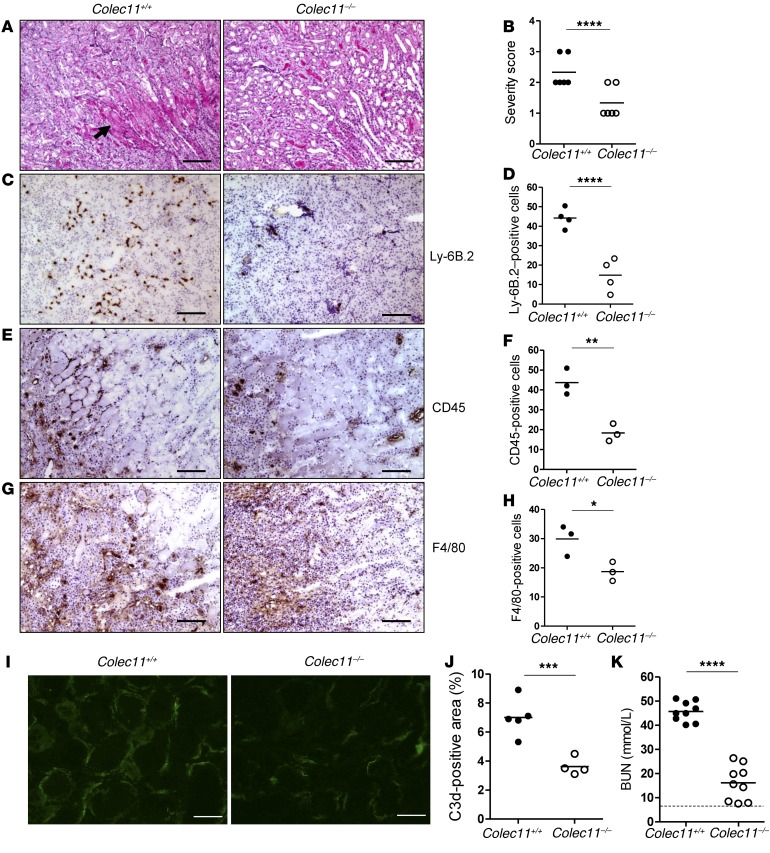
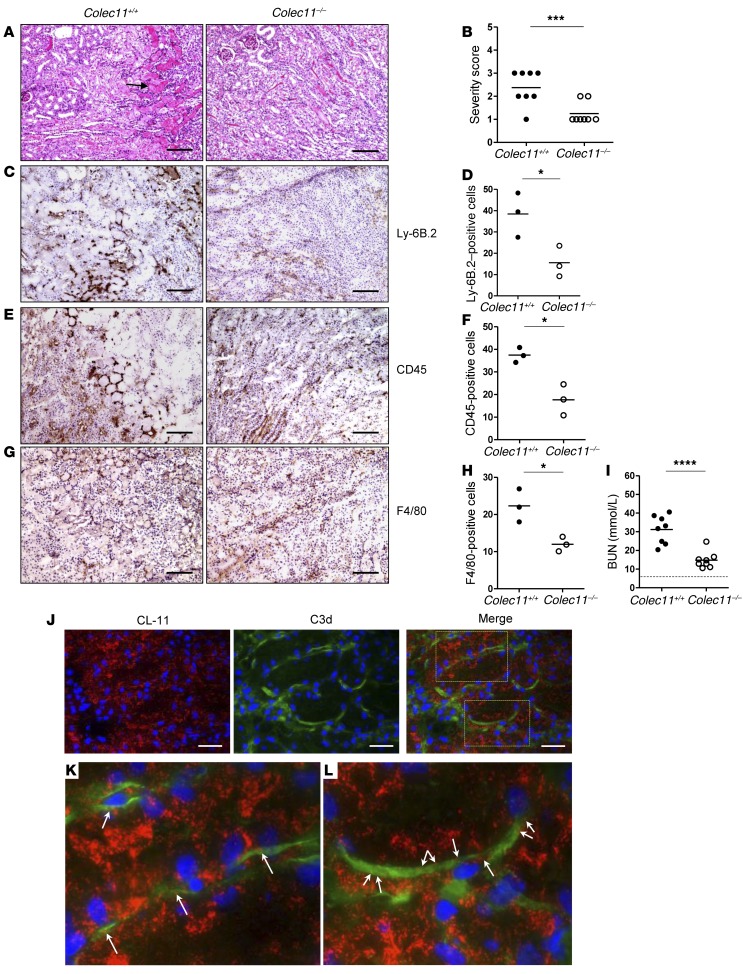
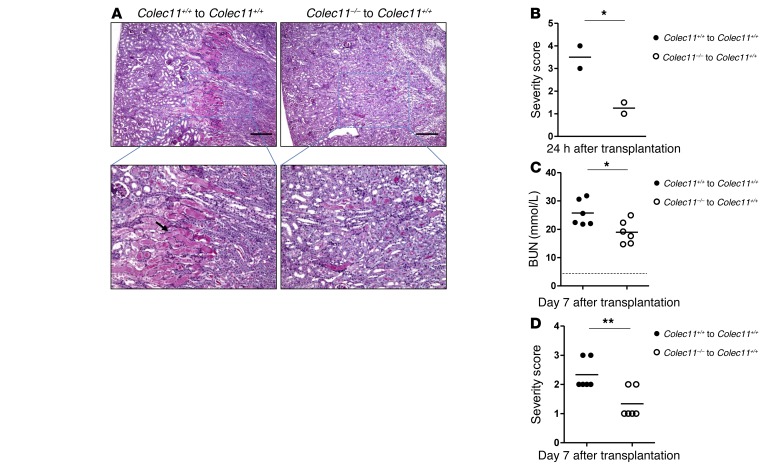
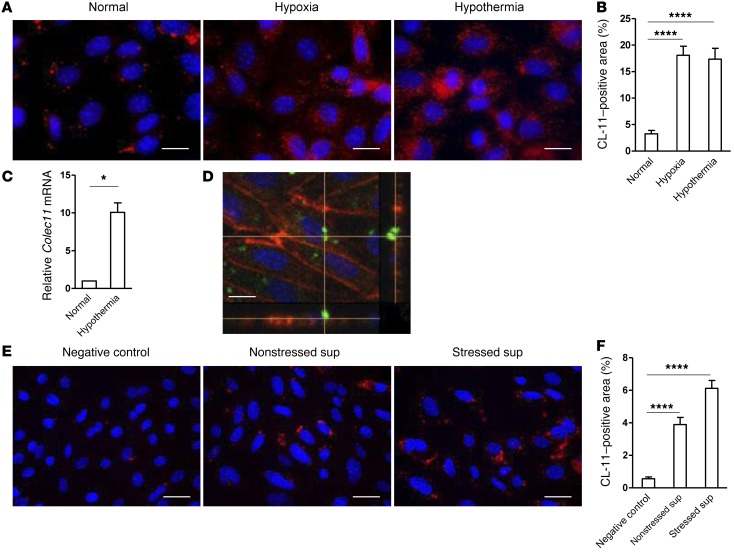
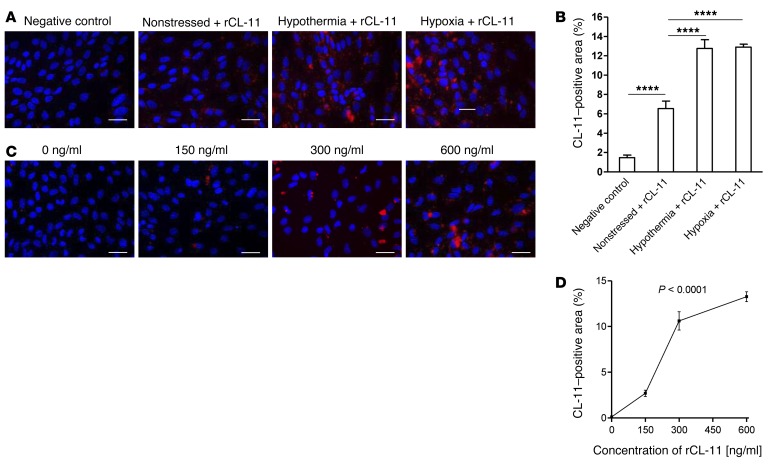
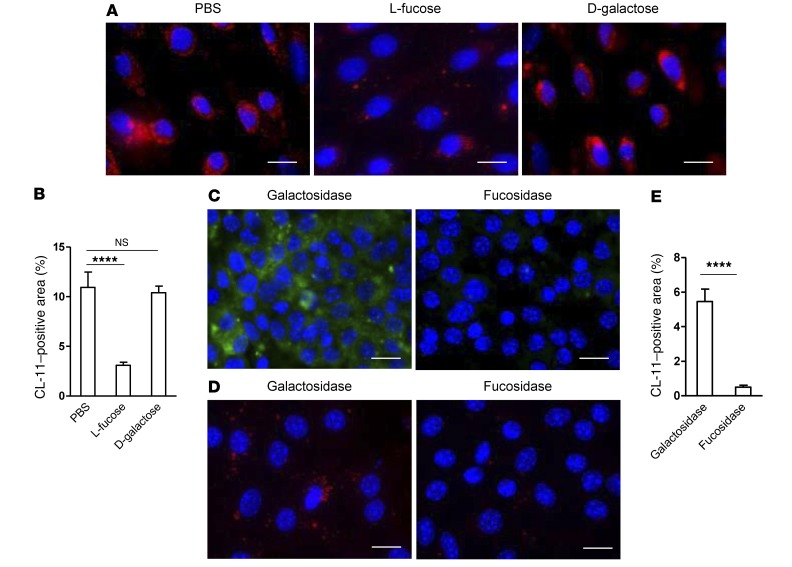
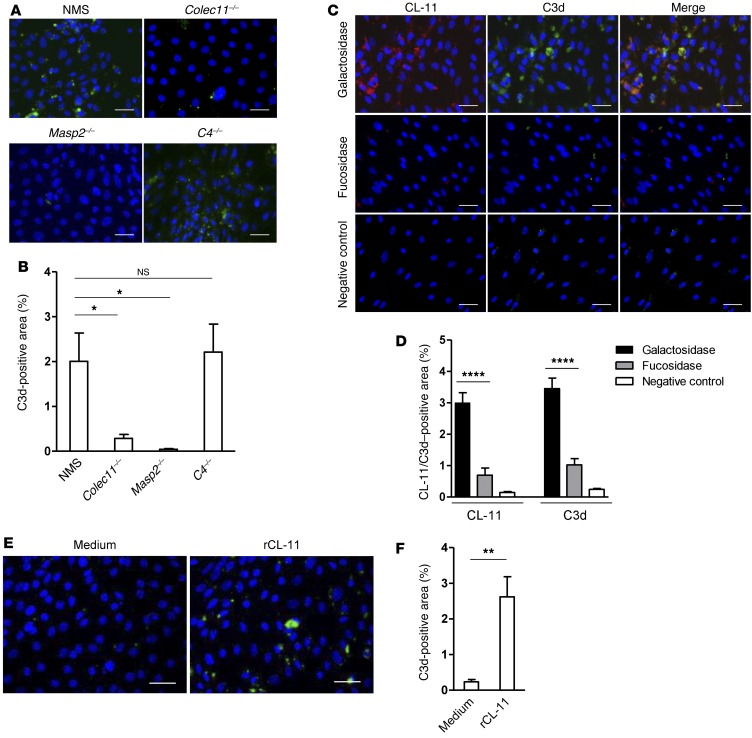
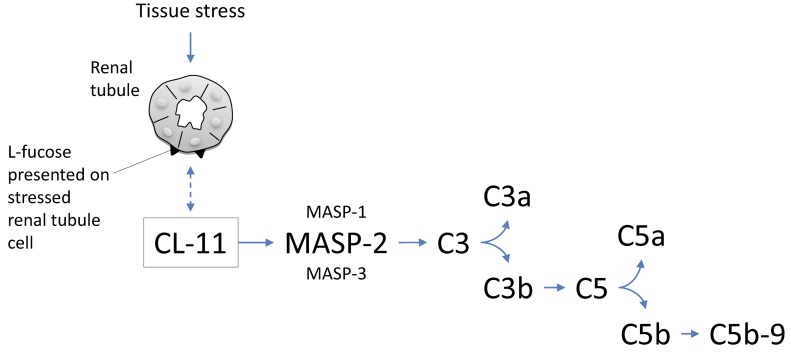
Physiochemical stress induces tissue injury as a result of the detection of abnormal molecular patterns by sensory molecules of the innate immune system. Here, we have described how the recently discovered C-type lectin collectin-11 (CL-11, also known as CL-K1 and encoded by COLEC11) recognizes an abnormal pattern of L-fucose on postischemic renal tubule cells and activates a destructive inflammatory response. We found that intrarenal expression of CL-11 rapidly increases in the postischemic period and colocalizes with complement deposited along the basolateral surface of the proximal renal tubule in association with L-fucose, the potential binding ligand for CL-11. Mice with either generalized or kidney-specific deficiency of CL-11 were strongly protected against loss of renal function and tubule injury due to reduced complement deposition. Ex vivo renal tubule cells showed a marked capacity for CL-11 binding that was induced by cell stress under hypoxic or hypothermic conditions and prevented by specific removal of L-fucose. Further analysis revealed that cell-bound CL-11 required the lectin complement pathway-associated protease MASP-2 to trigger complement deposition. Given these results, we conclude that lectin complement pathway activation triggered by ligand-CL-11 interaction in postischemic tissue is a potent source of acute kidney injury and is amenable to sugar-specific blockade.


Figures

Figure 1
Figure 1. Acute-phase response of CL-11 and associated molecules in mouse kidney.
Detection of CL-11 and potential ligand (L-fucose) and complement activation product (C3d) are shown in normal mouse kidney and injured kidney after 50 minutes of ischemia and up to 24 hours of reperfusion. (A) Agarose gel image demonstrating Colec11 mRNA expression in normal and ischemic kidney tissue, determined by semiquantitative RT-PCR. Colec11 appears as a 315-bp product, and Gapdh (453 bp) is included as an internal control. M, 100 bp DNA ladder. n = 2 mice/group. (B) Quantification of Colec11 mRNA expression in normal and ischemic kidney tissue by real-time quantitative RT-PCR (qRT-PCR) demonstrating upregulation of intrarenal Colec11 mRNA expression following ischemic insult. Each dot represents an individual mouse (n = 4 mice/group). ***P < 0.005, by 1-way ANOVA. (C) Representative immunofluorescence microscopic images of renal cortex showing particulate staining of CL-11 (red), linear peritubular staining of C3d (green), and a merged image of CL-11 and C3d in normal and ischemic kidney tissue (n = 4 mice/group). (D) Enlargement (original magnification, ×400) of white boxed area in panel C, with arrows showing coexpression of CL-11 and complement deposition (orange) along the basolateral border of renal tubular epithelium. (E) Representative fluorescence images of CL-11 (red), L-fucose (green), and a merged image of CL-11 and L-fucose in normal and ischemic kidney tissue (n = 6 mice/group) showing ischemia-related coexpression of CL-11 and L-fucose (orange) along the basolateral border of the tubules. Scale bars: 25 μm.
Figure 2
Figure 2. Impact of CL-11 on renal injury induced by 50 minutes of ischemia.
Renal injury and complement activation in Colec11+/+ and Colec11–/– mice following 50 minutes of ischemia and 24 hours of reperfusion. (A) Representative images of PAS staining of kidney sections from Colec11+/+ and Colec11–/– mice (n = 10 mice/group). Arrow indicates necrotic area of renal tubules seen in a longitudinal section at the junction of the renal cortex and medulla. Scale bars: 100 μm. (B) Severity scores for renal tubular injury in the mice represented in A. (C) Representative images of immunochemical staining of neutrophils in kidney sections from Colec11+/+ and Colec11–/– mice (n = 4 mice/group). (D) Quantification of neutrophils in kidney sections from the mice represented in C. (E) Representative images of immunochemical staining of leukocytes in kidney sections from Colec11+/+ and Colec11–/– mice (n = 3 mice/group). Scale bars: 100 μm. (F) Quantification of leukocytes in the kidney sections represented in E. (G) Representative images of immunochemical staining of macrophages in kidney sections from Colec11+/+ and Colec11–/– mice (n = 3 mice/group). Scale bars: 100 μm. (H) Quantification of macrophages in the kidney sections represented in G. (I) Representative images of immunofluorescence staining of C3d in kidney sections from Colec11+/+ and Colec11–/– mice (n = 10 mice/group). Scale bars: 25 μm. (J) Quantification of C3d in kidney sections from the mice represented in I. (K) BUN levels in Colec11+/+ and Colec11–/– mice after reperfusion (n = 10 mice/group). Dashed line represents the BUN baseline in normal, nonmanipulated mice. (B, D, F, H, J, and K) Each dot represents an individual mouse. *P < 0.05, **P < 0.01, ***P < 0.005, and ****P < 0.001, by unpaired, 2-tailed Student’s t test.
Figure 3
Figure 3. Impact of CL-11 on injury induced by milder ischemic insult.
Renal injury is shown for Colec11+/+ and Colec11–/– mice following 30 minutes of ischemia and 24 hours of reperfusion. (A) Representative images of PAS staining of kidney sections from Colec11+/+ and Colec11–/– mice (n = 8 mice/group). Arrow indicates necrotic renal tubules seen in a longitudinal section at the corticomedullary junction. Scale bars: 100 μm. (B) Severity scores for renal tubular injury in the mice represented in A. (C) Representative images of immunochemical staining of neutrophils in kidney sections from Colec11+/+ and Colec11–/– mice (n = 3 mice/group). Scale bars, 100 μm. (D) Quantification of neutrophils in the kidney sections represented in C. (E) Representative images of immunochemical staining of leukocytes in kidney sections from Colec11+/+ and Colec11–/– mice (n = 3 mice/group). Scale bars: 100 μm. (F) Quantification of leukocytes in the kidney sections represented in E. (G) Representative images of immunochemical staining of macrophages in kidney sections from Colec11+/+ and Colec11–/– mice (n = 3 mice/group). Scale bars, 100 μm. (H) Quantification of macrophages in the kidney sections represented in panel G. (I) BUN levels in Colec11+/+ and Colec11–/– mice after reperfusion (n = 8 mice/group). Dashed line represents the BUN baseline in normal, nonmanipulated mice. (J) Representative immunofluorescence microscopic images of CL-11 (red) and C3d (green) and a merged image of CL-11 and C3d in ischemic kidney tissue. Scale bars: 25 μm. (K and L) Enlarged images (original magnification, ×400) of the merged image in J. Arrows indicate where the linear deposit of complement is dotted with CL-11 (orange) along the basolateral surface of the tubular epithelium, which is best appreciated at higher magnification. (B, D, F, H, and I) Each dot represents an individual mouse. *P < 0.05, ***P < 0.005, and ****P < 0.001, by unpaired, 2-tailed Student’s t test.
Figure 4
Figure 4. Contribution of kidney-derived CL-11 in post-transplantation ischemic injury.
Quantification of histological injury and/or renal dysfunction is shown for Colec11+/+ mice transplanted with kidneys from Colec11+/+ or Colec11–/– littermates. The donor organ was kept on ice for 25 minutes prior to implantation. (A) Histology with PAS staining 24 hours after transplantation representing the peak of injury (n = 2 mice/group). Enlarged panel (original magnification, ×200) with an arrow illustrates necrotic renal tubules seen in a longitudinal section. Scale bars: 100 μm. (B) Severity scores for the renal tubular injury represented in A. (C) BUN measurement in the recovery phase on day 7 after transplantation for recipients of Colec11+/+ or Colec11–/– donor kidneys, following the remaining native nephrectomy on day 6 (n = 6 mice/group). Dashed line represents the BUN baseline in normal, nonmanipulated mice. (D) Severity scores for the renal tubular injury in mice represented in C. *P < 0.05 and **P < 0.01, by unpaired, 2-tailed Student’s test.
Figure 5
Figure 5. Renal tubule cell stress mediates CL-11 expression.
(A) Representative immunofluorescence images of intracellular CL-11 in nonstressed and hypoxia-stressed RTECs or in hypothermia-stressed Colec11+/+ RTECs (permeabilized). CL-11 (red) and nuclei (blue) are shown. Scale bars: 10 μm. (B) Quantification of intracellular CL-11 in the RTECs shown in A. Data shown are from 6 individual images and representative of 4 independent experiments. (C) Relative Colec11 mRNA levels in nonstressed and hypothermia-stressed Colec11+/+ RTECs, as determined by qRT-PCR (n = 3). Data are representative of 2 experiments. *P < 0.05, by unpaired, 2-tailed Student’s t test. (D) Confocal microscopic image of CL-11 in hypothermia-stressed Colec11+/+ RTECs (nonpermeabilized). CL-11 (green), F-actin (red), and nuclei (blue) are shown. Views in the bottom and side panels show that CL-11 was present at the basal cell surface. (E) Representative immunofluorescence images of bound CL-11 in Colec11–/– RTECs that had been hypoxia stressed and then incubated with supernatants from nonstressed (Nonstressed sup) or hypoxia-stressed (Stressed sup) Colec11+/+ RTEC cultures or nonstressed Colec11–/– RTEC cultures (negative control), demonstrating that the supernatants from Colec11+/+ RTEC cultures had CL-11–binding activity. Scale bars: 25 μm. (F) Quantification of bound CL-11 in the RTECs represented in E. Data shown are from 7 individual images and representative of 2 independent experiments. (B and F) ****P < 0.001, by 1-way ANOVA.
Figure 6
Figure 6. Renal tubule cell stress mediates CL-11 binding.
Binding of exogenous CL-11 detected by immunofluorescence staining after incubation of rCL-11 with Colec11/– RTECs is shown. (A) Representative immunofluorescence images of bound rCL-11 in nonstressed and stressed (i.e., hypothermia or hypoxia) Colec11–/– RTECs after incubation with rCL-11, showing a clumped CL-11–binding pattern induced by cell stress. The negative control consisted of stressed Colec11–/– RTECs that had not been incubated with rCL-11. Scale bars: 25 μm. (B) Quantification of bound CL-11 corresponding to the RTECs shown in A. Data shown are from 10 individual images and representative of 3 independent experiments. ****P < 0.001, by 1-way ANOVA. (C) Dose titration of rCL-11 binding to stressed RTECs. Representative images show the different CL-11 concentrations. Data shown are from 6 to 8 individual images and representative of 2 independent experiments. Scale bars: 25 μm. (D) Quantification of bound CL-11 corresponding to the RTECs represented in C. Data were analyzed by 1-way ANOVA (P value is indicated in the graph).
Figure 7
Figure 7. Sugar specificity of CL-11 binding to stressed renal tubule cells.
(A) Representative immunofluorescence images of bound rCL-11 in hypothermia-stressed Colec11–/– RTECs following incubation of the cells with rCL-11, which had been pretreated with PBS, L-fucose, or D-galactose, demonstrating that L-fucose–treated rCL-11 had reduced binding to the cells compared with that seen with PBS or D-galactose treatment. Scale bars: 10 μm. (B) Quantification of bound rCL-11 in the RTECs shown in A. Data shown are from 10 individual images and representative of 3 independent experiments. ****P < 0.001, by 1-way ANOVA. (C) Representative fluorescence images of L-fucose (green) in hypothermia-stressed Colec11–/– RTECs following pretreatment of the cells with α-L-fucosidase or β-gal, as detected by the fluorescein-conjugated plant lectin LTL, demonstrating that fucosidase treatment reduced L-fucose residues on the cells. Scale bars: 12.5 μm. (D) Representative immunofluorescence images of bound rCL-11 (red) in the cells shown in C, which had been further incubated with rCL-11, demonstrating that fucosidase treatment reduced rCL-11 binding to the cells. Scale bars: 12.5 μm. (E) Quantification of bound rCL-11 in the RTECs shown in D. Data shown are from 6 to 10 individual images and representative of 2 independent experiments. ****P < 0.001, by unpaired, 2-tailed Student’s t test.
Figure 8
Figure 8. Requirement of complement subcomponents for complement activation on tubule cells.
(A) Representative immunofluorescence images of C3d deposits on hypothermia-stressed Colec11–/– RTECs following incubation with 10% fresh mouse serum from normal (NMS), Colec11–/–, Masp2–/–, or C4–/– mice, demonstrating C3d deposition following incubation with NMS and reduced deposition with Colec11–/– or Masp2–/– serum; in contrast, C3d deposition was not reduced following incubation with C4–/– serum. Scale bars: 25 μm. (B) Quantification of C3d deposits on the RTECs shown in A. Data shown are from 10 individual images for each of 4 independent experiments. Percentage of C3d-positive binding to Colec11–/– RTECs was determined from 5 to 7 individual fields, representative of 4 independent experiments, except for incubation with C4–/– serum, which was performed in 2 of those experiments. *P < 0.05, by 1-way ANOVA. (C) Representative fluorescence images of CL-11 (red), C3d (green), and a merged image of CL-11 and C3d in Colec11–/– RTECs that had been hypothermia stressed, pretreated with α-L-fucosidase or β-gal, and then incubated with NMS, demonstrating that CL-11 binding and C3d deposition were reduced by fucosidase treatment. A negative control of α-L-fucosidase–treated Colec11–/– RTECs, which had been incubated with Colec11–/– serum, is also shown. Scale bars: 25 μm. (D) Quantification of CL-11 binding and C3d deposition in the RTECs shown in C. Data shown are from 6 to 8 individual images and representative of 3 independent experiments. ****P < 0.001, by 2-way ANOVA. (E) Typical staining pattern for C3d on stressed Colec11–/– RTECs that had been incubated with medium alone or medium containing rCL-11 and then washed and subsequently incubated with Colec11–/– serum. (F) Quantification of C3d deposition in the RTECs shown in E. Data are from 6 individual images for each of 2 independent experiments. **P < 0.01, by unpaired, 2-tailed Student’s t test.
Figure 9
Figure 9. Proposed scheme in which CL-11 detects stress-associated L-fucose on renal tubule cells and initiates complement activation via the lectin pathway.
Renal cell stress increases the concentration of CL-11 in the extracellular space and leads to cell-autonomous binding through abnormal presentation of L-fucose on the cell surface. High-density binding of CL-11 in the presence of MASP-2 results in the cleavage of C3. Complement effectors generated downstream of C3 are known to contribute to inflammatory cell infiltration and tubule cell death through receptor-mediated stimulation by C5a and membrane pore formation of C5b-9. This model depicts the lectin pathway triggered by CL-11 as the primary driver of complement activation in postischemic acute kidney injury.

Comment in

Similar articles

Cited by

References

    1. Pasparakis M. Regulation of tissue homeostasis by NF-κB signalling: implications for inflammatory diseases. Nat Rev Immunol. 2009;9(11):778–788. doi: 10.1038/nri2655. - DOI - PubMed
    1. Holtzman MJ, Byers DE, Alexander-Brett J, Wang X. The role of airway epithelial cells and innate immune cells in chronic respiratory disease. Nat Rev Immunol. 2014;14(10):686–698. doi: 10.1038/nri3739. - DOI - PMC - PubMed
    1. Hansen S, et al. Collectin 11 (CL-11, CL-K1) is a MASP-1/3-associated plasma collectin with microbial-binding activity. J Immunol. 2010;185(10):6096–6104. doi: 10.4049/jimmunol.1002185. - DOI - PubMed
    1. Motomura W, et al. Immunolocalization of a novel collectin CL-K1 in murine tissues. J Histochem Cytochem. 2008;56(3):243–252. - PMC - PubMed
    1. Selman L, Hansen S. Structure and function of collectin liver 1 (CL-L1) and collectin 11 (CL-11, CL-K1) Immunobiology. 2012;217(9):851–863. doi: 10.1016/j.imbio.2011.12.008. - DOI - PubMed

Publication types

MeSH terms