. 2016 May 2;126(5):1926-38.
doi: 10.1172/JCI83551. Epub 2016 Apr 18.

Distinct subpopulations of FOXD1 stroma-derived cells regulate renal erythropoietin

Distinct subpopulations of FOXD1 stroma-derived cells regulate renal erythropoietin

Hanako Kobayashi et al. J Clin Invest. .

Abstract

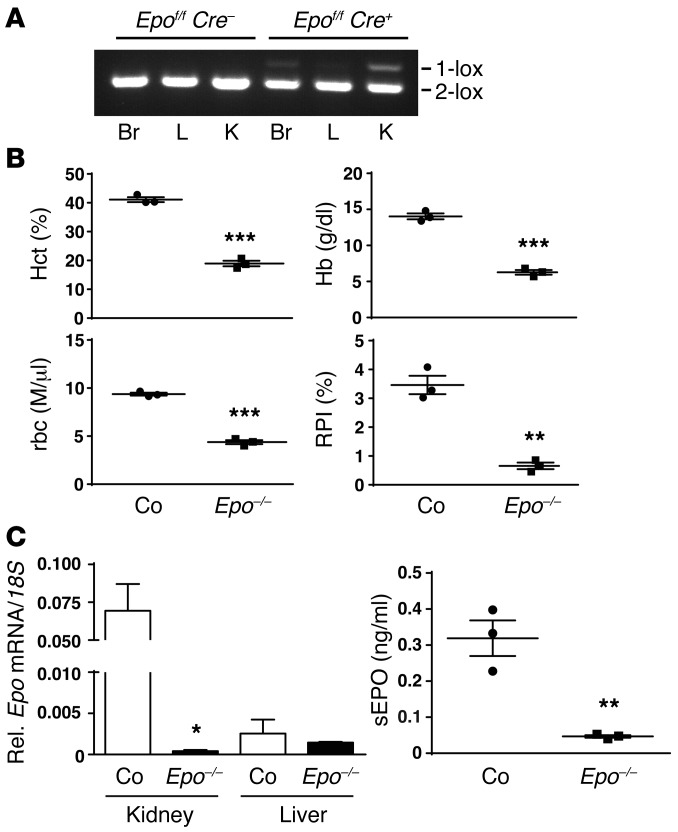
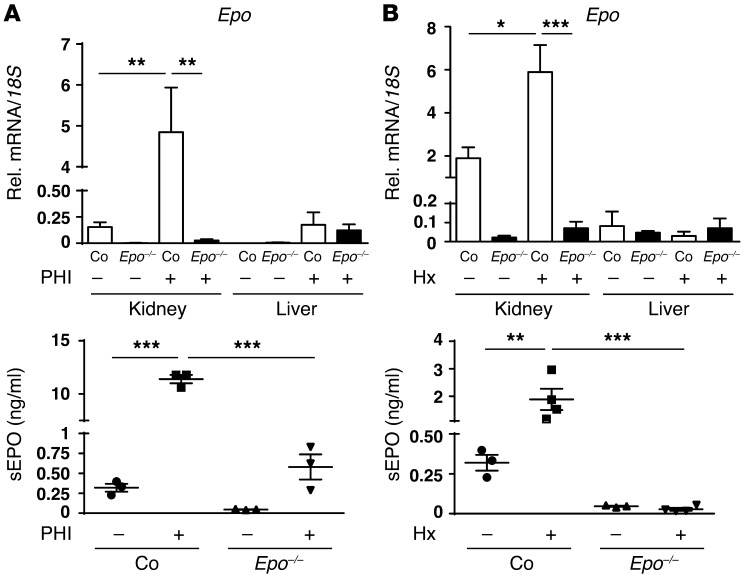
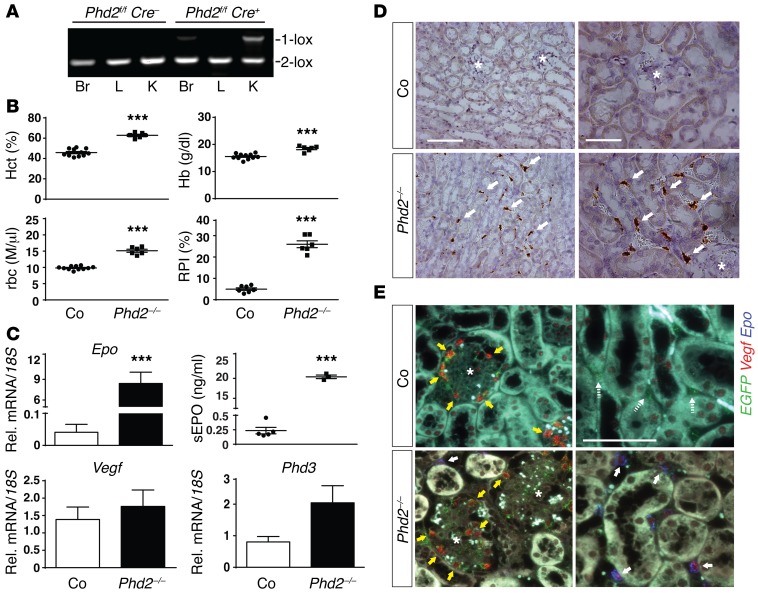
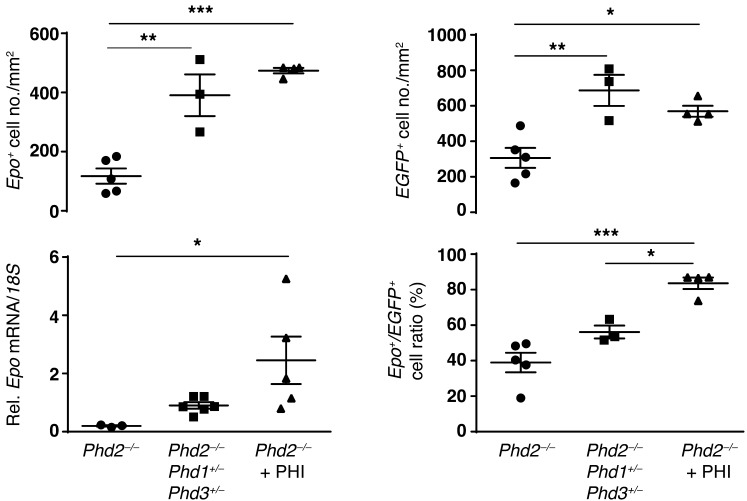
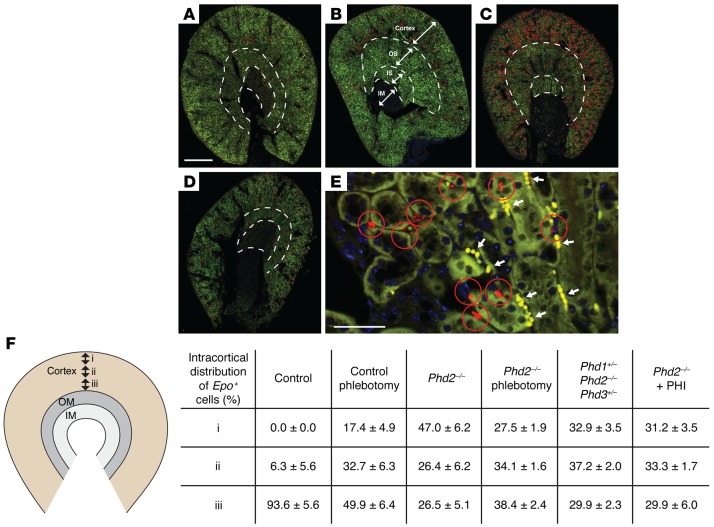
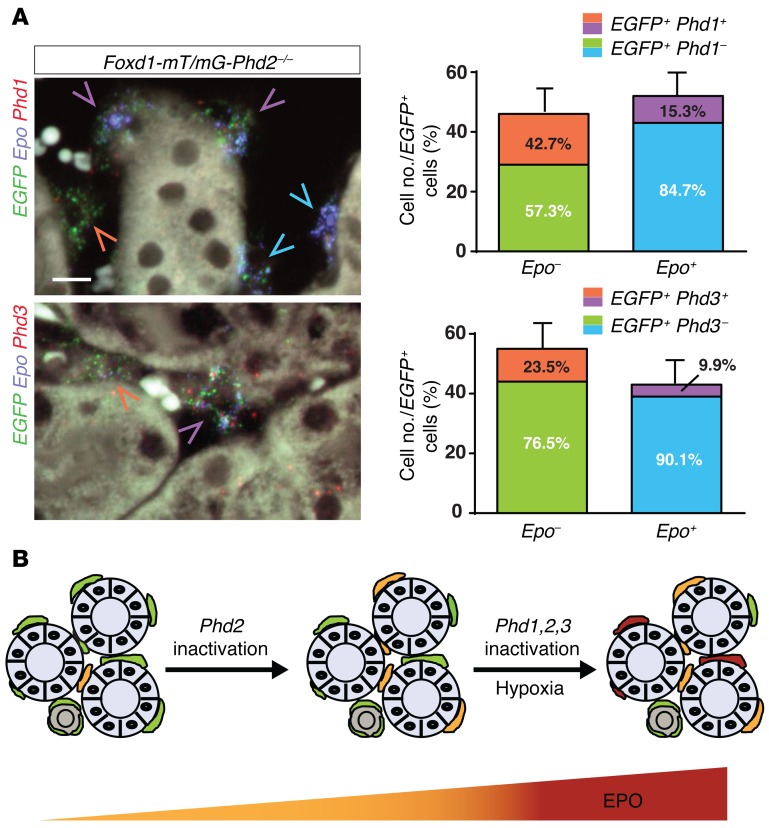
Renal peritubular interstitial fibroblast-like cells are critical for adult erythropoiesis, as they are the main source of erythropoietin (EPO). Hypoxia-inducible factor 2 (HIF-2) controls EPO synthesis in the kidney and liver and is regulated by prolyl-4-hydroxylase domain (PHD) dioxygenases PHD1, PHD2, and PHD3, which function as cellular oxygen sensors. Renal interstitial cells with EPO-producing capacity are poorly characterized, and the role of the PHD/HIF-2 axis in renal EPO-producing cell (REPC) plasticity is unclear. Here we targeted the PHD/HIF-2/EPO axis in FOXD1 stroma-derived renal interstitial cells and examined the role of individual PHDs in REPC pool size regulation and renal EPO output. Renal interstitial cells with EPO-producing capacity were entirely derived from FOXD1-expressing stroma, and Phd2 inactivation alone induced renal Epo in a limited number of renal interstitial cells. EPO induction was submaximal, as hypoxia or pharmacologic PHD inhibition further increased the REPC fraction among Phd2-/- renal interstitial cells. Moreover, Phd1 and Phd3 were differentially expressed in renal interstitium, and heterozygous deficiency for Phd1 and Phd3 increased REPC numbers in Phd2-/- mice. We propose that FOXD1 lineage renal interstitial cells consist of distinct subpopulations that differ in their responsiveness to Phd2 inactivation and thus regulation of HIF-2 activity and EPO production under hypoxia or conditions of pharmacologic or genetic PHD inactivation.


Figures

Figure 1
Figure 1. Inactivation of Epo in FOXD1 stroma-derived cells results in severe anemia.
(A) PCR analysis of genomic brain (Br), liver (L), and kidney (K) DNA isolated from control (Epofl/fl Cre) and Foxd1-Epo–/– (Epofl/fl Cre+) mutant mice. 2-lox denotes the nonrecombined conditional allele and 1-lox the recombined allele. (B) Values for hematocrit (Hct), hemoglobin (Hb), rbc counts, and reticulocyte production index (RPI) from individual control (Co) and Foxd1-Epo–/– (Epo–/–) mutant mice (n = 3 each). (C) Renal and hepatic Epo mRNA and serum EPO (sEPO) levels from control and Foxd1-Epo–/– mutant mice (n = 3). Data are represented as mean ± SEM; 2-tailed Student’s t test; *P < 0.05, **P < 0.01, ***P < 0.001 compared with control group.
Figure 2
Figure 2. Renal EPO-producing cells are derived from FOXD1 stromal progenitors.
Shown are the relative renal and liver Epo responses to treatment with an orally administered HIF-PHD inhibitor (PHI) or normobaric hypoxia in control (Co) and Foxd1-Epo–/– mutants (Epo–/–). (A) PHI treatment with compound GSK1002083A (n = 3 each). (B) Treatment with 2 days of normobaric hypoxia (Hx) at 10% O2 (n = 3 and 4, respectively). The induction of Epo mRNA is completely suppressed (top panels), and serum EPO responses (bottom panels) are blunted in Foxd1-Epo–/– mutants. Data are represented as mean ± SEM; 2-way ANOVA with post hoc Tukey’s test; *P < 0.05, **P < 0.01, ***P < 0.001.
Figure 3
Figure 3. Inactivation of Phd2 in FOXD1 stroma-derived renal interstitial cells results in polycythemia.
(A) PCR analysis of genomic brain (Br), liver (L), and kidney (K) DNA isolated from control (Phd2fl/fl Cre) and Foxd1-Phd2–/– (Phd2fl/fl Cre+) mutant mice. 2-lox denotes the nonrecombined conditional allele and 1-lox the recombined allele. (B) Individual values for hematocrit (Hct), hemoglobin (Hb), rbc counts, and reticulocyte production index (RPI) for control (Co) and Foxd1-Phd2–/– (Phd2–/–) mutant mice (n = 6–11). Data are represented as mean ± SEM; 2-tailed Student’s t test; ***P < 0.001. (C) Renal Epo, Vegf, and Phd3 mRNA and serum EPO (sEPO) level from control and Foxd1-Phd2–/– mutant mice (n = 3–6). Graph bars represent mean ± SEM; 2-tailed Student’s t test; ***P < 0.001 compared with control group. (D) Epo ISH in formalin-fixed, paraffin-embedded kidney sections from control and Foxd1-Phd2–/– kidneys using an HRP-based colorimetric detection method. White arrows indicate positively stained cells and asterisks depict glomeruli. Scale bars: 100 μm (left panels), 50 μm (right panels). (E) Vegf expression is increased in Phd2–/– interstitial cells. Shown are representative images of multiplex ISH studies using formalin-fixed, paraffin-embedded kidney tissue sections from Foxd1-mT/mG (Co) and Foxd1-mT/mG-Phd2–/– (Phd2–/–) mice. Epo+Vegf+ cells are denoted by white arrows; yellow arrows depict Vegf-expressing glomerular cells; glomeruli are marked with asterisks. Scale bar: 50 μm (all panels).
Figure 4
Figure 4. Epo induction in Foxd1-Phd2–/– mutants is submaximal.
Shown are the results of multiplex ISH for Epo and EGFP RNA using formalin-fixed, paraffin-embedded kidney tissue sections from Foxd1-mT/mG (Co) and Foxd1-mT/mG-Phd2–/– (Phd2–/–) mutant mice at baseline and after phlebotomy (n = 5 for each group). (A) Representative images of kidney tissue sections containing peritubular interstitial cells expressing Epo (red signal) and/or EGFP (green signal). Nuclei are stained with DAPI (blue signal). Scale bars: 100 μm (baseline and phlebotomy), 10 μm (high-magnification images). White arrows identify Epo-expressing cells; asterisks depict glomeruli. (B) Top left panel: Quantification of Epo-expressing cells. Shown is the absolute number of Epo+ cells per square millimeter of kidney tissue. Bottom left panel: Epo mRNA levels relative to 18S in total kidney tissue homogenates as determined by real-time PCR (n = 3–5). Top right panel: Quantification of EGFP-expressing cells. Shown is the absolute number of EGFP+ cells per square millimeter. Bottom right panel: Fraction of Epo-expressing cells among EGFP+ cells. Data are represented as mean ± SEM; 2-way ANOVA with post hoc Tukey’s test; *P < 0.05, **P < 0.01, ***P < 0.001.
Figure 5
Figure 5. Differential expression of PDGFRB in murine and human EPO-producing renal interstitial cells.
(A) Shown are representative images from ISH studies simultaneously detecting Epo (red signal), EGFP (green signal), and Pdgfrb (blue signal) transcripts in formalin-fixed, paraffin-embedded kidney tissue sections from Foxd1-Phd2–/– mutant mice. The red arrowhead depicts a representative Epo+Pdfgrb+ interstitial cell; the black arrowhead depicts a representative EpoPdgfrb+ cell. Bottom right panel: Quantification of Epo-expressing cells within Pdgfrb+ and Pdgfrb cell populations expressed as percentage (n = 4). Scale bars: 50 μm (low-magnification panel), 10 μm (high-magnification panels). Graph bars represent mean ± SEM; 2-tailed Student’s t test; ***P < 0.001. (B) ISH for EPO (red signal) and PDGFRB (blue signal) in human renal tissue. Top panel: Low-magnification image of large tissue section from normal kidney. EPO-expressing cells were detected in areas highlighted by red boxes (total of 63 EPO+ cells; 12 EPO+ cells were negative for PDGFRB). Bottom panels: Representative images of cells expressing both PDGFRB and EPO (red arrowheads) and interstitial EPO-expressing cells with nondetectable PDGFRB transcripts (white arrowhead). Scale bars: 1 mm (top panel), 10 μm (bottom panels).
Figure 6
Figure 6. Inactivation of Phd1 and Phd3 increases renal EPO production in Phd2–/– kidneys.
Shown are the results from multiplex fluorescent ISH studies using formalin-fixed, paraffin-embedded kidney tissue sections from Foxd1-mT/mG-Phd2–/– (Phd2–/–) mutants (n = 5), Foxd1-mT/mG-Phd1+/–-Phd2–/–-Phd3+/– (Phd2–/–Phd1+/–Phd3+/–) mutants (n = 3) and Foxd1-mT/mG-Phd2–/– mice treated with GSK1002083A (Phd2–/– + PHI; n = 4). Top left panel: Quantification of Epo-expressing cells. Shown is the absolute number of Epo+ cells per square millimeter. Bottom left panel: Epo mRNA levels relative to 18S in total kidney tissue homogenates as determined by real-time PCR (n = 3–6). Top right panel: Quantification of EGFP-expressing cells. Shown is the absolute number of EGFP+ cells per square millimeter of kidney tissue. Bottom right panel: Fraction of Epo-expressing cells within the EGFP+ cell population. Data are represented as mean ± SEM; 1-way ANOVA with post hoc Tukey’s test; *P < 0.05, **P < 0.01, ***P < 0.001.
Figure 7
Figure 7. REPC topography in anemic mice differs from that in Foxd1-Phd2–/– mice.
Shown are representative annotated images illustrating the distribution of REPCs in anemic control and in Foxd1-Phd2–/– mice. Epo ISH studies were performed using formalin-fixed, paraffin-embedded kidney tissue sections. (AD) Epo transcripts were detected by red signals in original images. To facilitate visualization and to provide an overview of Epo transcript distribution at low magnification, Epo+ cells were annotated with red circles. (A) Kidney section from control mouse at baseline. (B) Kidney section from control mouse with Hct of 26%. (C) Kidney section from control mouse with Hct of 15%. (D) Representative low-magnification image of kidney from a Foxd1-Phd2–/– mutant. (E) Representative high-magnification image of Epo ISH from control mouse with Hct of 15% to illustrate how Epo+ cells were annotated. rbc are denoted by white arrows. White dashed lines indicate borders between cortex, outer stripe (OS) and inner stripe (IS) of outer medulla, and inner medulla (IM). Scale bars: 1 mm (AD), 50 μm (E). (F) Shown is the relative distribution of Epo-expressing cells in the outer (i), mid– (ii), and inner (iii) renal cortex from control mice at baseline (n = 4) and after phlebotomy (n = 5), Foxd1-mT/mG-Phd2–/– (Phd2–/–) mutants at baseline (n = 5) and after phlebotomy (n = 5), Foxd1-mT/mG-Phd1+/–-Phd2–/–-Phd3+/– (Phd1+/– Phd2–/– Phd3+/–) mutants (n = 3), and Foxd1-mT/mG-Phd2–/– mice treated with GSK1002083A (Phd2–/– + PHI; n = 4). Data are represented as mean ± SEM. OM, outer medulla.
Figure 8
Figure 8. Phd1 and Phd3 are differentially expressed in Phd2–/– renal interstitial cells.
(A) Results from multiplex fluorescent ISH studies using formalin-fixed, paraffin-embedded kidney tissue sections from Foxd1-mT/mG-Phd2–/– mice detecting Epo (blue signal), EGFP (green signal), and Phd1 or Phd3 transcripts (red signal). Shown are representative images; blue arrowheads depict EGFP+Epo+Phd1 cells, purple arrowheads depict EGFP+Epo+Phd1+ or EGFP+Epo+Phd3+ cells, and orange arrowheads point toward EGFP+EpoPhd1+ or EGFP+EpoPhd3+ cells. Scale bar: 10 μm. Quantification of cells is shown in the right panels (n = 3 each group). Data are represented as mean ± SEM. (B) Schematic depicting the role of individual PHDs in the regulation of REPC number and renal EPO output. EPO-producing cells are indicated by orange and burgundy red color. Renal interstitial cells that do not produce EPO are indicated by green. Renal tubules are depicted by gray.

References

    1. Koury MJ, Haase VH. Anaemia in kidney disease: harnessing hypoxia responses for therapy. Nat Rev Nephrol. 2015;11(7):394–410. doi: 10.1038/nrneph.2015.82. - DOI - PMC - PubMed
    1. Scortegagna M, Morris MA, Oktay Y, Bennett M, Garcia JA. The HIF family member EPAS1/HIF-2α is required for normal hematopoiesis in mice. Blood. 2003;102(5):1634–1640. doi: 10.1182/blood-2003-02-0448. - DOI - PubMed
    1. Kapitsinou PP, et al. Hepatic HIF-2 regulates erythropoietic responses to hypoxia in renal anemia. Blood. 2010;116(16):3039–3048. doi: 10.1182/blood-2010-02-270322. - DOI - PMC - PubMed
    1. Semenza GL. Oxygen sensing, hypoxia-inducible factors, and disease pathophysiology. Annu Rev Pathol. 2014;9:47–71. doi: 10.1146/annurev-pathol-012513-104720. - DOI - PubMed
    1. Kaelin WG, Jr, Ratcliffe PJ. Oxygen sensing by metazoans: the central role of the HIF hydroxylase pathway. Mol Cell. 2008;30(4):393–402. doi: 10.1016/j.molcel.2008.04.009. - DOI - PubMed

Publication types

MeSH terms

Substances