

Glutathione biosynthesis is a metabolic vulnerability in PI(3)K/Akt-driven breast cancer
- PMID: 27088857
- PMCID: PMC4848114
- DOI: 10.1038/ncb3341
Glutathione biosynthesis is a metabolic vulnerability in PI(3)K/Akt-driven breast cancer
Abstract
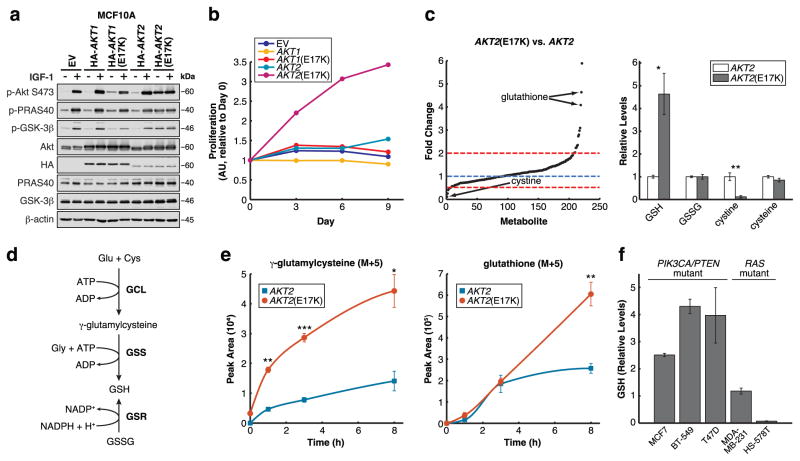
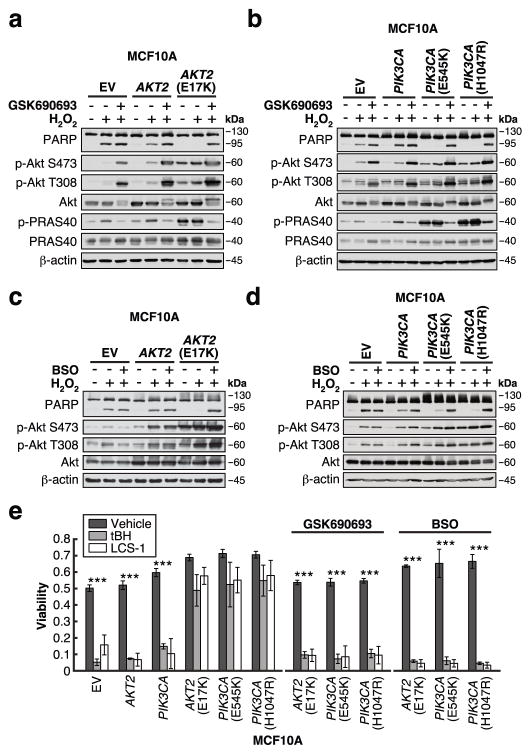
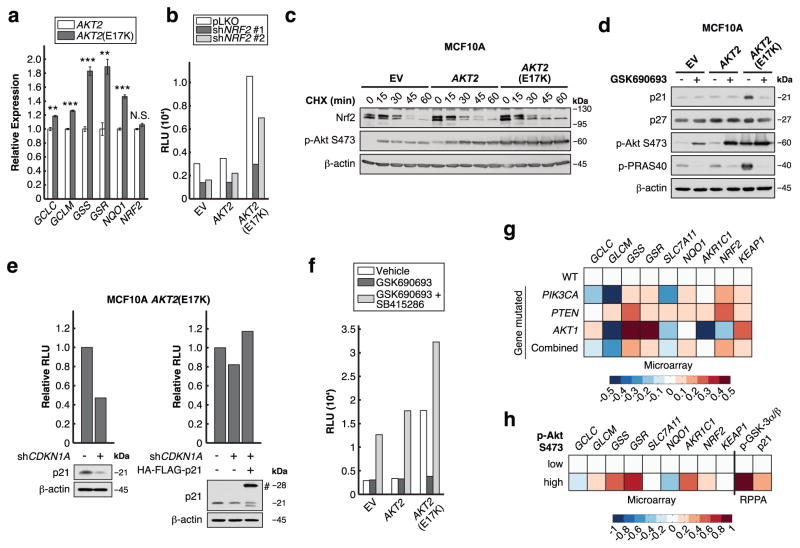
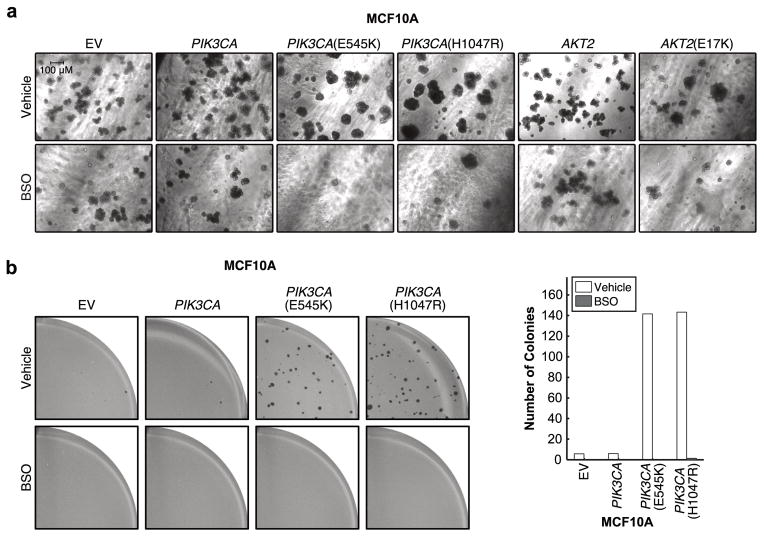
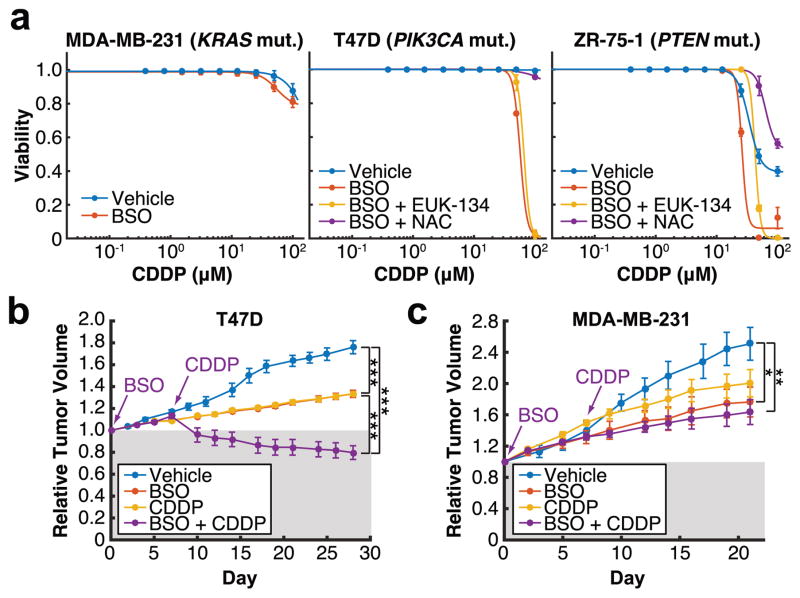
Cancer cells often select for mutations that enhance signalling through pathways that promote anabolic metabolism. Although the PI(3)K/Akt signalling pathway, which is frequently dysregulated in breast cancer, is a well-established regulator of central glucose metabolism and aerobic glycolysis, its regulation of other metabolic processes required for tumour growth is not well defined. Here we report that in mammary epithelial cells, oncogenic PI(3)K/Akt stimulates glutathione (GSH) biosynthesis by stabilizing and activating NRF2 to upregulate the GSH biosynthetic genes. Increased NRF2 stability is dependent on the Akt-mediated accumulation of p21(Cip1/WAF1) and GSK-3β inhibition. Consistently, in human breast tumours, upregulation of NRF2 targets is associated with PI(3)K pathway mutation status and oncogenic Akt activation. Elevated GSH biosynthesis is required for PI(3)K/Akt-driven resistance to oxidative stress, initiation of tumour spheroids, and anchorage-independent growth. Furthermore, inhibition of GSH biosynthesis with buthionine sulfoximine synergizes with cisplatin to selectively induce tumour regression in PI(3)K pathway mutant breast cancer cells, both in vitro and in vivo. Our findings provide insight into GSH biosynthesis as a metabolic vulnerability associated with PI(3)K pathway mutant breast cancers.
Conflict of interest statement
L.C.C. owns equity in, receives compensation from, and serves on the Board of Directors and Scientific Advisory Board of Agios Pharmaceuticals. Agios Pharmaceuticals is identifying metabolic pathways of cancer cells and developing drugs to inhibit such enzymes to disrupt tumor cell growth and survival.
Figures
Comment in
-
Making sense of reAKTive oxygen species.Cell Death Differ. 2016 Aug;23(8):1269-70. doi: 10.1038/cdd.2016.57. Epub 2016 Jun 17. Cell Death Differ. 2016. PMID: 27315299 Free PMC article. No abstract available.
Similar articles
-
Multidrug resistance-associated protein 1 mediates 15-deoxy-Δ(12,14)-prostaglandin J2-induced expression of glutamate cysteine ligase expression via Nrf2 signaling in human breast cancer cells.Chem Res Toxicol. 2011 Aug 15;24(8):1231-41. doi: 10.1021/tx200090n. Epub 2011 Jul 25. Chem Res Toxicol. 2011. PMID: 21728338
-
[Wogonoside reverses cisplatin resistance in SGC7901/cDDP cells through inhibition of PI3K/Akt/Nrf2/ARE signaling pathway].Sheng Li Xue Bao. 2018 Aug 25;70(4):397-405. Sheng Li Xue Bao. 2018. PMID: 30112565 Chinese.
-
14, 15-EET induces breast cancer cell EMT and cisplatin resistance by up-regulating integrin αvβ3 and activating FAK/PI3K/AKT signaling.J Exp Clin Cancer Res. 2018 Feb 9;37(1):23. doi: 10.1186/s13046-018-0694-6. J Exp Clin Cancer Res. 2018. PMID: 29426357 Free PMC article.
-
Osteopontin: it's role in regulation of cell motility and nuclear factor kappa B-mediated urokinase type plasminogen activator expression.IUBMB Life. 2005 Jun;57(6):441-7. doi: 10.1080/15216540500159424. IUBMB Life. 2005. PMID: 16012053 Review.
-
PTEN/PTENP1: 'Regulating the regulator of RTK-dependent PI3K/Akt signalling', new targets for cancer therapy.Mol Cancer. 2018 Feb 19;17(1):37. doi: 10.1186/s12943-018-0803-3. Mol Cancer. 2018. PMID: 29455665 Free PMC article. Review.
Cited by
-
Targeting AKT-Dependent Regulation of Antioxidant Defense Sensitizes AKT-E17K Expressing Cancer Cells to Ionizing Radiation.Front Oncol. 2022 Jul 8;12:920017. doi: 10.3389/fonc.2022.920017. eCollection 2022. Front Oncol. 2022. PMID: 35875130 Free PMC article.
-
Development of targeted therapy of NRF2high esophageal squamous cell carcinoma.Cell Signal. 2021 Oct;86:110105. doi: 10.1016/j.cellsig.2021.110105. Epub 2021 Aug 4. Cell Signal. 2021. PMID: 34358647 Free PMC article. Review.
-
Design and synthesis of isothiocyanate-containing hybrid androgen receptor (AR) antagonist to downregulate AR and induce ferroptosis in GSH-Deficient prostate cancer cells.Chem Biol Drug Des. 2021 May;97(5):1059-1078. doi: 10.1111/cbdd.13826. Epub 2021 Jan 26. Chem Biol Drug Des. 2021. PMID: 33470049 Free PMC article.
-
PI3K drives the de novo synthesis of coenzyme A from vitamin B5.Nature. 2022 Aug;608(7921):192-198. doi: 10.1038/s41586-022-04984-8. Epub 2022 Jul 27. Nature. 2022. PMID: 35896750 Free PMC article.
-
Dezocine relieves the postoperative hyperalgesia in rats through suppressing the hyper-action of Akt1/GSK-3β pathway.Exp Brain Res. 2022 May;240(5):1435-1444. doi: 10.1007/s00221-022-06341-7. Epub 2022 Mar 25. Exp Brain Res. 2022. PMID: 35333956
References
-
- Engelman JA. Targeting PI3K signalling in cancer: opportunities, challenges and limitations. Nat Rev Cancer. 2009;9:550–562. - PubMed
-
- Elstrom RL, et al. Akt stimulates aerobic glycolysis in cancer cells. Cancer Res. 2004;64:3892–3899. - PubMed
-
- Carpten JD, et al. A transforming mutation in the pleckstrin homology domain of AKT1 in cancer. Nature. 2007;448:439–444. - PubMed
Publication types
MeSH terms
Substances
Grants and funding
LinkOut - more resources
Full Text Sources
Other Literature Sources
Medical
Research Materials
Miscellaneous
