. 2016;16(6):8.
doi: 10.1167/16.6.8.

Spatio-temporal properties of letter crowding

Spatio-temporal properties of letter crowding

Susana T L Chung. J Vis. 2016.

Abstract

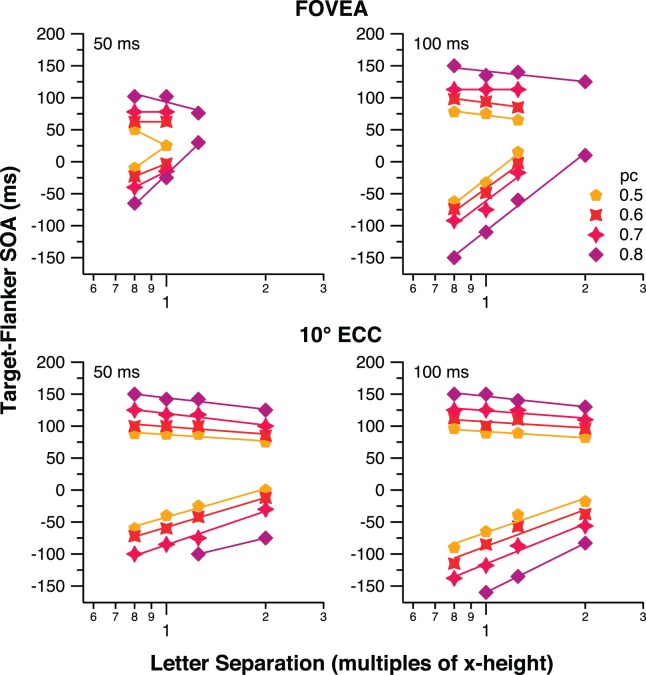
Crowding between adjacent letters has been investigated primarily as a spatial effect. The purpose of this study was to investigate the spatio-temporal properties of letter crowding. Specifically, we examined the systematic changes in the degradation effects in letter identification performance when adjacent letters were presented with a temporal asynchrony, as a function of letter separation and between the fovea and the periphery. We measured proportion-correct performance for identifying the middle target letter in strings of three lowercase letters at the fovea and 10° in the inferior visual field, for a range of center-to-center letter separations and a range of stimulus onset asynchronies (SOA) between the target and flanking letters (positive SOAs: target preceded flankers). As expected, the accuracy for identifying the target letters reduces with decreases in letter separation. This crowding effect shows a strong dependency on SOAs, such that crowding is maximal between 0 and ∼100 ms (depending on conditions) and diminishes for larger SOAs (positive or negative). Maximal crowding does not require the target and flanking letters to physically coexist for the entire presentation duration. Most importantly, crowding can be minimized even for closely spaced letters if there is a large temporal asynchrony between the target and flankers. The reliance of letter identification performance on SOAs and how it changes with letter separations imply that the crowding effect can be traded between space and time. Our findings are consistent with the notion that crowding should be considered as a spatio-temporal, and not simply a spatial, effect.


Figures

Figure 1
Figure 1
A schematic cartoon depicting two sample trials with a negative (A) and a positive (B) target-flanker SOA, respectively. A negative SOA means that the two flanking letters (in this example, letters n and u) appear before the target letter (x in this example); whereas a positive SOA means that the target letter (p in this example) appears before the two flanking letters (o and e in this example).
Figure 2
Figure 2
Proportion-correct for identifying the target letter is plotted as a function of the target-flanker SOA (in ms) for the three observers (columns 1–3), for letter exposure duration of 50 ms. The rightmost column shows the group data pooled across the three observers. Data obtained at the fovea are presented in the upper panels while data obtained at 10° in the inferior visual field are presented in the bottom panels. In each panel, results are plotted separately for the four nominal letter separations (coded by different colored symbols). The black dashed line in each panel represents the accuracy of identifying single letters. Error bars represent the standard errors of proportion.
Figure 3
Figure 3
Proportion-correct data as shown in Figure 2 are transformed into differences in z-score units (see text for details), as a quantitative measurement of the crowding magnitude. A z-score unit of 0 implies that there is no performance difference in identifying flanked target letters and single letters, in other words, there is no crowding. Each panel shows data from one observer (the last panel in each row shows the group data pooled across the three observers) tested at the fovea (upper panels) or 10° in the inferior visual field (bottom panels). Results for the four nominal letter separations are plotted in different colored symbols, as in Figure 2. The smooth curve through each set of color symbols represents the best-fit asymmetric Gaussian function (see text for details).
Figure 4
Figure 4
Proportion-correct for identifying the target letter is plotted as a function of the target-flanker SOA, for letter exposure duration of 100 ms. Details of the figure are as in Figure 2.
Figure 5
Figure 5
Data shown in Figure 4 are replotted with proportion-correct transformed into differences in z-score units (see text for details). Details of the figure are as in Figure 3.
Figure 6
Figure 6
Criterion target-flanker SOA (in ms) is plotted as a function of nominal letter separation, for the two letter exposure durations (left: 50 ms; right: 100 ms), for data obtained at the fovea (upper panels) and 10° inferior visual field (lower panels). Each datum is derived from the fitted curve shown in Figures 3 or 5, based on the group data, and represents the combination of SOA and letter separation that yields a given criterion performance, which is color-coded for proportion correct (pc) of 0.5, 0.6, 0.7, or 0.8. Straight line through each set of colored symbols in each panel represents the best-fit line (on semilog axes). Slopes of these lines (only for data-sets with more than two data points) are given in Table 2.
Figure 7
Figure 7
The size of the temporal window of crowding (ms) is plotted as a function of the absolute letter separation. Data shown represent the spatiotemporal limit beyond which crowding is not observed, for a letter exposure duration of 50 ms. Dashed and solid lines represent the best-fit line (on linear-log axes) to the foveal and 10° eccentricity data, respectively.
Figure 8
Figure 8
A schematic of how the dual-channel inhibition model can explain our data, for the scenarios when the target appears before a flanker (left: positive SOA) and when a flanker appears before the target (right: negative SOA). In each scenario, the top two traces represent the time-courses of the target and a flanking letter. The bottom two traces represent the time-courses of the neural signals generated by the target and the flanker. Each letter generates two signals—a shorter-latency transient one (T) and a longer-latency sustained one (S). (A) When the target appears before a flanker, if the flanker is offset from the target letter by an SOA such that the transient signal generated by the flanker coexists with the sustained signal arising from the target letter, the transient signal from the flanker can interfere with the sustained signal from the target letter. This is referred to as the interchannel inhibition. Depending on the SOA, in some cases, the sustained signal from the flanker may also coexist with the sustained signal from the target (intrachannel inhibition), thus causing interaction. The interference of the sustained signal of the target would primarily affect the identity information of the target. (B) When the flanker appears before the target, the transient signal from the flanker cannot interfere with the signals generated by the target, but the sustained signal from the flanker may interfere with the transient signal of the target (inter channel inhibition), affecting primarily the position information of the target. The sustained signal from the flanker may also interfere with the sustained signal of the target (intrachannel inhibition), affecting the identity information of the target.
Figure 9
Figure 9
Rate of mislocation error (see text for definition) is plotted as a function of target-flanker SOA for the two letter exposure durations (left: 50 ms; right: 100 ms), for data obtained at the fovea (upper panels) and 10° inferior visual field (lower panels). In each panel, data are shown for the four letter separations. Data plotted are pooled across the three observers.

References

    1. Banks, W. P.,, Bachrach K. M.,, Larson D. W. (1977). The asymmetry of lateral inference in visual letter identification. Perception & Psychophysics, 22, 232–240.
    1. Bates D.,, Maechler M.,, Bolker B.,, Walker S. (2015). Fitting linear mixed-effects models using lme4. Journal of Statistical Software, 67, 1–48.
    1. Bernard J.-B.,, Chung S. T. L. (2011). The dependence of crowding on flanker complexity and target-flanker similarity. Journal of Vision, 11(8): 1, 1–16, doi:10.1167/11.8.1 [PubMed] [Article] - PMC - PubMed
    1. Bi T.,, Cai P.,, Zhou T.,, Fang F. (2009). The effect of crowding on orientation-selective adaptation in human early visual cortex. Journal of Vision, 9(11): 13, 1–10, doi:10.1167/9.11.13 [PubMed] [Article] - PubMed
    1. Bouma H. (1970). Interaction effects in parafoveal letter recognition. Nature, 226, 177–178. - PubMed

Publication types