. 2016 May;22(5):547-56.
doi: 10.1038/nm.4087. Epub 2016 Apr 18.

Human induced pluripotent stem cell-derived cardiomyocytes recapitulate the predilection of breast cancer patients to doxorubicin-induced cardiotoxicity

Affiliations

Human induced pluripotent stem cell-derived cardiomyocytes recapitulate the predilection of breast cancer patients to doxorubicin-induced cardiotoxicity

Paul W Burridge et al. Nat Med. 2016 May.

Abstract

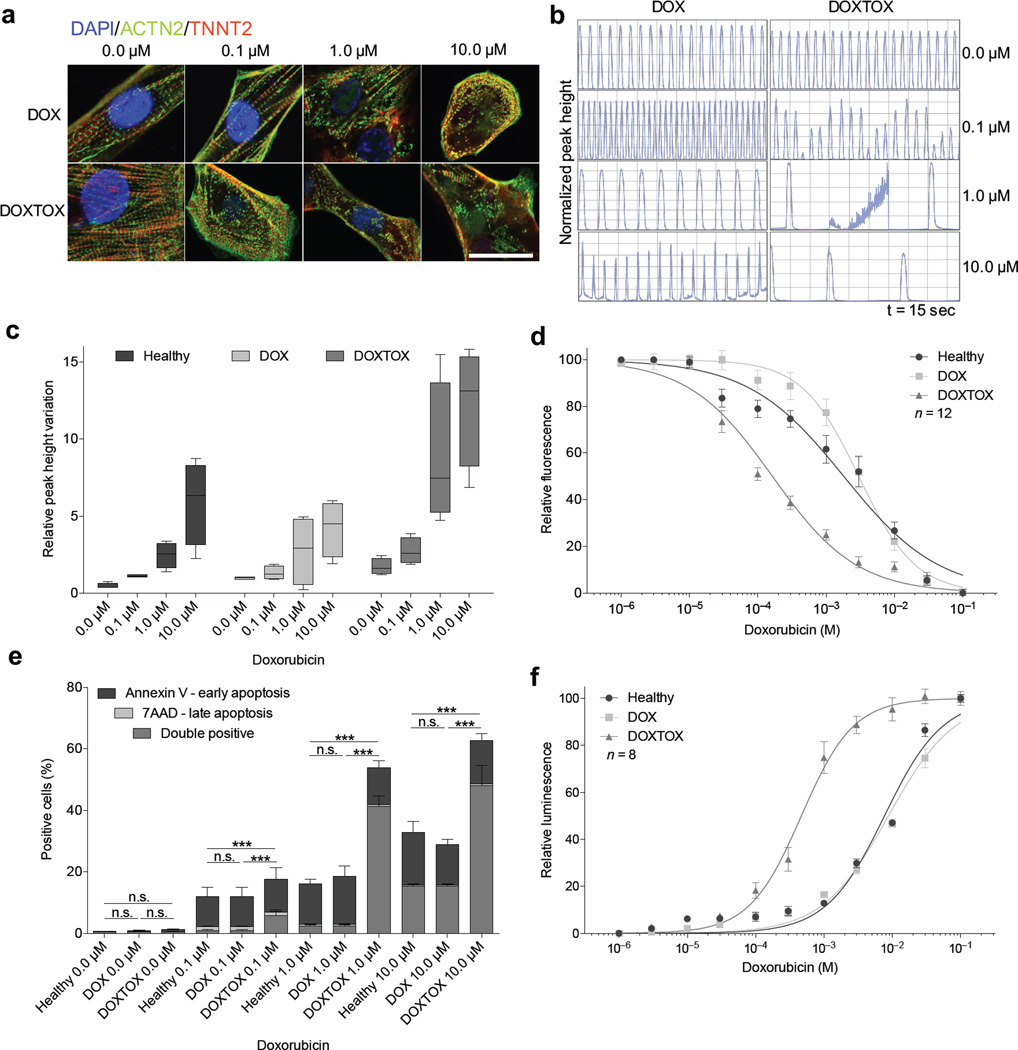
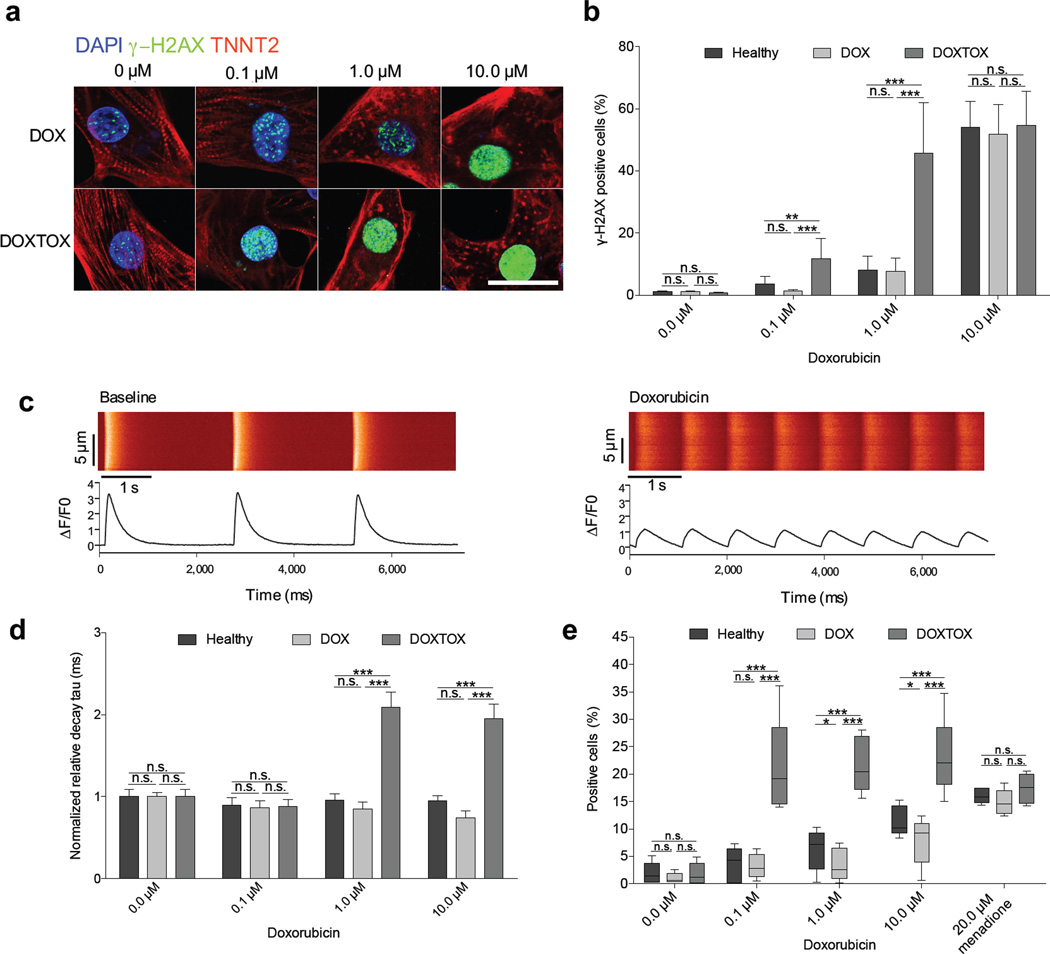
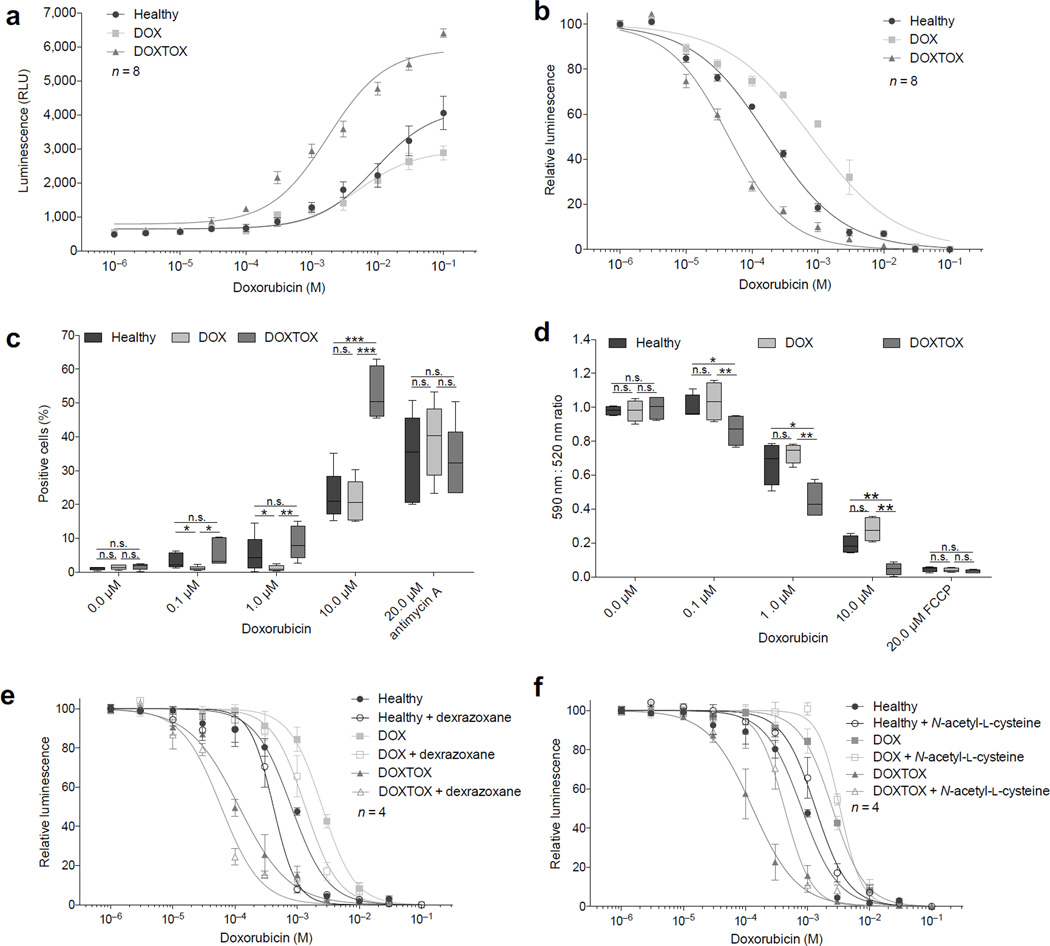
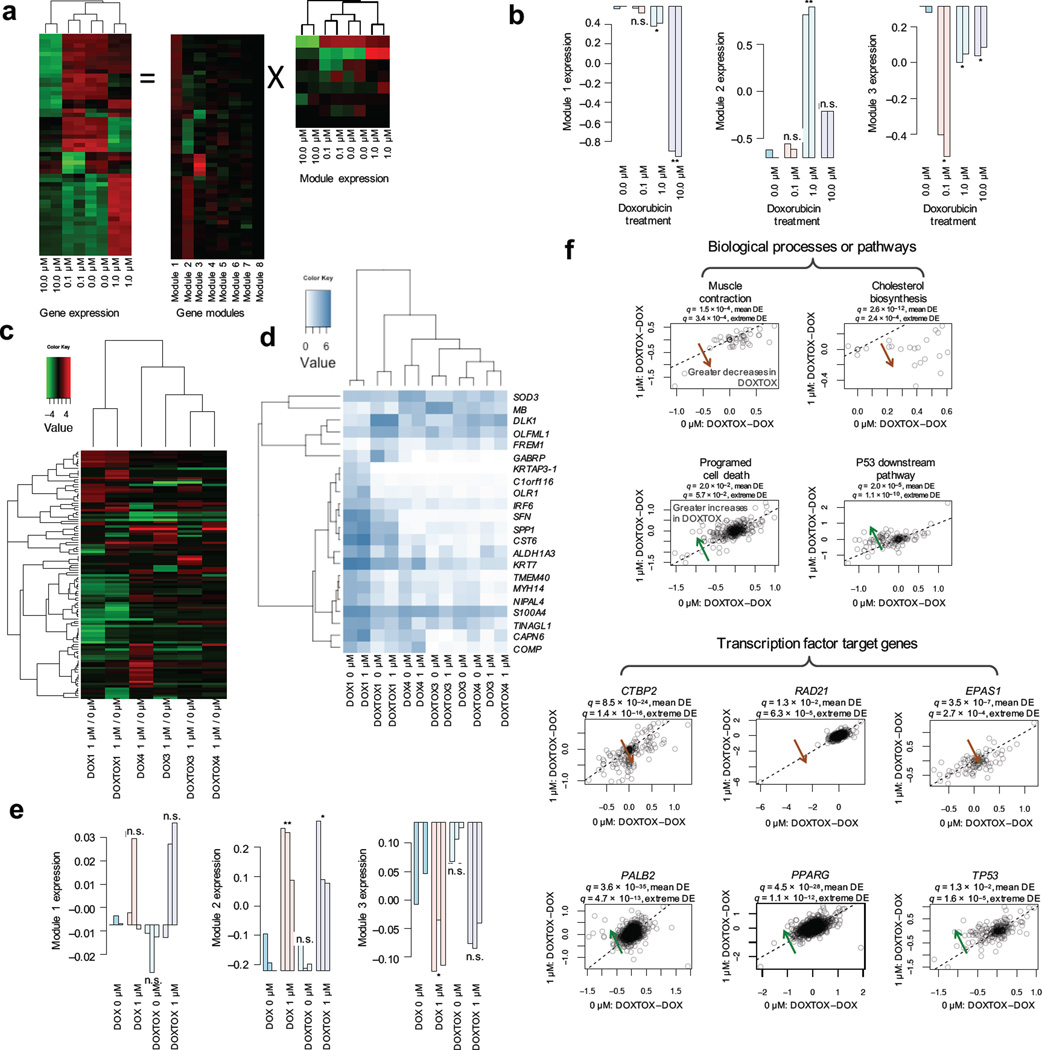
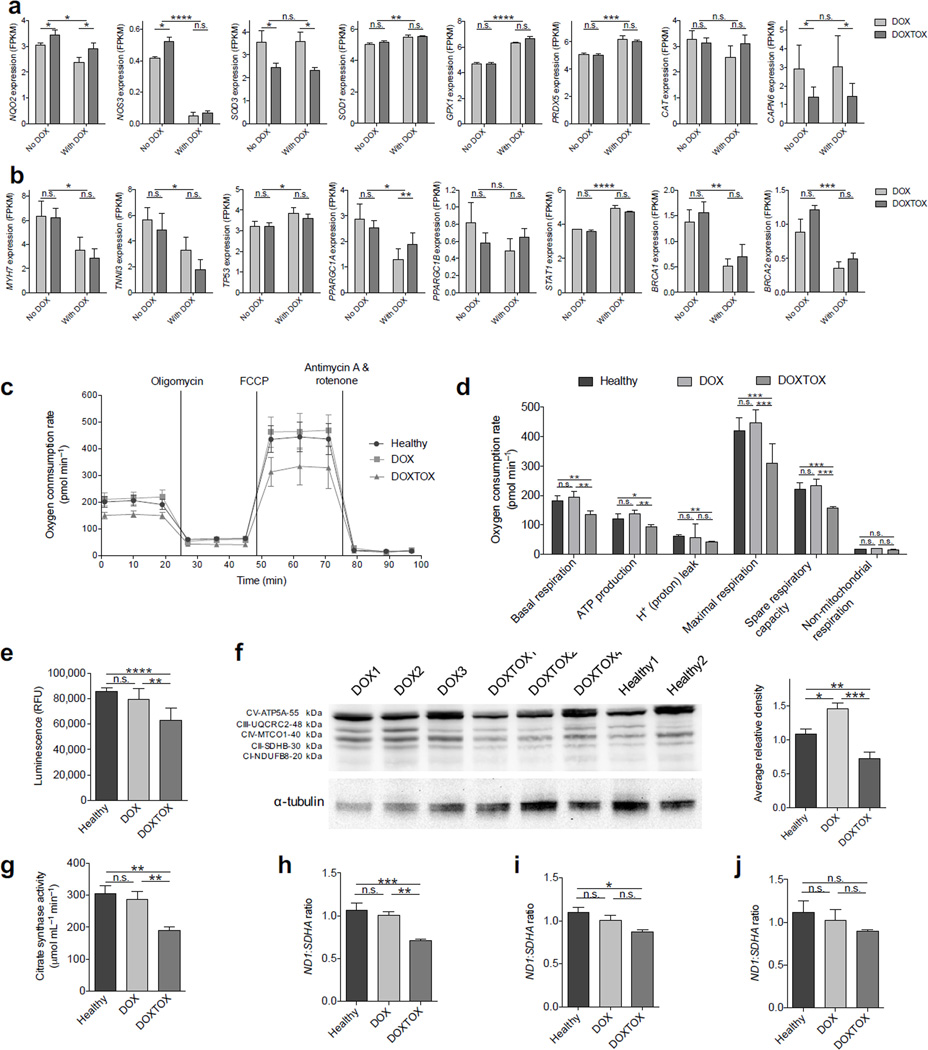
Doxorubicin is an anthracycline chemotherapy agent effective in treating a wide range of malignancies, but it causes a dose-related cardiotoxicity that can lead to heart failure in a subset of patients. At present, it is not possible to predict which patients will be affected by doxorubicin-induced cardiotoxicity (DIC). Here we demonstrate that patient-specific human induced pluripotent stem cell-derived cardiomyocytes (hiPSC-CMs) can recapitulate the predilection to DIC of individual patients at the cellular level. hiPSC-CMs derived from individuals with breast cancer who experienced DIC were consistently more sensitive to doxorubicin toxicity than hiPSC-CMs from patients who did not experience DIC, with decreased cell viability, impaired mitochondrial and metabolic function, impaired calcium handling, decreased antioxidant pathway activity, and increased reactive oxygen species production. Taken together, our data indicate that hiPSC-CMs are a suitable platform to identify and characterize the genetic basis and molecular mechanisms of DIC.


Figures

Figure 1
Figure 1
Assessment of in vitro doxorubicin–induced cardiotoxicity in patient–specific hiPSC–CMs. (a) Immunofluorescent staining for α–actinin (ACTN2) and cardiac troponin T (TNNT2) to demonstrate sarcomeric organization in hiPSC–CMs derived from patients who did not experience doxorubicin–induced cardiotoxicity (DOX) versus those who did experience doxorubicin-induced cardiotoxicity (DOXTOX) after 24 h treatment with doxorubicin. Scale bar, 20 µm. (b) Representative camera–capture contraction assay demonstrating variation in beat frequency in response to doxorubicin after 24 h treatment with doxorubicin (hiPSC–CMs from lines DOX1 and DOXTOX4 shown). (c) Camera–capture contraction assay demonstrating variation on relative peak high in response to doxorubicin in Heathy, DOX, and DOXTOX hiPSC–CMs after 24 h treatment with doxorubicin. Each data point represents four hiPSC–CM lines repeated three times (n = 12). (d) Effect of doxorubicin (72 h) on hiPSC–CM viability (n = 12). LD50: Healthy, 1.82 µM; DOX, 3.015 µM; DOXTOX, 0.1643 µM. (e) Detection of early and late apoptosis in hiPSC–CMs after 72 h treatment with doxorubicin (n = 4). Unpaired two–tailed t–test with *P < 0.05, **P < 0.01, ***P < 0.005, n.s. = not significant. (f) Effect of doxorubicin (72 h) on caspase 3 and 7 expression (n = 8). Error bars represent standard error of the mean (s.e.m.)
Figure 2
Figure 2
Assessment of the effect of doxorubicin on DNA damage, calcium handling, and whole–cell oxidative stress in patient–specific hiPSC–CMs. (a) Detection of DNA double–stranded breaks using immunofluorescent staining for γ–H2AX after 24 h doxorubicin. Scale bar, 20 µm. (b) Quantification of γ–H2AX staining by flow cytometry (n = 4). (c) Representative recording of spontaneous calcium activity of patient–derived hiPSC–CMs at baseline or treated with doxorubicin, DOXTOX1 shown. (d) Normalized relative decay tau of calcium imaging. Each data point represents an average of four hiPSC–CM lines (n > 35 cells cells per line). Groups were normalized to 0 µM healthy group. Comparisons were conducted via Fisher’s exact test, one way–ANOVA test followed by All Pairwise Multiple Comparison Procedures (Holm–Sidak method). (e) Assessment of the effect of 24 h doxorubicin treatment (before cell death) on whole cell reactive oxygen species (ROS) levels using CellROX. Unpaired two–tailed t–test with *P < 0.05, **P < 0.01, ***P < 0.005, n.s. = not significant. Error bars represent s.e.m.
Figure 3
Figure 3
Assessment of the effect of doxorubicin on oxidative stress in patient–specific hiPSC–CMs. (a) Assessment of the effect of 24 h doxorubicin treatment on hydrogen peroxide (H2O2) levels. (b) Assessment of the effect of 24 h doxorubicin treatment on the presence of the antioxidant glutathione (GSH) levels. (c) Assessment of the effect of 24 h doxorubicin treatment on mitochondrial superoxide (but not other reactive oxygen or nitrogen species) levels. (d) Assessment of the effect of 24 h doxorubicin treatment on mitochondrial membrane potential. (e) ATP–based cell viability assay demonstrating the effect of 72 h treatment of doxorubicin in the presence of iron chelator dexrazoxane (DRZ). (f) ATP–based cell viability assay demonstrating the effect of 72 h treatment of doxorubicin in the presence of antioxidant N–acetyl–L–cysteine (NAC) in response to doxorubicin. Unpaired two–tailed t–test with *P < 0.05, **P < 0.01, ***P < 0.005, n.s. = not significant. Error bars represent s.e.m.
Figure 4
Figure 4
Modulation of gene expression in hiPSC–CMs by doxorubicin. (a) Functional gene modules of transcriptional responses following doxorubicin treatment of cardiomyocytes. Illustration of the ICA decomposition of gene expression data (showing 51 most varied genes) into the linear combination of multiple statistically independent gene modules. (b) The first three gene modules are significantly associated with doxorubicin dosages. Module 1, oxidation and hypoxia stress response and enrichment of genes related to heart morphogenesis. Module 2, inflammation and DNA damage repair. Module 3, cell cycle arrest and apoptosis. (c) Differential gene expression in DOX and DOXTOX hiPSC lines after treatment with 1 µM doxorubicin for 24 h normalized to baseline expression (12 samples total). (d) Heatmap of top genes significantly and differentially expressed between DOX and DOXTOX hiPSC–CMs after doxorubicin treatment. (e) Relationship between DOX and DOXTOX with 1 µM doxorubicin results and gene expression modules, demonstrating strong correlation between modules 2 and 3. (f) Scatter plots of the DOXTOX to DOX patient differences at 1 µM of doxorubicin (y–axis) vs. the differences at 0 µM of doxorubicin (x–axis) for selected biological processes, pathways, and transcription factors. A systematic deviation from the diagonal (dashed line) suggests patient–specific responses upon doxorubicin treatment. Significance of a given gene set (e.g., biological process, pathway or TF target gene set) is evaluated in two ways, namely mean differential expression and extreme differential expression. For mean differential expression (DE), we test if delta–delta–expression (y–x) has identical means for the member genes of the gene set against other genes using t–test. For extreme differential expression, we test if extreme delta–delta–expression values are enriched for member genes of the gene set using Fisher’s exact test. Significant: multi–test corrected P–value < 0.05.
Figure 5
Figure 5
Assessment of the baseline mitochondrial function in patient–specific hiPSC–CMs. (a) Expression of ROS– ands calcium overload–related genes differentially expressed in DOX and DOXTOX hiPSC–CMs after exposure to doxorubicin. (b) Expression of sarcomeric proteins, apoptosis markers, TOP2B related PGC1–α and PGC1–β, STAT, and BRCA–related genes differentially expressed in DOX and DOXTOX hiPSC–CMs after exposure to doxorubicin. No doxorubicin vs. with doxorubicin, two–way ANOVA. DOX vs. DOXTOX, t–test. *P < 0.05, **P < 0.01, ***P < 0.005, ****P < 0.001, n.s. = not significant. Error bars represent s.e.m. (c) Representative Seahorse extracellular flux assay measuring oxygen consumption rate (OCR). (d) Analysis of Seahorse extracellular flux assay demonstrating lower levels of oxygen consumption in DOXTOX hiPSC–CMs at baseline (i.e., without doxorubicin treatment) in comparison to DOX hiPSC–CMs (n = 12). (e) Quantification of ATP levels in 100,000 hiPSC–CMs (n = 8 hiPSC–CM samples). (f) Western blotting for select proteins involved in oxidative phosphorylation and graph with quantification of average releative density of Western blot data. (g) Citrate synthase assay to measure the baseline presence of intact mitochondria in 5 million iPSC-CMs (n = 8, each data point is an average of four cell lines with two experimental replicates). (h) Quantification of mitochondria encoded Complex I ND1 DNA ratio to nuclear encoded complex II SDHA DNA in healthy control patient, DOX, and DOXTOX hiPSC–CMs (n = 4). (i) ND1:SDHA expression ratio in DOX and DOXTOX patient fibroblasts and healthy (non–doxorubicin treated) patient fibroblasts (n = 4). (j) Average ND1:SDHA expression ratio in four Healthy, four DOX, and four DOXTOX hiPSC lines (n = 3). Paired two–tailed t–test with *P < 0.05, **P < 0.01, ***P < 0.005, n.s. = not significant. Error bars represent s.e.m.
Figure 6
Figure 6
Schematic of findings in relationship to the established DIC pathways. Numbered cyan boxes demonstrate our findings. Doxorubicin (DOX), doxorubinol (DOX–ol), doxorubicin–semiquinone (DOX–semiquinone), C7 centered radical aglycone (C7 radical), nitric oxide synthase 3 (NOS3), NADH dehydrogenases (collectively NAD(P)H oxidoreductases), P450 (cytochrome) oxidoreductase (POR), xanthine oxidase (XDH) superoxide radical (O2–•), hydrogen peroxide (H2O2), hydroxyl radical (OH•), nitric oxide (NO•), peroxynitrite (ONOO–), superoxide dismutase (SOD), catalase (CAT), glutathione (GSH), glutathione peroxide (GSH), glutathione disulfide (GSSG), peroxiredoxin (PRDX), myoglobin (MB), ferrous iron (Fe2+), ferric iron (Fe3+), dexrazoxane (DRZ), N–acetyl–L–cysteine (NAC), topoisomerase (DNA) 1 mitochondrial (TOP1MT), BCL2–associated X protein (BAX), cytochrome C (CYCS) tumor protein p53 (TP53), topoisomerase 2B (TOP2B), ryanodine receptor 2 (RYR2), ATPase, Ca2+ transporting, cardiac muscle slow twitch 2 (ATP2A2), myosin light chain (MYL), cardiac troponin T (TNNT), α–actinin (ACTA), peroxisome proliferator-activated receptor gamma, coactivator 1–α (PPARGC1A) and peroxisome proliferator-activated receptor gamma, coactivator 1–β (PPARGC1B)

Comment in

References

    1. Lipshultz SE, Franco VI, Miller TL, Colan SD, Sallan SE. Cardiovascular disease in adult survivors of childhood cancer. Annu. Rev. Med. 2015;66:161–176. - PMC - PubMed
    1. Giordano SH, Lin Y-L, Kuo YF, Hortobagyi GN, Goodwin JS. Decline in the use of anthracyclines for breast cancer. J. Clin. Oncol. 2012;30:2232–2239. - PMC - PubMed
    1. Lefrak EA, Pitha J, Rosenheim S, Gottlieb JA. A clinicopathologic analysis of adriamycin cardiotoxicity. Cancer. 1973;32:302–314. - PubMed
    1. Hoff, Von DD, et al. Risk factors for doxorubicin-induced congestive heart failure. Ann. Intern. Med. 1979;91:710–717. - PubMed
    1. Swain SM, Whaley FS, Ewer MS. Congestive heart failure in patients treated with doxorubicin: a retrospective analysis of three trials. Cancer. 2003;97:2869–2879. - PubMed

ONLINE REFERENCES

    1. Melkoumian Z, et al. Synthetic peptide-acrylate surfaces for long-term self-renewal and cardiomyocyte differentiation of human embryonic stem cells. Nat. Biotech. 2010;28:606–610. - PubMed
    1. Chen G, et al. Chemically defined conditions for human iPSC derivation and culture. Nat. Methods. 2011;8:424–429. - PMC - PubMed
    1. Fusaki N, Ban H, Nishiyama A, Saeki K, Hasegawa M. Efficient induction of transgene-free human pluripotent stem cells using a vector based on Sendai virus, an RNA virus that does not integrate into the host genome. Proc. Jpn. Acad., Ser. B. 2009;85:348–362. - PMC - PubMed
    1. Mali P, et al. Butyrate Greatly Enhances Derivation of Human Induced Pluripotent Stem Cells by Promoting Epigenetic Remodeling and the Expression of Pluripotency-Associated Genes. Stem Cells. 2010;28:713–720. - PMC - PubMed
    1. Thomson JA. Embryonic Stem Cell Lines Derived from Human Blastocysts. Science. 1998;282:1145–1147. - PubMed

Publication types

MeSH terms