. 2016 Apr 19:6:24544.
doi: 10.1038/srep24544.

High Resolution Dissection of Reactive Glial Nets in Alzheimer's Disease

Affiliations

High Resolution Dissection of Reactive Glial Nets in Alzheimer's Disease

David S Bouvier et al. Sci Rep. .

Abstract

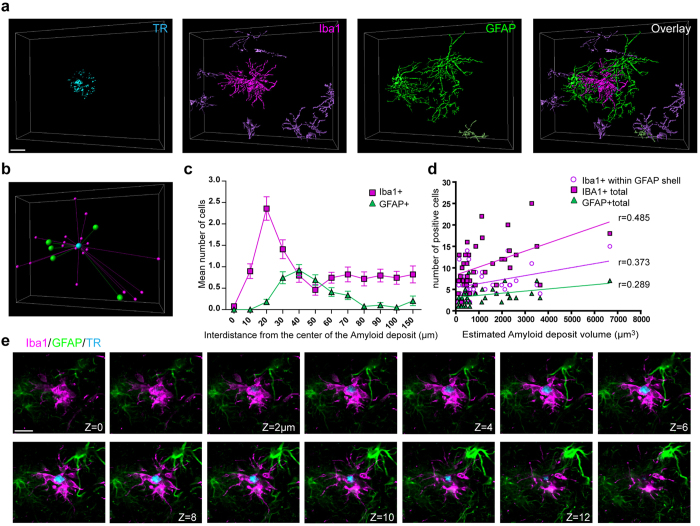
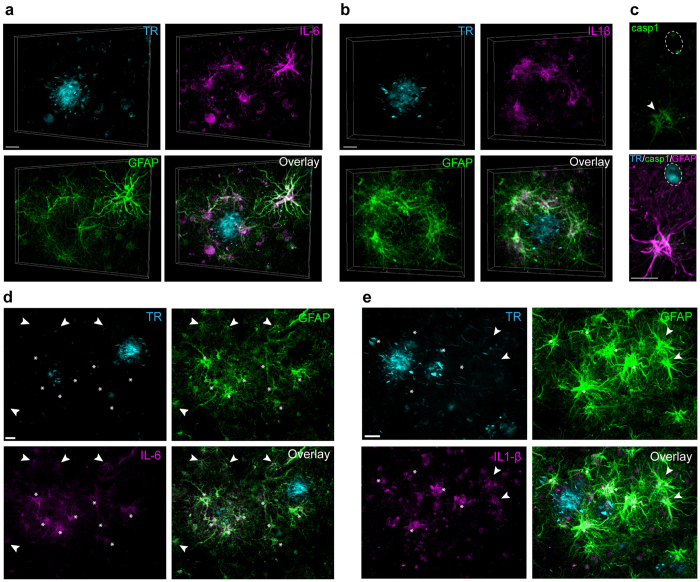
Fixed human brain samples in tissue repositories hold great potential for unlocking complexities of the brain and its alteration with disease. However, current methodology for simultaneously resolving complex three-dimensional (3D) cellular anatomy and organization, as well as, intricate details of human brain cells in tissue has been limited due to weak labeling characteristics of the tissue and high background levels. To expose the potential of these samples, we developed a method to overcome these major limitations. This approach offers an unprecedented view of cytoarchitecture and subcellular detail of human brain cells, from cellular networks to individual synapses. Applying the method to AD samples, we expose complex features of microglial cells and astrocytes in the disease. Through this methodology, we show that these cells form specialized 3D structures in AD that we refer to as reactive glial nets (RGNs). RGNs are areas of concentrated neuronal injury, inflammation, and tauopathy and display unique features around β-amyloid plaque types. RGNs have conserved properties in an AD mouse model and display a developmental pattern coinciding with the progressive accumulation of neuropathology. The method provided here will help reveal novel features of the healthy and diseased human brain, and aid experimental design in translational brain research.


Figures

Figure 1
Figure 1. A broadly accessible, systematic method to study neurons and glia in human brain samples recovered from long-term storage.
(a) The staining of pan-axonal neurofilaments (SMI312) reveals the general organization of neurons in cortical sections (female, 86 years old, 25 years of fixation). (b) Calbindin expressing interneurons are enriched in layers I/II of the human cortex (male, 88 years old, 19 years of fixation) and show diversified morphologies after 3D reconstruction. (c) High-resolution imaging of synapses in cortex (female, 82 years old, 15 years of fixation) shows vGlut1-positive presynaptic boutons (magenta) juxtaposed to PSD95-positive postsynaptic structures (green) (synapses indicated by arrows). (d) Maximum projection of a large field showing 1,95 mm2 (x:1.95 mm, y:0.9 mm) of tissue with a 30 μm depth labeled for Iba1 (microglia; magenta) and GFAP (astrocytes; green). (e) High magnification image of a GFAP-positive astrocyte ‘island’ in a cortical section. (f) 3-dimensional reconstructions of cortical protoplasmic GFAP+ astrocytes and Iba1+ microglia (female, 86 years old). (g) GFAP+ astrocytes (green) and Iba1+ microglia (magenta) in cortical layers III/IV show complex interactions in a control brain (female, 86 years old), resolvable by visualizing individual frames of confocal Z-stacks (step-size: 1 μm). Scale bars: 50 μm (a); 20 μm (b); 5 μm (c); 200 μm (d); 10 μm (eg).
Figure 2
Figure 2. Exposing macro- and microscopic AD pathology in post-mortem brain samples.
(a) Maximum projection of a vertical column of cortical tissue (5.1 mm X 0.468 mm and 40 μm thick) from an AD patient brain samples (female, 85 years old) and labeled with an AT8 antibody (Phospho-PHF-tau pSer202+Thr205) and Thiazine-red (TR) that reveal Aβ plaques, PHF, and NFTs. (b,c) Individual maximum projections of image fields from panel (a). (d) Maximum projection showing a 4.6 mm2 (x: 2.35 mm, y: 1.95 mm) of temporal cortex from an AD sample (male, 87 years old) with a 30 μm imaging depth and labeled for Iba1 (microglia; magenta), GFAP (astrocytes; green), and Thiazine-Red (plaques, cyan). TR staining reveals the presence of subgroups of plaques/aggregates. The dense-core Aβ plaques (C, dashed white hexagons) are the most numerous while larger fibrillar amyloid plaques (F, dashed yellow squares) are found in older patients. PHF aggregates are also frequently observed (P, dashed orange triangles). Iba1+ cell clusters are detected around dense-core and fibrillar plaques but are absent around PHF aggregates. Coronas of reactive astrocytes are observed around the 3 types of plaques/aggregates. (e,f) General distribution of Iba1+ microglia in control and AD brain tissue (1 mm2). Topological density of Iba1-positive microglia before and after Voronoi segmentation, in which individual microglia territories are color-coded according to their surface area. The homogeneity of microglial cell distribution that we have measured in the healthy brain (left) is disrupted by the presence of plaques (right) in AD brain with individual microglial territories becoming smaller near plaques (darker areas) and larger in adjacent areas (lighter areas), suggest microglial cell aggregation near deposits and their depletion from adjacent areas. Scale bars: 200 µm (a) 20 µm (b,c).
Figure 3
Figure 3. Specialized Reactive Glial Nets (RGNs) form around dense-core Aβ plaques in AD cortex.
(a) 3-dimensional reconstruction of a confocal Z-stack showing GFAP+ reactive astrocytes (green) and Iba1+ microglia (magenta) surrounding a Thiazine red-labeled dense-core Aβ plaque (cyan) in an AD patient (female, 77 year old). Note the TR-labeled fibrils surrounding the core of the plaque. (b) 3D analysis of astrocyte and microglia position around a dense-core plaque. (c,d) Quantification of the positioning of astrocytes and microglia relative to plaques and the positive correlation between astrocyte and microglial cell number and plaque size (n = 39). (e) Sequence of 14 successive z- focal planes (1 μm step size) showing amoeboid Iba1+ cells (magenta) enveloping the core of the plaque (cyan) and reactive astrocytes circumscribing them with processes. Note GFAP+ astrocytic processes are excluded from the microglial cell territory. Scale bars: 20 μm.
Figure 4
Figure 4. RGNs surrounding fibrillar Aβ plaques.
(a) 3D reconstruction of a confocal Z-stack showing GFAP+ reactive astrocytes (green) and Iba1+ microglia (magenta) surrounding Thiazine red-labeled fibrillar Aβ plaque (cyan) in a AD patient (male, 87 years old). (b) 3D analysis of astrocyte and microglia position around a fibrillar plaque. (c,d) Quantification of the positioning of astrocytes and microglia relative to plaques and the positive correlation between astrocyte and microglial cell number and plaque size. (n +18; r = 0.561 for total Iba1+ cells, r = 0.635 for Iba1+ cells within GFAP shell, and r = 0.479 for GFAP+ cells) (e) Comparison of dense-core and fibrillar plaque subtypes of interval of inter-distance of GFAP+ cells from plaques (F(1, 55) = 0.016; p = 0.8894), numbers of Iba1+ cells within the astrocyte shell of RGNs (F(1, 55) = 11.276; p < 0.001), and volume of the plaques (F(1, 55) = 19.841; p < 0.0001). ***p < 0.001: significantly different from dense-core plaque. (f) Sequence of 8 successive focal planes (2 μm step size) showing Iba1+ microglial (magenta) and GFAP+ astrocytes (green) with astrocytic processes (arrowheads) invading the Aβ fibrillar masse (cyan). Scale bars: 20 μm.
Figure 5
Figure 5. Mouse RGNs in the CRND8 AD model share features with human RGNs and associate with neuronal pathology and Tau granules.
(a) Time-course for the assembly of RGNs around Aβ deposits. At 2 months, low numbers of activated microglia and reactive astrocytes surround small Aβ deposits. At 4 months, well-constructed RGNs are found. By 12 months, organization of the RGN is degraded and amoeboid microglia and reactive astrocytes can be located distal to RGNs surrounding Aβ deposits. (b) 3D analysis of astrocyte and microglia position around Aβ deposits at mid-stages of the disease in the CRND8 model (3–5 months). (c) Graph showing the positive correlation between astrocyte and microglial cell number and Aβ deposit volume at mid-stages of the disease (r = 0.264 for total Iba1+ cells, r = 0.488 for Iba1+ cells within GFAP shell, and r = 0.561 for GFAP+ cells; pooled data, 3 to 5 month old mice). (d) Comparisons between plaques at mid- (3–5 months) and late-stages (8–9 months) of interval of inter-distance of GFAP+ cells from plaques (F(1, 57) = 14.635; p = 0.0003), numbers of Iba1+ cells within the astrocyte shell of the RGN (F(1, 57) = 7.725; p = 0.0074), and volume of the plaques (F(1, 57) = 5.425; p = 0.0234]. *p < 0.05, **p < 0.01 and ***p < 0.001). (eg) Abnormal neuronal processes (e; SMI 312+; magenta) and granules of hyperphosphorylated Tau (f,g); detected by two different phospho-Tau antibodies PS422 (magenta) and AT8 (green), associated with RGNs. (h) Expression of IL-6 (upper panel, magenta) and IL-1β (lower panel, magenta) by GFAP+ astrocytes (green, arrows) in CRND8 mice at 9 months. (i) Western blot analysis of overall increases in IL-6 and IL-1β expression (mature form at 17 kDa, arrowhead) in the cortex of transgenic mice at 1, 4 and 9 months (with n = 3 for control and Tg+ at 1 month, n = 4 for control and n = 3 for Tg+ at 4 months, and n=4 for control and n = 4 for Tg+ at 9 months). (j) IL-1β clusters (green) are closely juxtaposed to hyperphosphorylated Tau granules (AT8; magenta) in CRND8 mice. Scale bars: 20 μm (a,eh), 5 μm (j).
Figure 6
Figure 6. Human RGNs are associated with inflammation in AD.
(ac) RGN astrocytes in AD tissue express the pro-inflammatory cytokines IL-6 and IL-1β and the IL-1β processing enzyme Caspase 1. (a) 3D projection showing IL-6-expressing GFAP+ astrocytes near an Aβ plaque in AD cortex (male, 87 years old). Overlay shows IL-6 (magenta), GFAP (green), and Thiazine red (cyan). (b) 3D projection showing IL-1β expression (magenta) in GFAP+ astrocytes (green) around an Thiazine red-labeled Aβ plaque (cyan). (c) Reactive astrocytes (magenta) close to Aβ plaques (blue; dotted ellipse) also express the IL-1β processing enzyme Caspase 1 (green; arrowhead) in the same AD patient. (d,e) Astrocyte are sources of pro-inflammatory cytokines inside and outside RGNs: Examples of astrocytic IL-6 (d, magenta) and IL-1β (e, magenta) expression inside and outside RGNs with the local astrocyte network (GFAP+, green) in AD cortex. Scale bars: 20 μm (a,b,d,e), 10 μm (c).

References

    1. Hama H. et al. ScaleS: an optical clearing palette for biological imaging. Nat Neurosci. 18, 1518–29 (2015). - PubMed
    1. Chung K. et al. Structural and molecular interrogation of intact biological systems. Nature 497, 332–7 (2013). - PMC - PubMed
    1. Heneka M. T. et al. NLRP3 is activated in Alzheimer’s disease and contributes to pathology in APP/PS1 mice. Nature 493, 674–8 (2013). - PMC - PubMed
    1. Huang Y. & Mucke L. Alzheimer mechanisms and therapeutic strategies. Cell 148, 1204–22 (2012). - PMC - PubMed
    1. Bouvier D. S. & Murai K. K. Synergistic Actions of Microglia and Astrocytes in the Progression of Alzheimer’s Disease. J Alzheimers Dis. 45, 1001–14 (2015). - PubMed

Publication types