. 2016 Jun;22(6):867-82.
doi: 10.1261/rna.053561.115. Epub 2016 Apr 18.

Cytoplasmic long noncoding RNAs are frequently bound to and degraded at ribosomes in human cells

Affiliations

Cytoplasmic long noncoding RNAs are frequently bound to and degraded at ribosomes in human cells

Joana Carlevaro-Fita et al. RNA. 2016 Jun.

Abstract

Recent footprinting studies have made the surprising observation that long noncoding RNAs (lncRNAs) physically interact with ribosomes. However, these findings remain controversial, and the overall proportion of cytoplasmic lncRNAs involved is unknown. Here we make a global, absolute estimate of the cytoplasmic and ribosome-associated population of stringently filtered lncRNAs in a human cell line using polysome profiling coupled to spike-in normalized microarray analysis. Fifty-four percent of expressed lncRNAs are detected in the cytoplasm. The majority of these (70%) have >50% of their cytoplasmic copies associated with polysomal fractions. These interactions are lost upon disruption of ribosomes by puromycin. Polysomal lncRNAs are distinguished by a number of 5' mRNA-like features, including capping and 5'UTR length. On the other hand, nonpolysomal "free cytoplasmic" lncRNAs have more conserved promoters and a wider range of expression across cell types. Exons of polysomal lncRNAs are depleted of endogenous retroviral insertions, suggesting a role for repetitive elements in lncRNA localization. Finally, we show that blocking of ribosomal elongation results in stabilization of many associated lncRNAs. Together these findings suggest that the ribosome is the default destination for the majority of cytoplasmic long noncoding RNAs and may play a role in their degradation.

Keywords: cytoplasm; degradation; long noncoding RNA; ribosome; ribosome profiling; translation; transposable element.


Figures

FIGURE 1.
FIGURE 1.
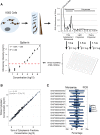
Discovery and quantification of ribosome-associated lncRNAs by polysome profiling and microarray hybridization. (A) Outline of the subcellular mapping of K562 lncRNA by polysome profiling and microarray hybridization. Sucrose-gradient ultracentrifugation was used to isolate the indicated fractions of ribosome-associated RNA, quantifications of which are displayed at the upper right. The pooled fractions used in this study are shown below the figure. The total amount of RNA isolated from each fraction is indicated by arrows, from which 0.1 µg was collected and hybridized to custom lncRNA microarrays. Microarrays were normalized using spike-ins: At the lower left is shown a representative example of the linear regression of spike in probe intensity against their starting concentrations. Dashed red line represents the defined detection threshold for this fraction where regression ceases to be linear. Only probes above this threshold were considered detected. (B) Correlation of the sum of the three cytoplasmic fraction concentration estimates and total cytoplasmic concentration estimate, supporting the quantification approach used. (C) Barplot shows for 14 lncRNA examples the relative amount (expressed as a percentage) of transcript molecules estimated to be present in each of the fractions. Sum of percentages of the three fractions has to be 100%, the total of detected molecules in the cytoplasm. Left bars represent quantification by microarrays and right bars by the mean of two quantitative PCR biological replicates. Microarray and PCR experiments represent different biological replicates.
FIGURE 2.
FIGURE 2.
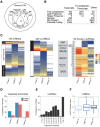
Classification and measurement of lncRNAs across cytoplasmic and ribosomal fractions. (A) Creating a high confidence non-protein-coding Gencode v7 lncRNA gene set. Genes (and all their constituent transcripts) having at least one transcript identified as protein coding by at least one method were designated “potential protein-coding.” Remaining genes with no evidence for protein-coding potential were defined as “filtered lncRNAs.” (B) Summary of the numbers of genes and transcripts classified by polysome association. (C) Heatmaps showing lncRNAs log10 concentration measured for each RNA fraction. Only lncRNA transcripts and protein-coding genes detected in at least one cytoplasmic fraction are shown. “Known lncRNAs” are those filtered transcripts that also belong to the lncRNAdb database (Amaral et al. 2011). (D) Barplot shows the percentage of cytoplasmic lncRNAs and protein-coding genes classified in each cytoplasmic fraction. Transcripts and genes are classified in the fraction where they display maximal detection. (E) Barplot shows the percentage of cytoplasmic lncRNAs classified in each polysomal occupancy value bin. Polysomal occupancy value represents the ratio of polysomal (the sum of Light and Heavy fractions) to total cytoplasmic RNA. (F) Boxplot shows translation index for mRNAs classified as free cytoplasmic, light polysomal, and heavy polysomal. Translation index is defined as the log10 ratio of mRNA-associated peptides expression to mRNA level, assayed in K562 by mass spectrometry and microarray, respectively. Statistical significance was calculated by Kolmogorov–Smirnov test ([**] P = 0.01).
FIGURE 3.
FIGURE 3.
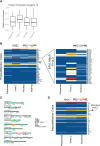
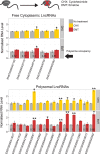
Validation of selected ribosome-associated lncRNA candidates. (A) qRT-PCR validation of ribosome-associated lncRNAs and free cytoplasmic lncRNAs in independent polysome profile experiments. In each case, two replicate experiments were carried out with control K562 cells (blue) and cells treated with puromycin (red) for three distinct RNA fractions. RNA levels are normalized to absolute levels of an RNA spiked into equal volumes of RNA sample. The top four panels represent protein-coding mRNAs. Transcript IDs and classifications are shown above each panel. The heatmap displays the log10 concentration values for the same genes predicted from the microarray. (B) Genomic map of ENST00000445681, an example of a ribosome-associated transcript validated above with evidence of evolutionary conservation and regulated transcription.
FIGURE 4.
FIGURE 4.
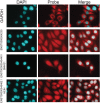
Fluorescence in situ hybridization of ribosome-associated lncRNAs in HeLa cells. (Left panel) DAPI staining of DNA; (middle) FISH probe; (right) merged. The actively translated housekeeping mRNA GAPDH was tested as a positive control for cytoplasmic localization.
FIGURE 5.
FIGURE 5.
Expression of cytoplasmic and ribosome-associated lncRNAs in human tissues, cells, and subcellular fractions. (A) Expression in K562 whole cell by RNA-seq. Numbers indicate median value. (B) Coefficient of variation (CV) for free cytoplasmic and polysomal transcripts expression in each of the 16 Human Body Map tissues. (C) Log2 cytoplasmic/nuclear RPKM ratios calculated from ENCODE RNA-seq for indicated RNAs in K562 [whole cell, poly(A)+]. For protein-coding mRNAs (ProtCod), data are only shown for detected transcripts. Median values are shown. (D) Subcellular localization of lncRNA in different cell lines. Colors reflect median cytoplasmic/nuclear log2 RPKM values.
FIGURE 6.
FIGURE 6.
Ribosome-associated and cytoplasmic lncRNA are under purifying selection. (A) Cumulative distribution of the mean PhastCons nucleotide-level conservation for the exons of the indicated transcript classes. Scores for ancestral repeat (AR) regions are also included to represent neutral evolutionary rates. (B) Boxplot with overlaid dotplot comparing mean PhastCons nucleotide-level conservation of the promoters of each group of transcripts. When more than one transcript shares the same promoter, the value for the promoter is plotted only once. Each color represents a different gene and each dot a different transcript.
FIGURE 7.
FIGURE 7.
Ribosome-associated lncRNAs have mRNA-like 5′ ends. (A) The pseudo 5′UTR was defined as the nucleotide distance from the start to the first AUG trinucleotide (top row). Shown is the cumulative distribution of these lengths for each set of transcripts. (B) Capping efficiency was calculated by normalizing K562 cytoplasmic poly(A)+ CAGE tag expression to K562 cytoplasmic expression from RNA-seq data. For each fraction we plot the correlation between normalized CAGE expression and fraction occupancy for all transcripts detected in the fraction. Linear regression was used to assess the relationship between these variables. The cartoon depicts lncRNAs, with a yellow star denoting the 7-methylguanosine cap.
FIGURE 8.
FIGURE 8.
Transposable element composition of lncRNAs. (A) The fraction of each transcript covered by annotated transposable elements (TE) from RepeatMasker. (B) On the left, the heatmap shows the mean of the fractional overlap for RepeatMasker-defined classes, i.e., the nucleotide overlap by a TE of a lncRNA transcript, divided by the length of the transcript, averaged across all transcripts in a class. On the right, heatmap like previous one but showing data only for MLT-type repeats. (C) The repeat composition of a selection of free cytoplasmic, MLT-containing lncRNAs. The direction of the arrows indicates the annotated strand of the repeat with respect to the lncRNA. The colors represent the repeat class. (D) As in B, except showing data for HeLa derived from ribosome footprinting experiments (Ingolia et al. 2012).
FIGURE 9.
FIGURE 9.
Changes in lncRNA stability in response to drug-induced ribosome stalling. K562 cells were treated with and without cycloheximide (CHX) or emetine (EMT), both treatments for blocking translation. Control and treated samples were then taken at 0 and 6 h after actinomycin D addition, which blocks transcription, and transcript levels were quantified in order to assess degradation rate of RNAs. Bars show mean fold change and standard deviation of three biological replicates (each performed in two technical replicates) of 6 h samples normalized to 0 h control samples. Treated samples were further normalized to control (untreated) samples. Bar numbers represent ratio from 0 to 1 of polysome occupancy for each transcript, according to microarray data (1 indicates transcript solely detected in light or heavy fractions, 0 for those undetected in either fraction). Results are shown separately for transcripts classified as free cytoplasmic or as polysomal transcripts. Statistical significance was calculated by one-sided t-test ([*] P < 0.05, [**] P < 0.01).

References

    1. Adey A, Burton JN, Kitzman JO, Hiatt JB, Lewis AP, Martin BK, Qiu R, Lee C, Shendure J. 2013. The haplotype-resolved genome and epigenome of the aneuploid HeLa cancer cell line. Nature 500: 207–211. - PMC - PubMed
    1. Amaral PP, Clark MB, Gascoigne DK, Dinger ME, Mattick JS. 2011. lncRNAdb: a reference database for long noncoding RNAs. Nucleic Acids Res 39: D146–D151. - PMC - PubMed
    1. Banfai B, Jia H, Khatun J, Wood E, Risk B, Gundling WE Jr, Kundaje A, Gunawardena HP, Yu Y, Xie L, et al. 2012. Long noncoding RNAs are rarely translated in two human cell lines. Genome Res 22: 1646–1657. - PMC - PubMed
    1. Beilharz TH, Preiss T. 2004. Translational profiling: the genome-wide measure of the nascent proteome. Brief Funct Genomic Proteomic 3: 103–111. - PubMed
    1. Brown CJ, Ballabio A, Rupert JL, Lafreniere RG, Grompe M, Tonlorenzi R, Willard HF. 1991. A gene from the region of the human X inactivation centre is expressed exclusively from the inactive X chromosome. Nature 349: 38–44. - PubMed

Publication types

Substances