

Intrinsic functional connectivity in late-life depression: trajectories over the course of pharmacotherapy in remitters and non-remitters
- PMID: 27090303
- PMCID: PMC5322273
- DOI: 10.1038/mp.2016.55
Intrinsic functional connectivity in late-life depression: trajectories over the course of pharmacotherapy in remitters and non-remitters
Abstract
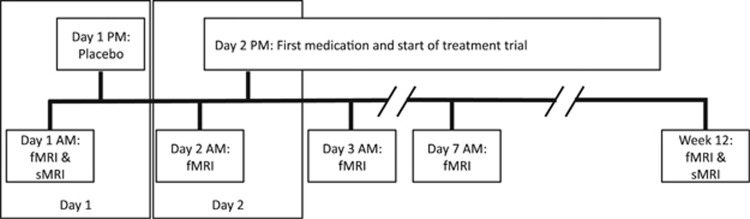
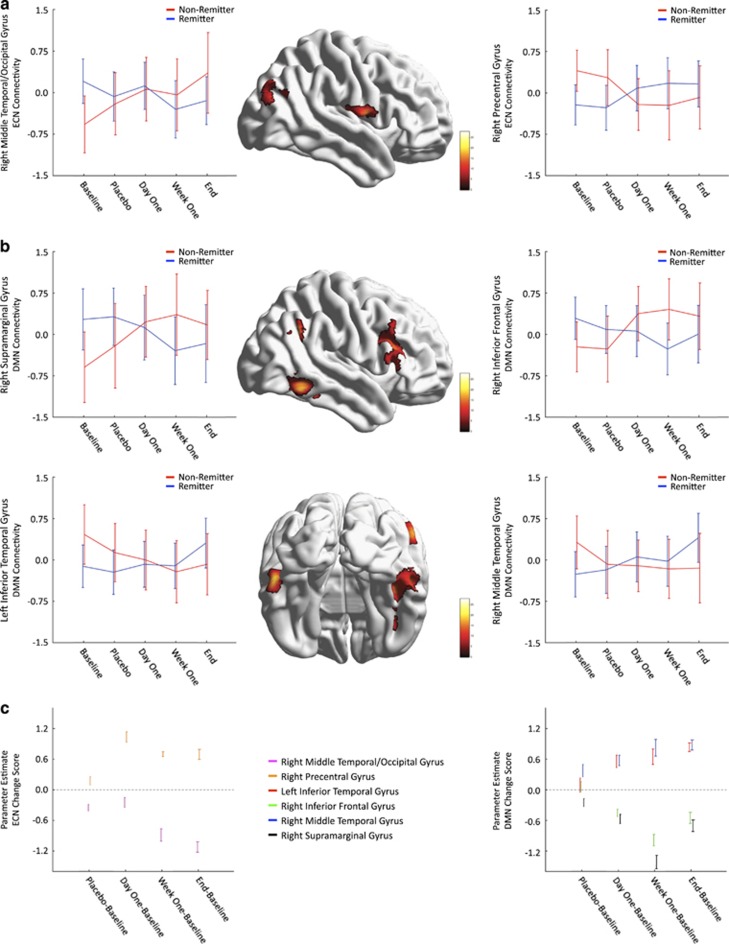
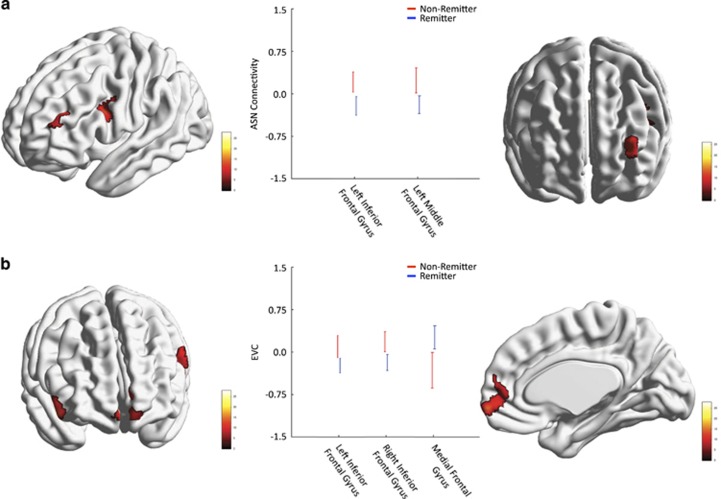
Previous studies in late-life depression (LLD) have found that patients have altered intrinsic functional connectivity in the dorsal default mode network (DMN) and executive control network (ECN). We aimed to detect connectivity differences across a treatment trial among LLD patients as a function of remission status. LLD patients (N=37) were enrolled into a 12-week trial of venlafaxine and underwent five functional magnetic resonance imaging resting state scans during treatment. Patients had no history of drug abuse, psychosis, dementia/neurodegenerative diseases or medical conditions with known effects on mood. We investigated whether there were differences in three networks: DMN, ECN and anterior salience network connectivity, as well as a whole brain centrality measure (eigenvector centrality). We found that remitters showed increases in ECN connectivity in the right precentral gyrus and decreases in DMN connectivity in the right inferior frontal gyrus and supramarginal gyrus. The ECN and DMN had regions (middle temporal gyrus and bilateral middle/inferior temporal/fusiform gyrus, respectively) that showed reversed effects (decreased ECN and increased DMN, respectively). Early changes in functional connectivity can occur after initial medication exposure. This study offers new data, indicating that functional connectivity changes differ depending on treatment response and can occur shortly after exposure to antidepressant medication.
Conflict of interest statement
The authors declare no conflict of interest.
Figures
Similar articles
-
Intrinsic inter-network brain dysfunction correlates with symptom dimensions in late-life depression.J Psychiatr Res. 2017 Apr;87:71-80. doi: 10.1016/j.jpsychires.2016.12.011. Epub 2016 Dec 12. J Psychiatr Res. 2017. PMID: 28017917 Free PMC article.
-
Evaluating functional connectivity of executive control network and frontoparietal network in Alzheimer's disease.Brain Res. 2018 Jan 1;1678:262-272. doi: 10.1016/j.brainres.2017.10.025. Epub 2017 Oct 25. Brain Res. 2018. PMID: 29079506
-
Functional segregation of executive control network and frontoparietal network in Alzheimer's disease.Cortex. 2019 Nov;120:36-48. doi: 10.1016/j.cortex.2019.04.026. Epub 2019 May 18. Cortex. 2019. PMID: 31228791
-
Dysregulation within the salience network and default mode network in hyperthyroid patients: a follow-up resting-state functional MRI study.Brain Imaging Behav. 2020 Feb;14(1):30-41. doi: 10.1007/s11682-018-9961-6. Brain Imaging Behav. 2020. PMID: 30259292 Review.
-
Resting state brain network function in major depression - Depression symptomatology, antidepressant treatment effects, future research.J Psychiatr Res. 2017 Sep;92:147-159. doi: 10.1016/j.jpsychires.2017.04.007. Epub 2017 Apr 24. J Psychiatr Res. 2017. PMID: 28458140 Review.
Cited by
-
The rise and fall of MRI studies in major depressive disorder.Transl Psychiatry. 2019 Dec 9;9(1):335. doi: 10.1038/s41398-019-0680-6. Transl Psychiatry. 2019. PMID: 31819044 Free PMC article. Review.
-
Recent advances in the use of imaging in psychiatry: functional magnetic resonance imaging of large-scale brain networks in late-life depression.F1000Res. 2019 Aug 6;8:F1000 Faculty Rev-1366. doi: 10.12688/f1000research.17399.1. eCollection 2019. F1000Res. 2019. PMID: 31448089 Free PMC article. Review.
-
The Abnormal Functional Connectivity between the Hypothalamus and the Temporal Gyrus Underlying Depression in Alzheimer's Disease Patients.Front Aging Neurosci. 2018 Feb 13;10:37. doi: 10.3389/fnagi.2018.00037. eCollection 2018. Front Aging Neurosci. 2018. PMID: 29487521 Free PMC article.
-
Default mode network dissociation linking cerebral beta amyloid retention and depression in cognitively normal older adults.Neuropsychopharmacology. 2021 Nov;46(12):2180-2187. doi: 10.1038/s41386-021-01072-9. Epub 2021 Jun 22. Neuropsychopharmacology. 2021. PMID: 34158614 Free PMC article.
-
Depression Affects Intrinsic Brain Activity in Patients With Mild Cognitive Impairment.Front Neurosci. 2019 Dec 17;13:1333. doi: 10.3389/fnins.2019.01333. eCollection 2019. Front Neurosci. 2019. PMID: 31920500 Free PMC article.
References
-
- Gaynes BN, Warden D, Trivedi MH, Wisniewski SR, Fava M, Rush AJ. What did STAR*D teach us? Results from a large-scale, practical, clinical trial for patients with depression. Psychiatr Serv 2009; 60: 1439–1445. - PubMed
-
- Warden D, Trivedi MH, Wisniewski SR, Davis L, Nierenberg AA, Gaynes BN et al. Predictors of attrition during initial (citalopram) treatment for depression: a STAR*D report. Am J Psychiatry 2007; 164: 1189–1197. - PubMed
-
- Trivedi MH, Rush AJ, Wisniewski SR, Nierenberg AA, Warden D, Ritz L et al. Evaluation of outcomes with citalopram for depression using measurement-based care in STAR*D: implications for clinical practice. Am J Psychiatry 2006; 163: 28–40. - PubMed
-
- Katon W, Unutzer J, Russo J. Major depression: the importance of clinical characteristics and treatment response to prognosis. Depress Anxiety 2010; 27: 19–26. - PubMed
Publication types
MeSH terms
Substances
Grants and funding
LinkOut - more resources
Full Text Sources
Other Literature Sources
Medical
