. 2016 Jul;42(7):1512-30.
doi: 10.1016/j.ultrasmedbio.2016.02.012. Epub 2016 Apr 15.

Frequency Dependence of Ultrasound Neurostimulation in the Mouse Brain

Affiliations

Frequency Dependence of Ultrasound Neurostimulation in the Mouse Brain

Patrick Peiyong Ye et al. Ultrasound Med Biol. 2016 Jul.

Abstract

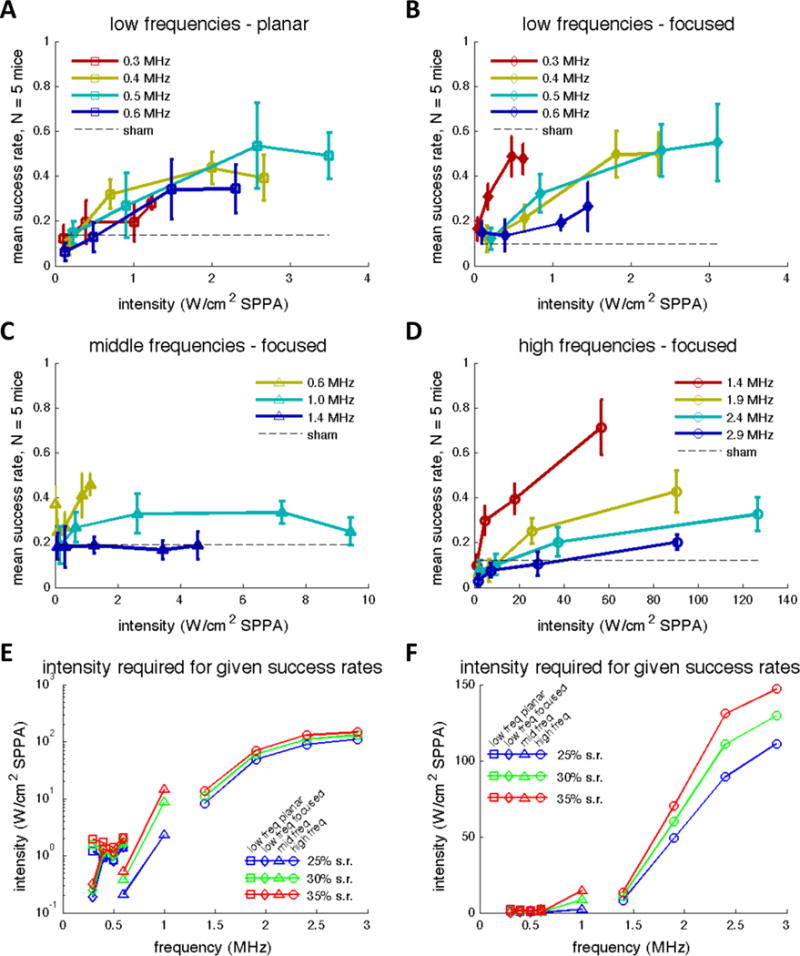
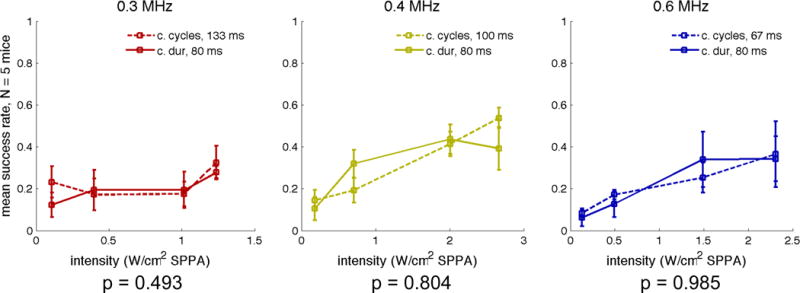
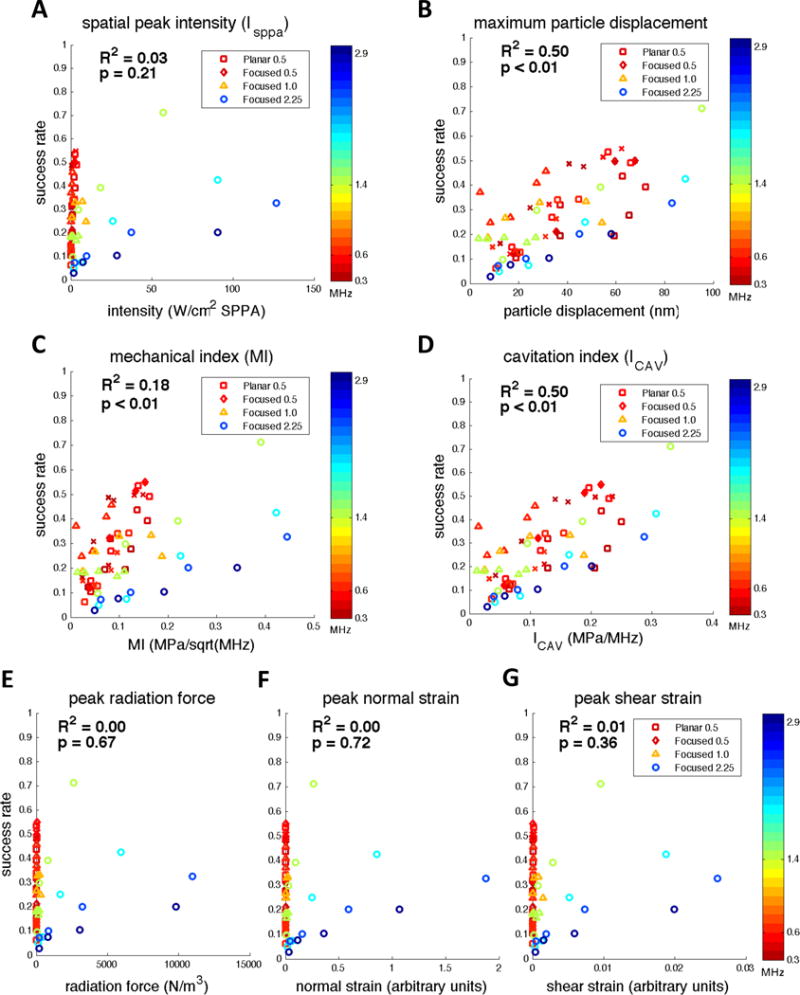
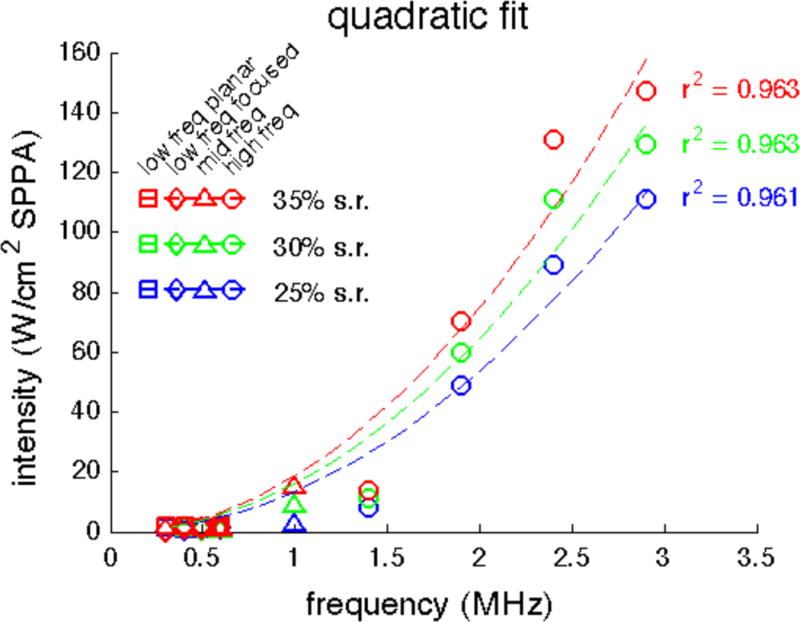
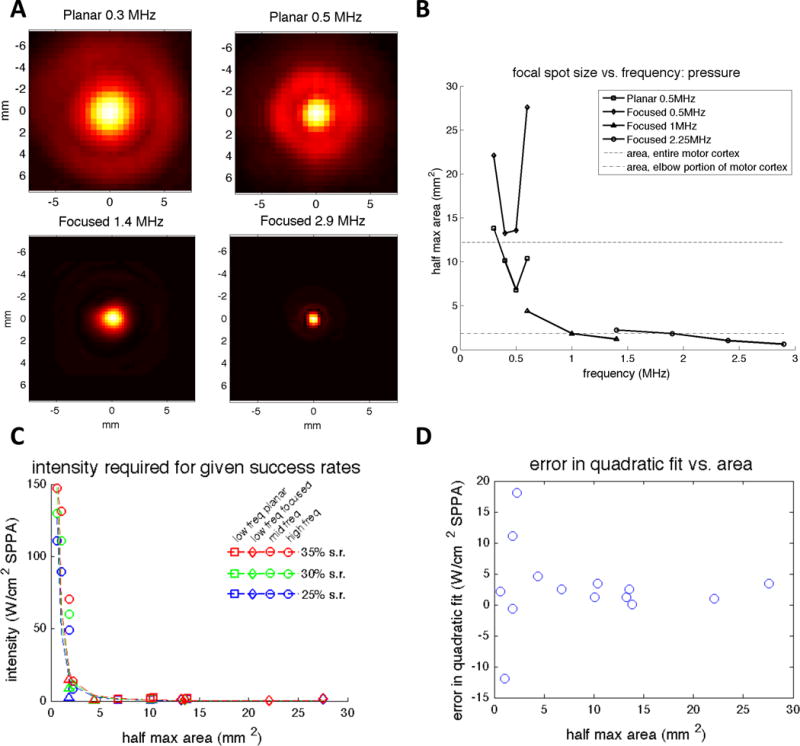
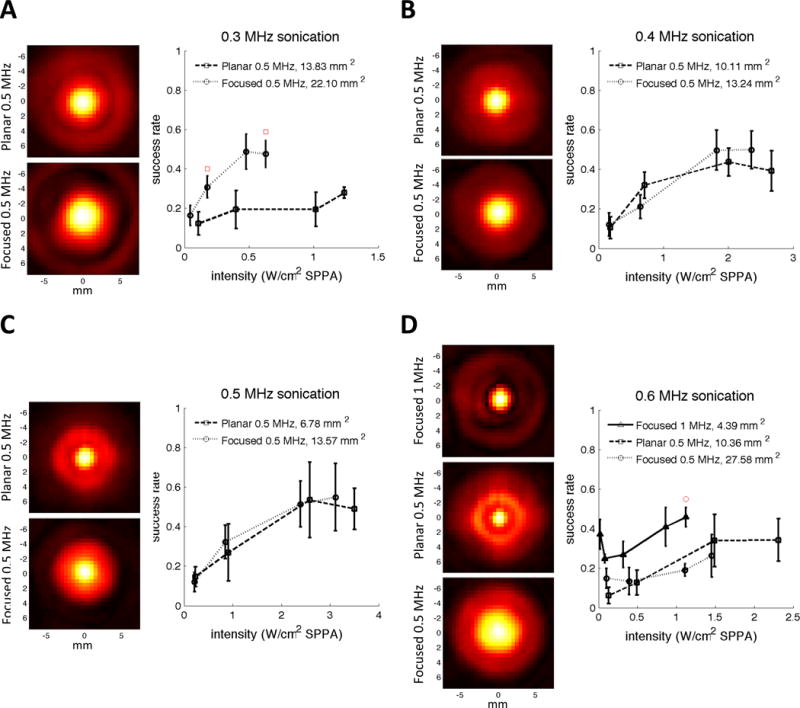
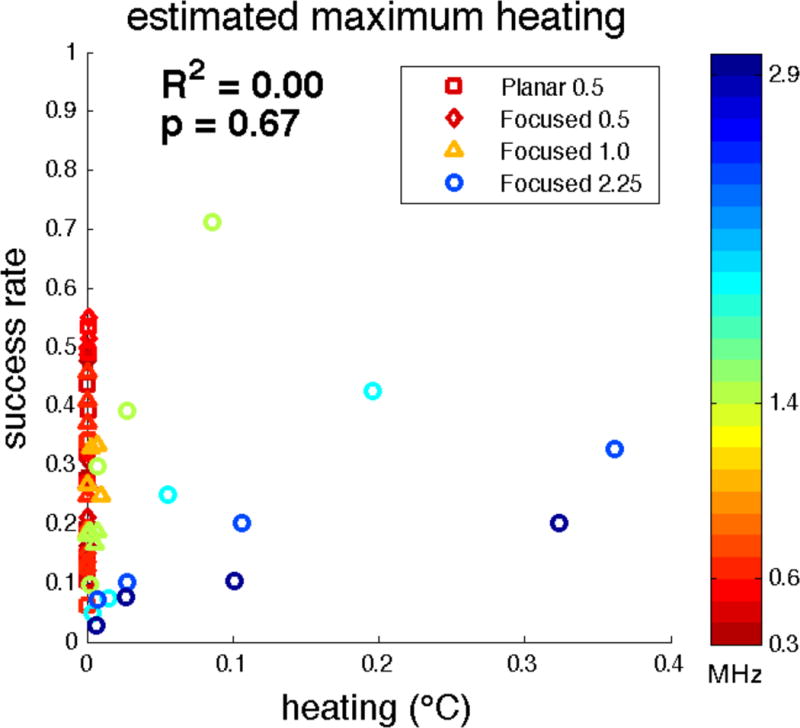
Ultrasound neuromodulation holds promise as a non-invasive technique for neuromodulation of the central nervous system. However, much remains to be determined about how the technique can be transformed into a useful technology, including the effect of ultrasound frequency. Previous studies have demonstrated neuromodulation in vivo using frequencies <1 MHz, with a trend toward improved efficacy with lower frequency. However, using higher frequencies could offer improved ultrasound spatial resolution. We investigate the ultrasound neuromodulation effects in mice at various frequencies both below and above 1 MHz. We find that frequencies up to 2.9 MHz can still be effective for generating motor responses, but we also confirm that as frequency increases, sonications require significantly more intensity to achieve equivalent efficacy. We argue that our results provide evidence that favors either a particle displacement or a cavitation-based mechanism for the phenomenon of ultrasound neuromodulation.

Keywords: Brain stimulation; Cavitation; Electromyography (EMG); Particle displacement; Radiation force; Ultrasound neuromodulation; Ultrasound neurostimulation.


Figures

Figure 1
Figure 1
Experimental protocol. The sets labeled in this example are for Experiment A including sonications with constant number of cycles and constant duration. US = ultrasound.
Figure 2
Figure 2
Diagram of animal setup. DAQ = data acquisition; RF = radiofrequency.
Figure 3
Figure 3
Placement of transducer waveguide relative to the head of the mouse for Experiments A–D (Figure 3A) and Experiment E (Figure 3B). The gray ring marks the placement of the waveguide for Experiments A and D, and the blue ring indicates the location of the waveguide for Experiments B and C. The width of the ring indicates the width of the plastic at the tip of the waveguide. Both are centered in the left-right direction. For Experiment E, we sonicated across the mouse brain with high frequency ultrasound. Locations of sonications are marked in blue dots at 1 mm spacing, with the origin (0,0) defined as midline in the right-left direction and the rostral tip of the ears in the rostral-caudal direction.
Figure 4
Figure 4
EMG post-processing methods. Acquired EMG signals (A) are first full-wave rectified (B), and then Gaussian filtered (C). A threshold is calculated based on the standard deviation and the mean of the smoothed EMG signal during quiet period, which is used to determine the beginning and end of the contraction. Then, several contraction metrics are calculated (D) including raw latency, peak amplitude, contraction duration, and contraction force. contr. = contraction; EMG = electromyography.
Figure 5
Figure 5
Mean success rates as a function of spatial peak intensity after accounting for skull attenuation at low, middle, and high frequencies from Experiments A–D (Figure 5A–D respectively). Error bars reflect standard error of the mean. Figure 5E and F represent the intensities required to achieve 25%, 30%, and 35% success rates plotted as a function of frequency combining all data collected from Experiments A–D. Intensity values were calculated by fitting the mean success rates in Figure 5A–D with logistic regression. Data marker shape indicates from which experiment the data was interpolated. freq = frequency; SPPA = spatial peak pulsed average; s.r. = success rate.
Figure 6
Figure 6
Success rate as a function of spatial peak intensity with different duration pulses at three different frequencies: 0.3 MHz (left), 0.4 MHz (center), and 0.6 MHz (right). Error bars indicate the standard error of the mean across mice. P-values were calculated within mice using a two-tailed paired t-test. Plotted intensities account for attenuation due to the mouse skull. dur = duration; SPPA = spatial peak pulsed average.
Figure 7
Figure 7
Mean success rates from Experiments A–D as a function of spatial peak intensity (A), maximum particle displacement (B), spatial peak mechanical index (C), spatial peak cavitation index (D), spatial peak radiation force (E), peak normal strain (F), and peak shear strain (G). Skull attenuation was taken into account when calculating each physical metric. All spatial peaks were calculated for intensities estimated to be located at a plane represented by the motor cortex. SPPA = spatial peak pulsed average.
Figure 8
Figure 8
Quadratic fit of threshold intensities for three success rates as a function of frequency (data from Figure 5F). Fits were calculated using a least-squares approach with corresponding R2 coefficient of determination values. freq = frequency; SPPA = spatial peak pulsed average; s.r. = success rate.
Figure 9
Figure 9
Effect of focal spot size. (A) Transverse normalized pressure beam profiles at four total frequencies using the Planar 500 kHz transducer (top), the Focused 1 MHz transducer (bottom left), and the Focused 2.25 MHz transducer (bottom right). All beam profiles can be found in Supplemental Figures 1–8. (B) Focal spot size as measured by the area above the half maximum of the pressure profile. The area of the entire motor cortex and the area represented by the elbow portion of both forelimbs, as reported by Tennant et al. 2011, are plotted for reference. The elbow portion of the forelimb was most relevant based on the placement of the EMG leads. (C) Threshold intensity as a function of focal spot area. An inverse quadratic fit appears to fit the data well. (D) Residual error in quadratic frequency fit as a function of focal spot area. freq = frequency; SPPA = spatial peak pulsed average; s.r. = success rate.
Figure 10
Figure 10
Sonicating with different focal spot sizes at the same frequencies. (A) Transverse pressure profiles for two different transducers at 0.3 MHz (left) and the resulting success rates as a function of spatial peak intensity after accounting for skull attenuation (right). Red squares indicate when the success rate achieved using the planar transducer was significantly greater than the success rate achieved using the focused transducer at the closest tested intensity (p<0.05, 2-tailed unpaired t-test). (B) Transverse pressure profiles for two different transducers at 0.4 MHz (left) and the resulting success rates as a function of spatial peak intensity after accounting for skull attenuation (right). (C) Transverse pressure profiles for two different transducers at 0.5 MHz (left) and the resulting success rates as a function of spatial peak intensity after accounting for skull attenuation (right). (D) Transverse pressure profiles for three different transducers at 0.6 MHz (left) and the resulting success rates as a function of spatial peak intensity after accounting for skull attenuation (right). The red circle indicates the intensity for which the success rate achieved using the Focused 1 MHz transducer was significantly greater than the success rate achieved using Focused 0.5 MHz transducer at the closest tested intensity (p<0.05, 2-tailed unpaired t-test). SPPA = spatial peak pulsed average.
Figure 11
Figure 11
Mouse-average success rates for right forelimb muscle contraction across the mouse brain at 1.4 MHz (Figure 11A) and 2.9 MHz (Figure 11B). The global spatial average success rate was 35% and 16% at 1.4 and 2.9 MHz respectively. The average success rate for sham sonications was 4%. Gray regions were not sonicated. The success rates for individual mice can be found in Supplemental Figure S15.
Figure 12
Figure 12
Mean success rates from Experiments A–D as a function of estimated spatial peak heating within the brain.

References

    1. Apfel RE, Holland CK. Gauging the likelihood of cavitation from short-pulse, low-duty cycle diagnostic ultrasound. Ultrasound Med Biol. 1991;17:179–185. - PubMed
    1. Bader KB, Holland CK. Gauging the likelihood of stable cavitation from ultrasound contrast agents. Phys Med Biol. 2013;58:127–44. - PMC - PubMed
    1. Bystritsky A, Korb AS, Douglas PK, Cohen MS, Melega WP, Mulgaonkar AP, Desalles A, Min BK, Yoo SS. A review of low-intensity focused ultrasound pulsation. Brain Stimul Elsevier Inc. 2011;4:125–136. - PubMed
    1. Deffieux T, Younan Y, Wattiez N, Tanter M, Pouget P, Aubry J-F. Low-intensity focused ultrasound modulates monkey visuomotor behavior. Curr Biol. 2013;23:2430–3. - PubMed
    1. Doherty J, Trahey G, Nightingale K, Palmeri M. Acoustic radiation force elasticity imaging in diagnostic ultrasound. IEEE Trans Ultrason Ferroelectr Freq Control. 2013;60:685–701. - PMC - PubMed