. 2016 Apr 19:7:11022.
doi: 10.1038/ncomms11022.

Nuclear RNA-seq of single neurons reveals molecular signatures of activation

Affiliations

Nuclear RNA-seq of single neurons reveals molecular signatures of activation

Benjamin Lacar et al. Nat Commun. .

Erratum in

Abstract

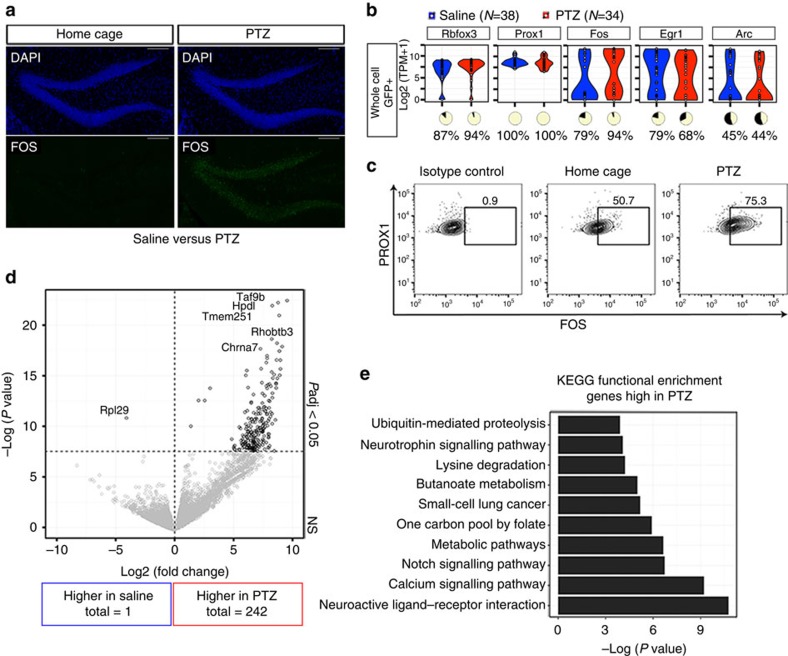
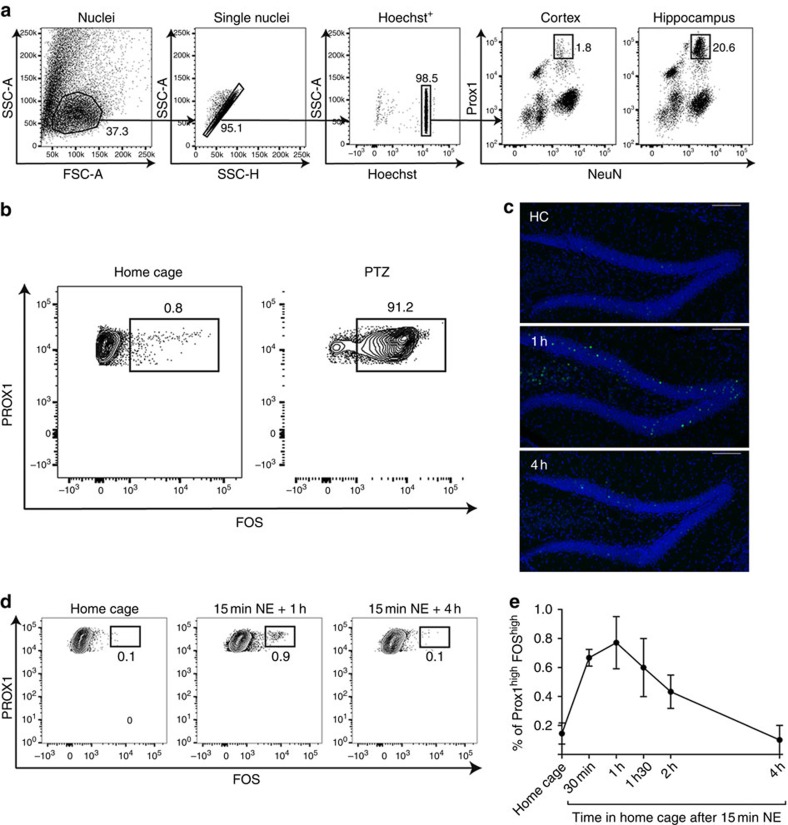
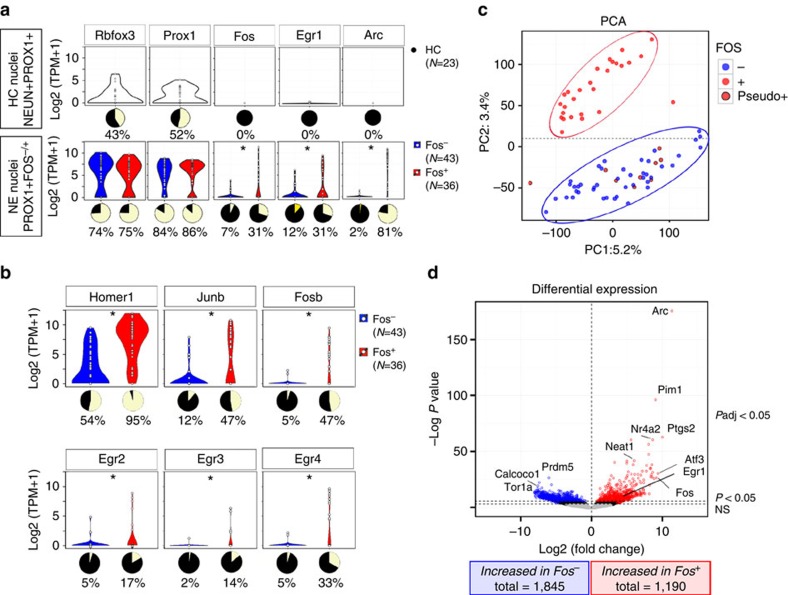
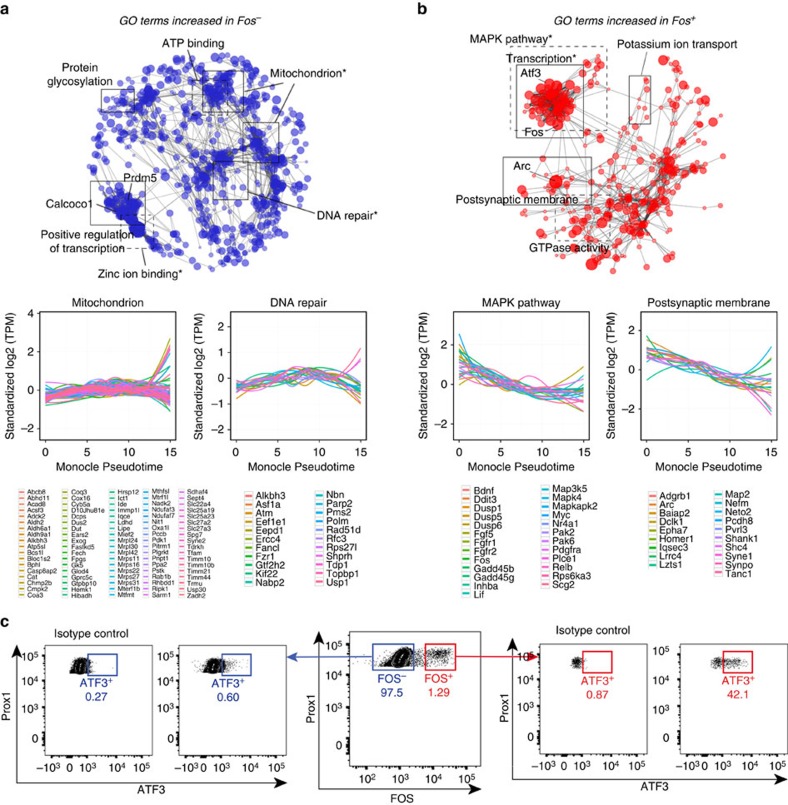
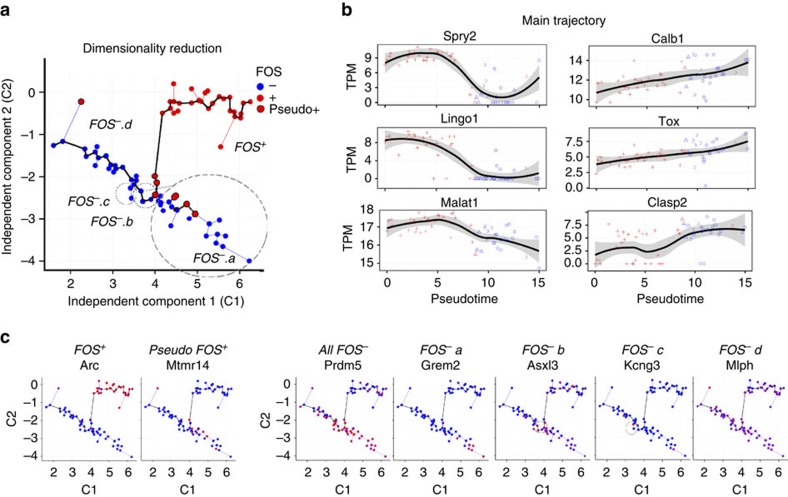
Single-cell sequencing methods have emerged as powerful tools for identification of heterogeneous cell types within defined brain regions. Application of single-cell techniques to study the transcriptome of activated neurons can offer insight into molecular dynamics associated with differential neuronal responses to a given experience. Through evaluation of common whole-cell and single-nuclei RNA-sequencing (snRNA-seq) methods, here we show that snRNA-seq faithfully recapitulates transcriptional patterns associated with experience-driven induction of activity, including immediate early genes (IEGs) such as Fos, Arc and Egr1. SnRNA-seq of mouse dentate granule cells reveals large-scale changes in the activated neuronal transcriptome after brief novel environment exposure, including induction of MAPK pathway genes. In addition, we observe a continuum of activation states, revealing a pseudotemporal pattern of activation from gene expression alone. In summary, snRNA-seq of activated neurons enables the examination of gene expression beyond IEGs, allowing for novel insights into neuronal activation patterns in vivo.


Conflict of interest statement

B.L. is currently an employee at Fluidigm. The other authors declare no competing financial interests.

Figures

Figure 1
Figure 1. Experience-independent induction of IEG expression in whole cells.
(a) Confocal images of FOS protein expression in the DG of a HC mouse (left) and a PTZ-treated mouse (right). One hour after PTZ-induced seizure, FOS (green) expression was widespread throughout the granule cell layer, whereas expression under HC conditions was minimal. Scale bar, 100 μm. (b) log2(TPM+1) normalized RNA-seq values from dissociated saline-treated (blue, n=38) and PTZ-treated (red, n=34) whole-cells for neuronal marker Rbfox3, DG marker Prox1, and IEGs Fos, Egr1 and Arc. Pie charts indicate the proportion of samples with detectable gene expression (TPM > 1; yellow). (c) Representative FACS plots showing FOS protein expression in PROX1+ live (Zombie -) single whole-cells isolated from the hippocampus of PTZ-treated and HC mice, n=2. FOS protein expression was observed in both PTZ-treated and HC animals. (d) Gene expression comparison of activated saline-treated and PTZ-treated whole cells. Dots to the left of zero represent genes with higher expression in saline, those to the right represent genes with higher expression in PTZ whole cells. EdgeR was used for differential expression analysis. (e) Functional enrichment of genes high in PTZ-treated whole cells using a modified Fisher's exact test (EASE score, DAVID bioinformatics69).
Figure 2
Figure 2. Detection of experience-associated FOS levels with nuclei staining.
(a) Representative FACS plots showing the gating strategy for the identification of PROX1+NEUN+ DG nuclei in the hippocampus of wild-type mice, n=3. Staining in cortex is shown as control. (b) Representative FACS plots showing FOS protein expression in PROX1+Hoechst+single-nuclei isolated from the hippocampus of PTZ-treated and HC mice, n=4. FOS protein expression was only observed in PTZ-treated animals. (c) Confocal images of FOS protein expression in the DG of a mouse either from home cage (HC) (top) or after recovery from a brief exposure to a novel environment (NE; middle and bottom). One hour after a 15-min exploration period in the NE, FOS was sparsely induced in the granule cell layer (middle). Four hours after NE FOS returned to lower levels similar to HC (bottom). Scale bar, 100 μm. (d) Representative FACS plots showing FOS protein expression in PROX1+Hoechst+single-nuclei isolated from the hippocampi of animals from HC, 1 h,or 4 h after a 15-min exposure to an NE. (e) Percentage of PROX1+FOShigh in the hippocampi of animals from HC 0.5 h, 1 h, 1.5 h, 2 h or 4 h after a 15-min exposure to an NE, error bars represent standard deviation from the mean (N=4 per time-point).
Figure 3
Figure 3. IEG RNA expression in single DGC nuclei is associated with animal experience.
(a) log2(TPM+1) Normalized RNA-seq values from HC NEUN+PROX1+ (top, n=23), NE PROX1+FOS− (bottom, n=43), and NE PROX1+FOS+ (bottom, n=36) single-nuclei. NE FOS+ nuclei (red) exhibited higher levels of IEG expression than both NE FOS− (blue) and HC nuclei (white). Stars indicate statistically significant differences in expression using edgeR after multiple-testing correction (fdrtool; R). Pie charts indicate the proportion of nuclei with detectable gene expression (yellow=detected). (b) IEG expression in nuclei after exposure to NE. (c) Principal components analysis (PCA) of the full transcriptome for NE nuclei. pseudo-FOS+ cells in red with black outline. (d) Differential expression results for all genes between FOS+ and FOS− nuclei excluding pseudo-FOS+ nuclei. Genes expressed to a higher level in FOS+ nuclei are in red and genes expressed higher in FOS− nuclei are in blue.
Figure 4
Figure 4. Gene ontology for FOS− and FOS+ nuclei.
Clustering based on Gene Ontology terms for differentially expressed genes either higher in FOS− nuclei (a) or FOS+ nuclei (b). Two categories are plotted below as a function of pseudotime using Monocle. (c) Representative FACS plots showing expression of ATF3+ in single-nuclei isolated from the hippocampus of a wild-type mouse exposed 15 min to an NE and killed 1 h later. Right panel shows expression of ATF protein in PROX1+FOS+ nuclei and the left panel shows ATF in PROX1+FOS− nuclei. 42.1% of PROX1+FOS+ nuclei co-express ATF3 as indicated by the red gate. Asterisks indicate significant functional enrichment after multiple-testing correction using DAVID.
Figure 5
Figure 5. NE nuclei exist along a continuum of transcriptional states.
(a) Independent components based on analysis using Monocle with individual nuclei coloured by FOS protein staining. Pseudo-FOS+ nuclei (red with black outline) segregate towards the border of FOS+ (red) and FOS− (blue) nuclei. (b) The top genes associated with pseudotime exhibit continuous patterns of expression linking FOS+ (red) and FOS− nuclei (blue). (c) Expression based on cluster, high expression=red, low expression=blue.

References

    1. Hashimshony T., Wagner F., Sher N. & Yanai I. CEL-seq: single-cell RNA-Seq by multiplexed linear amplification. Cell Rep. 2, 666–673 (2012). - PubMed
    1. Picelli S. et al.. Full-length RNA-seq from single cells using Smart-seq2. Nat. Protoc.. 9, 171–181 (2014). - PubMed
    1. Tang F. et al.. mRNA-Seq whole-transcriptome analysis of a single cell. Nat. Methods 6, 377–382 (2009). - PubMed
    1. Bhargava V., Ko P., Willems E., Mercola M. & Subramaniam S. Quantitative transcriptomics using designed primer-based amplification. Sci. Rep. 3, 1740 (2013). - PMC - PubMed
    1. Qiu S. et al.. Single-neuron RNA-Seq: Technical feasibility and reproducibility. Front. Genet. 3, 124 (2012). - PMC - PubMed

Publication types

MeSH terms

Substances

Associated data