. 2016 Apr 25;213(2):261-74.
doi: 10.1083/jcb.201509062. Epub 2016 Apr 18.

A requirement for filopodia extension toward Slit during Robo-mediated axon repulsion

Affiliations

A requirement for filopodia extension toward Slit during Robo-mediated axon repulsion

Russell E McConnell et al. J Cell Biol. .

Abstract

Axons navigate long distances through complex 3D environments to interconnect the nervous system during development. Although the precise spatiotemporal effects of most axon guidance cues remain poorly characterized, a prevailing model posits that attractive guidance cues stimulate actin polymerization in neuronal growth cones whereas repulsive cues induce actin disassembly. Contrary to this model, we find that the repulsive guidance cue Slit stimulates the formation and elongation of actin-based filopodia from mouse dorsal root ganglion growth cones. Surprisingly, filopodia form and elongate toward sources of Slit, a response that we find is required for subsequent axonal repulsion away from Slit. Mechanistically, Slit evokes changes in filopodium dynamics by increasing direct binding of its receptor, Robo, to members of the actin-regulatory Ena/VASP family. Perturbing filopodium dynamics pharmacologically or genetically disrupts Slit-mediated repulsion and produces severe axon guidance defects in vivo. Thus, Slit locally stimulates directional filopodial extension, a process that is required for subsequent axonal repulsion downstream of the Robo receptor.


Figures

Figure 1.
Figure 1.
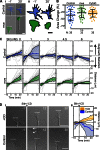
Slit induces filopodium elongation. (A) DIC images of DRG growth cones 15 s before (i and iii) and 10 min after addition of 1.5 collapsing units (CU) of either Slit (ii) or Sema3A (iv). One CU is the ligand concentration which induces ∼50% growth cone collapse (Slit2, 400 ng/ml; Sema3A, 500 ng/ml). Note the elongation of filopodia after stimulation with Slit (ii, white arrowheads mark filopodium tips), but not with Sema3A (iv, red arrowheads mark retraction fibers). See Videos 1 and 2. Growth cone collapse (solid lines) and filopodium length were measured over a concentration range of Slit2 (v, blue) or Sema3A (vi, green); for ease of comparison, concentrations are given as CU. Greater than 40 growth cones were scored at each concentration per condition. ***, P < 0.0001; n.s., P > 0.05; one-way ANOVA. (B) Live-cell DIC images of a growth cone during stimulation with 1.5 CU Slit. Filopodium tips are marked at 10s before (orange arrowheads) and at 170s after (blue arrowheads) Slit stimulation. Montages show time-lapse images of single filopodia, with the far-right panel showing an immunofluorescent image of the same filopodium after fixation at 180s post-Slit (phalloidin [F-actin], red; Mena, green). See Video 3. Bars, 10 µm. (C) Spontaneous and Slit-induced filopodium elongation (Elong.) kinetics were measured from DIC images captured every 5 s for 10 min before and after Slit addition. (i) Depicts length, rate, lifetime, and extension period measurements shown in panels ii–v (ii–v: preslit, n = 638 filopodia; postslit, n = 560 filopodia; 15 biological replicates). ***, P < 0.0001; n.s., P > 0.05; two-tailed t test.
Figure 2.
Figure 2.
Extension of filopodia toward sources of Slit is required for axon repulsion. (A) Polar histogram plots of filopodium distribution. Data were quantified from DIC images taken over a 10-min period after application of the indicated gradient; orientation of micropipette-generated gradients indicated by black triangle (open, mock; filled, Slit). Data are binned from six independent experiments examining a total of 24 growth cones. (B) Numbers of filopodia on the side of the growth cone facing toward (darker shades, proximal, 0–90°) or away from (lighter shades, distal, 90–360°) the Slit gradient. (C) Lengths of filopodia by relative orientation to mock (orange) or Slit (blue) gradients. Filopodia proximal to the Slit gradient were significantly longer (10.5 ± 5.4 µm) than filopodia exposed to a mock gradient (7.7 ± 3.6 µm) or filopodia distal to the gradient (8.9 ± 4.3 µm). ***, P < 0.001; ****, P < 0.0001; n.s., not significant; one-way ANOVA. (D) Traces of growth cone positions over a 30-min period after application of mock or Slit gradients. Representative DIC images show axons just before gradient application (0’) and after 20 or 40 min; insets show higher magnification views of growth cones at the corresponding time points. A total of 25 nM CD was added to the bath media at the time of the gradient onset in iii. Long filopodia were frequently observed in Slit gradients applied to control (ii, white arrowheads), but not in CD-treated (iii) or mve neurons (iv). (E) Axon turning angles in response to gradients (mean ± SD). n ≥ 18 biological replicates for each condition. ***, P < 0.001; one-way ANOVA. (F) Summary of relationships between filopodia extension toward sources of Slit and axon repulsion. Bars, 10 µm. WT, wild type.
Figure 3.
Figure 3.
Slit-induced axon retraction requires regulation of filopodia dynamics. (A) DIC time-lapse images of littermate control and mve DRG axons 1 min before and 20 min after bath application of 3 nM Slit. The distal-most leading edge is marked by a white dashed line, and growth cone areas shaded either blue (control) or green (mve) in panel i are enlarged and aligned for easy comparison in ii. (B) Area measurements were generated by manually outlining growth cones just before ligand addition (Apre) and 20 min after stimulation with the indicated ligands (Apost). Fractional change in area is calculated as 1 − (Apre − Apost)/Apre. Negative values indicate a decrease in growth cone area. (C) Growth cone position tracked from time-lapse DIC images; traces normalized so that the origin corresponds to growth cone position at the time of Slit stimulation (colored line, mean; shaded area, 95% confidence interval). n ≥ 18 for each condition. (D) DRG neurons stimulated with 5 nM Slit and either 25 nM CD or DMSO (control). Slit-induced filopodium elongation is observed in controls (i, white arrows), but not in CD-treated growth cones. CD blocks Slit-induced axon retraction; compare positions of growth cone leading edge (dashed lines in i) and growth cone position (ii, tracked as in C). Bars, 10 µm. n = 18 for each condition.
Figure 4.
Figure 4.
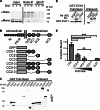
Slit regulates filopodium dynamics by inducing a direct interaction between Mena EVH1 and Robo CC2. (A) Western blots of anti-Robo1 immunoprecipitates (IP) from CAD cells after stimulation with 5 nM Slit at the indicated times. Robo1 was not detectable in the unenriched input fraction. (B) Domain diagrams of Robo1/2 and Robo1-derived constructs used for pull-down experiments. (C) GST-EVH1 was used to pull down GFP-tagged fragments of the Robo intracellular domain from HEK293 cell lysates; robust interaction was detected with GFP-CC2 (asterisk). (D) GST-EVH1 pull-down from lysates of HEK293 cells expressing GFP-CC2 or GFP-CC2 in which the EVH1 binding site was mutated (CC2m, L>A substitution). Pull-down and unbound fractions displayed are from the same Western blot exposure; irrelevant lanes have been removed for clarity. (E) Densitometric analysis of GST-EVH1 pull-down of Robo intracellular domain (ICD) fragments containing the CC2 motif (mean ± SD, three independent experiments). **, P < 0.001; ***, P < 0.0001.
Figure 5.
Figure 5.
Robo-mediated filopodium elongation requires a functional Ena–VASP binding site. (A) DRG neurons were transfected with the indicated constructs and stimulated with 100 ng/ml HGF. White arrowheads mark extremely long filopodia observed after HGF stimulation in growth cones expressing Met-Robo or CC3m. Bars, 10 µm. (B) DRG neurons were transfected with the indicated constructs and stimulated with the indicated ligands at time 0. The maximum length of individual filopodia were measured during a 10-min period starting 5 min after ligand addition. Activation of endogenous Robo by Slit elicited similar filopodium elongation in all conditions. (C) Area measurements were generated by manually outlining growth cones just before ligand addition (Apre) and 20 min after stimulation with the indicated ligands (Apost). Fractional change in area (i) is calculated as −(Apre − Apost)/Apre. Negative values indicate a decrease in growth cone area. (ii) Raw growth cone area values. ***, P < 0.0001; n.s., not significant (mean ± SD, one-way ANOVA, n ≥ 6 biological replicates for all conditions).
Figure 6.
Figure 6.
A functional Ena–VASP binding site in CC2 is required to mediate axon repulsion downstream of Robo activation. (A) Heatmaps showing the distribution of growth cone filopodia relative to an HGF gradient over time. HGF gradient was started at time 0; filopodia within 0–45° are nearest the pipette. Color scale indicates the number of filopodia. n = 18 growth cones per condition. (B) Lengths of all filopodia scored before (−) and after (+) onset of HGF gradient. Black lines, mean ± SD; n = 13,727 filopodia. (C) Length of filopodia nearest (proximal, top) and furthest (distal, bottom) from the HGF gradient over time. Mean ± SEM. Black bars denote points where MR was significantly different from GFP and CC2m (P < 0.001). (D) Box and whisker plots of axon turning angles in response to the indicated gradients. n = 18 growth cones per condition. n.s., P > 0.05; ****, P < 0.0001; one-way ANOVA.
Figure 7.
Figure 7.
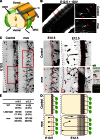
DRG axon guidance defects in mve mutant embryos. (A) Diagram of DRG projections in an embryonic spinal cord. Gray planes indicate the orientation and location of optical sections shown in B and C. (B) Confocal images of spinal cord explants infected with HSV-tdTomato to visualize DRG projections. Filopodia are observed on growth cones in control, but not mve, embryos (compare growth cones marked by red arrowheads in ii and iii). (C) Confocal micrographs of whole-mount embryos stained with neurofilament antibody to label axons. Only the right half of the spinal cord is shown for clarity. Boxed areas in i and ii are enlarged in iii and iv. OBH is outlined in red dashed lines in C and D. Boxed region in vi is enlarged in vii, revealing a growth cone lacking filopodia near the ventral midline. (D) Schema of axonal projection patterns observed in control and mve embryos at E10.5 and E12.5. (E) Quantification of central projection defects in wild-type (m+/+v+/+e+/+), littermate ((m+/+v−/−e−/−)/(m+/−v−/−e−/−)), and Ena/VASP null (m−/−v−/−e−/−) embryos. Thoracic spinal levels in six embryos (corresponding to 156 DRG) were scored for each condition; a spinal level was scored as defective if no recognizable OBH was present (C, iv) or if NF-positive axons extend past the OBH toward the dorsal midline (C, vi). Bars: (B, i–iii; and C, i–vi) 50 µm; (C, vii) 10 µm. GAP43, growth associated protein 43; NF, neurofilament; DIV, days in vitro; WT, wild type. Circular objects in C are autofluorescent cells.

References

    1. Akin O., and Mullins R.D.. 2008. Capping protein increases the rate of actin-based motility by promoting filament nucleation by the Arp2/3 complex. Cell. 133:841–851. 10.1016/j.cell.2008.04.011 - DOI - PMC - PubMed
    1. Bashaw G.J., Kidd T., Murray D., Pawson T., and Goodman C.S.. 2000. Repulsive axon guidance: Abelson and Enabled play opposing roles downstream of the roundabout receptor. Cell. 101:703–715. 10.1016/S0092-8674(00)80883-1 - DOI - PubMed
    1. Bear J.E., and Gertler F.B.. 2009. Ena/VASP: towards resolving a pointed controversy at the barbed end. J. Cell Sci. 122:1947–1953. 10.1242/jcs.038125 - DOI - PMC - PubMed
    1. Bear J.E., Loureiro J.J., Libova I., Fässler R., Wehland J., and Gertler F.B.. 2000. Negative regulation of fibroblast motility by Ena/VASP proteins. Cell. 101:717–728. 10.1016/S0092-8674(00)80884-3 - DOI - PubMed
    1. Bear J.E., Svitkina T.M., Krause M., Schafer D.A., Loureiro J.J., Strasser G.A., Maly I.V., Chaga O.Y., Cooper J.A., Borisy G.G., and Gertler F.B.. 2002. Antagonism between Ena/VASP proteins and actin filament capping regulates fibroblast motility. Cell. 109:509–521. 10.1016/S0092-8674(02)00731-6 - DOI - PubMed

Publication types

MeSH terms