. 2016 Apr 19:6:24675.
doi: 10.1038/srep24675.

Curcumin mediates oxaliplatin-acquired resistance reversion in colorectal cancer cell lines through modulation of CXC-Chemokine/NF-κB signalling pathway

Affiliations

Curcumin mediates oxaliplatin-acquired resistance reversion in colorectal cancer cell lines through modulation of CXC-Chemokine/NF-κB signalling pathway

Vicenç Ruiz de Porras et al. Sci Rep. .

Abstract

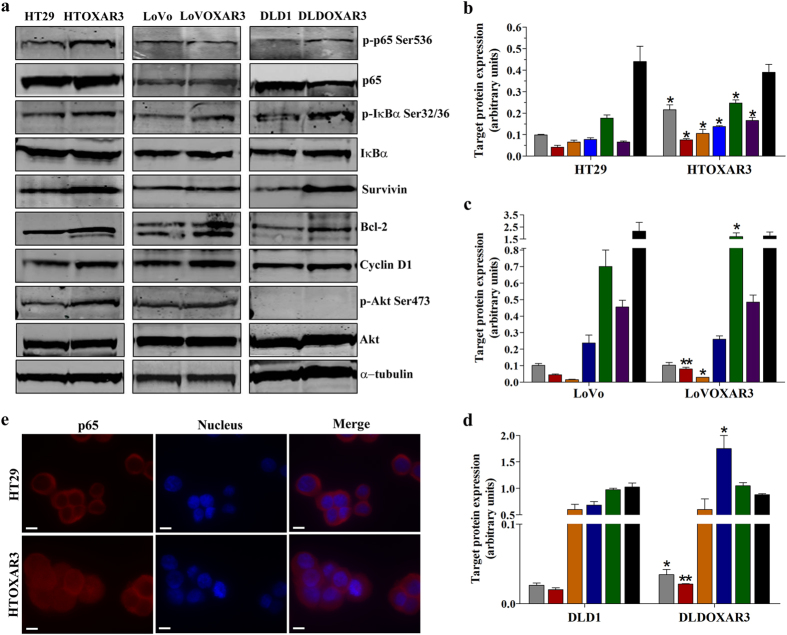
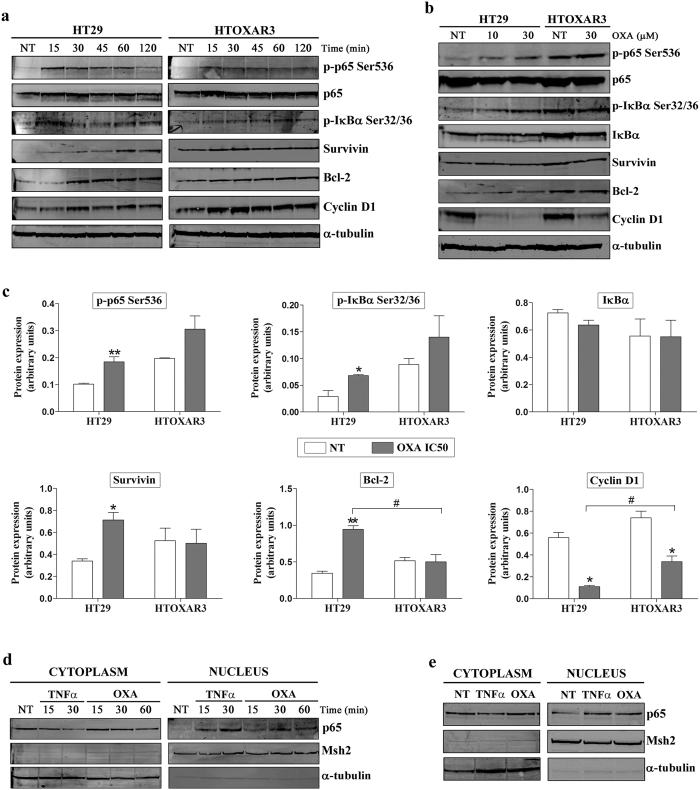
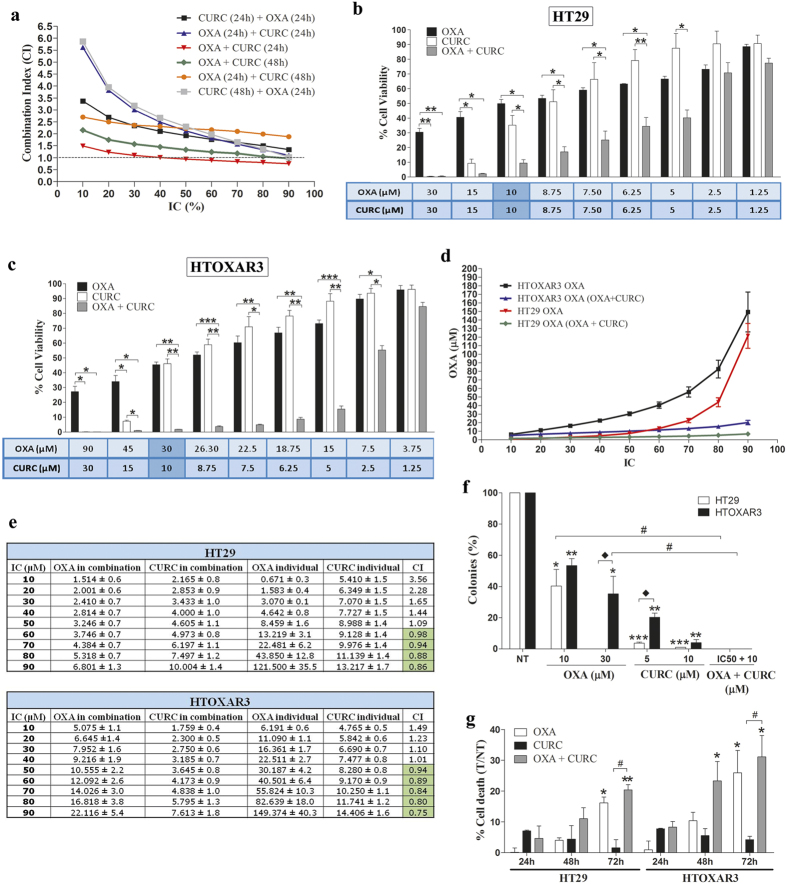
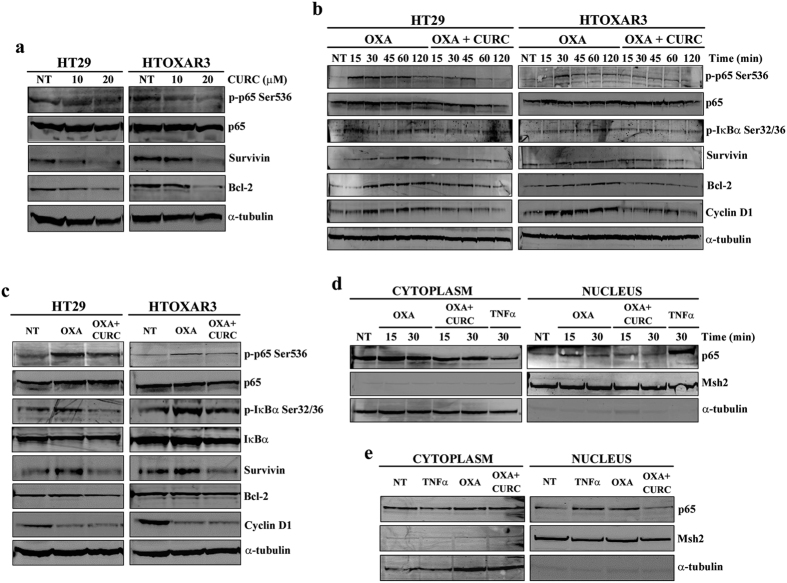
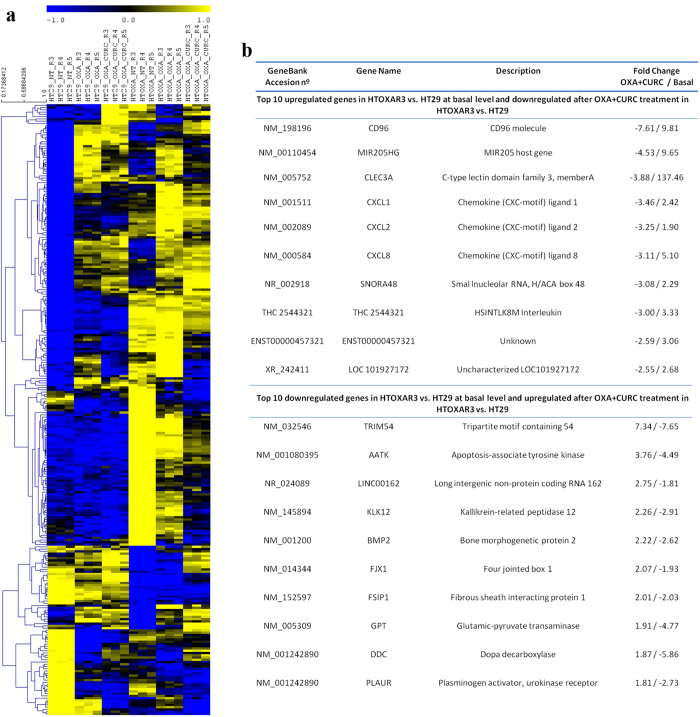
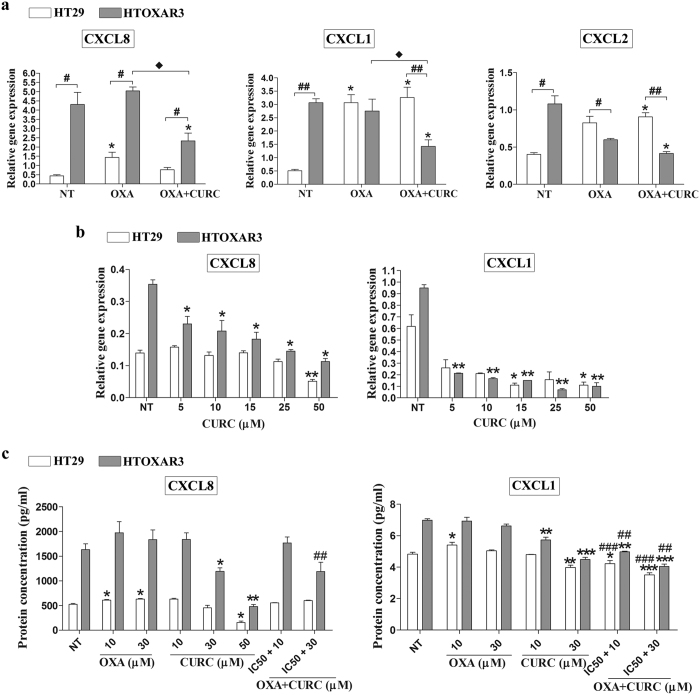
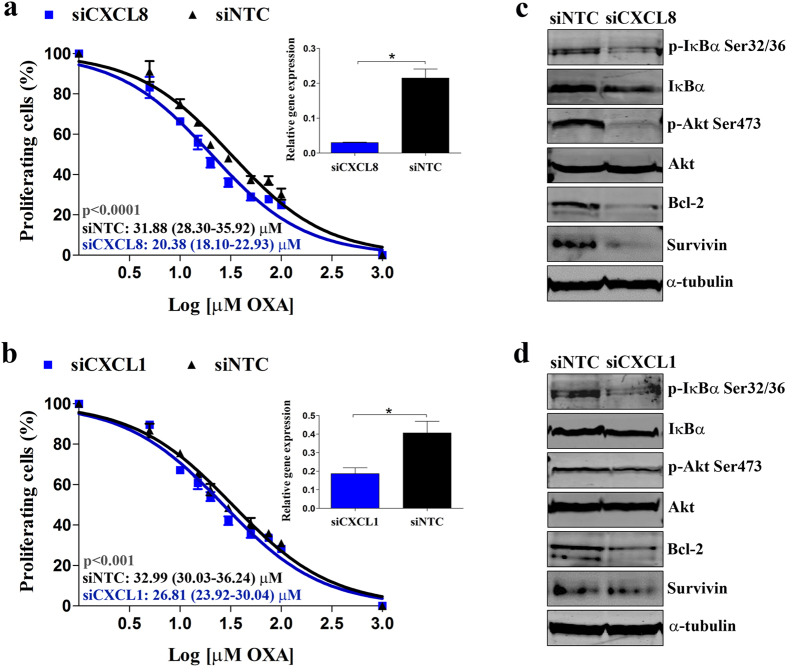
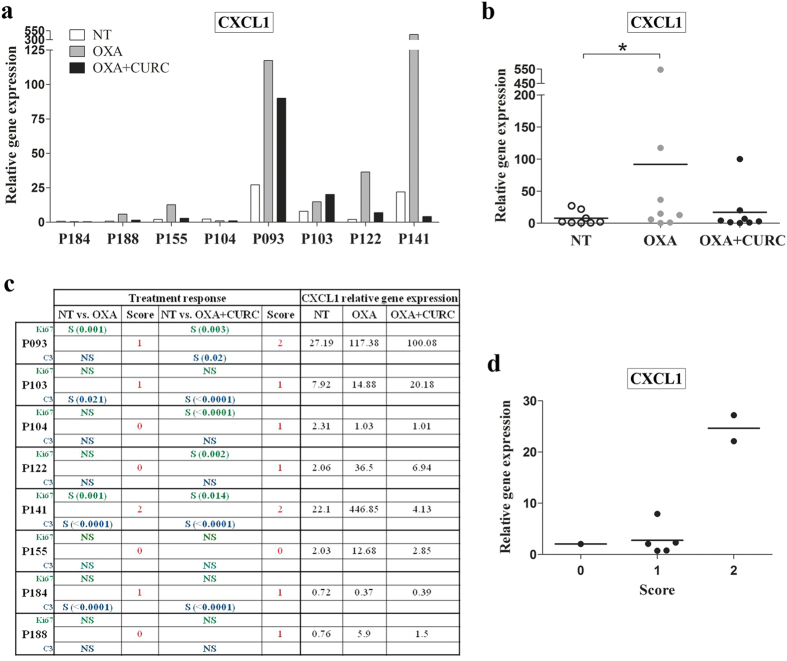
Resistance to oxaliplatin (OXA) is a complex process affecting the outcomes of metastatic colorectal cancer (CRC) patients treated with this drug. De-regulation of the NF-κB signalling pathway has been proposed as an important mechanism involved in this phenomenon. Here, we show that NF-κB was hyperactivated in in vitro models of OXA-acquired resistance but was attenuated by the addition of Curcumin, a non-toxic NF-κB inhibitor. The concomitant combination of Curcumin + OXA was more effective and synergistic in cell lines with acquired resistance to OXA, leading to the reversion of their resistant phenotype, through the inhibition of the NF-κB signalling cascade. Transcriptomic profiling revealed the up-regulation of three NF-κB-regulated CXC-chemokines, CXCL8, CXCL1 and CXCL2, in the resistant cells that were more efficiently down-regulated after OXA + Curcumin treatment as compared to the sensitive cells. Moreover, CXCL8 and CXCL1 gene silencing made resistant cells more sensitive to OXA through the inhibition of the Akt/NF-κB pathway. High expression of CXCL1 in FFPE samples from explant cultures of CRC patients-derived liver metastases was associated with response to OXA + Curcumin. In conclusion, we suggest that combination of OXA + Curcumin could be an effective treatment, for which CXCL1 could be used as a predictive marker, in CRC patients.


Figures

Figure 1
Figure 1. NF-κB pathway activation in CRC cell lines with acquired resistance to OXA.
Western blot analysis (a) and graphic representation of phosphorylated p65 (p-p65 Ser536, grey bars), phosphorylated IκBα (p-IκBα Ser32/36, red bars), Survivin (orange bars), Bcl-2 (blue bars), Cyclin D1 (green bars), phosphorylated Akt (p-Akt Ser473, purple bars) and IκBα (black bars) basal expression in HT29/HTOXAR3 (b), LoVo/LoVOXAR3 (c) and DLD1/DLDOXAR3 (d) cell lines. Alpha-tubulin was used as endogenous control. (e) Representative immunocytochemistry images of the subcellular localization of p65 (red) in HT29 and HTOXAR3 cells. Nuclei were stained in blue. Objective lens: 40x immersion oil. Scale bar: 10 μm. Bar graphs represent mean ± SEM values, calculated from at least three independent experiments. *p-value < 0.05 and **p-value < 0.01; relative to protein expression in the corresponding sensitive cell line.
Figure 2
Figure 2. Effect of OXA treatment on NF-κB activation in HT29 and HTOXAR3 cells.
Representative western blot images showing protein expression changes of phosphorylated p65 (p-p65 Ser536), phosphorylated IκBα (p-IκBα Ser32/36), Survivin, Bcl-2 and Cyclin D1 in HT29 and HTOXAR3 cells after treatment with 10 μM or 30 μM of OXA respectively, for 0 to 120 minutes (a) and for 24 hours (b,c) Bar graphs representing mean ± SEM expression changes of the indicated proteins after a 24-hour OXA treatment with the corresponding IC50 dose for HT29 (10 μM) and HTOXAR3 (30 μM). Alpha-tubulin was used as endogenous control. (d) Western blots showing p65 protein expression in cytoplasmic and nuclear extracts of HT29 cells after OXA treatment at short exposure times (0 to 60 min) and at 24 hours (e). TNFα was used as positive control at 50 ng/mL. Msh2 and α-tubulin were used as nuclear- and cytoplasmic-specific protein controls, respectively. NT: Non-treated cells. Results shown were obtained from at least 3 independent experiments. *p-value < 0.05 and **p-value < 0.01; as compared to NT. #p-value < 0.05 relative to protein expression in the HT29 cell line.
Figure 3
Figure 3. Combination of OXA and Curcumin in OXA-sensitive and –resistant CRC cell lines.
(a) Graphic representation of the Combination Index (CI) values corresponding to different OXA plus Curcumin (CURC) treatment schedules in the HTOXAR3 cell line. (b) Bar graphs representing mean ± SEM percentage of cell viability after a 24-hour treatment with OXA, Curcumin or their concomitant combination at the indicated doses in HT29 and HTOXAR3 cells (c). *p-value < 0.05; **p-value < 0.01; ***p-value < 0.001 relative to the indicated treatment condition. (d) OXA doses (mean ± SEM) corresponding to indicated inhibitory concentrations (IC) in HT29 and HTOXAR3 cells as a single agent or when combined with Curcumin concomitantly for 24 h. (e) OXA and Curcumin doses (mean ± SD) corresponding to the indicated inhibitory concentrations (IC) when given as single agents or in a 24 h-concomitant schedule in HT29 and HTOXAR3. CI represents the combination index values in each case. Synergistic values (CI < 1) are highlighted in green. (f) Bar graph representing the percentage (mean ± SEM) of colonies in HT29 and HTOXAR3 cells after 24 h of the indicated treatments. *p-value < 0.05; **p-value < 0.01; ***p-value < 0.001 relative to NT (Non-treated cells). #p-value < 0.05 relative to OXA individual treatment. *p-value < 0.05 as compared to HT29. (g) Bar graph representing the percentage (mean ± SEM) of dead cells after 24, 48 and 72 h of treatment with OXA, Curcumin or their combination (as compared to non-treated controls) at their corresponding IC50 doses in HT29 and HTOXAR3 cell lines. *p-value < 0.05; **p-value < 0.01, relative to NT. #p-value < 0,05, relative to Curcumin individual treatment.
Figure 4
Figure 4. Effect of Curcumin on constitutive and OXA-induced NF-κB activation.
(a) Western blot images of phosphorylated p65 (p-p65 Ser536), total p65, Survivin and Bcl-2 in HT29 and HTOXAR3 cells after a 24-hour treatment with 10 and 20 μM Curcumin (CURC). (b) Representative western blot images showing protein expression changes as indicated, in HT29 and HTOXAR3 cells after 24 h treatment with OXA or concomitant OXA plus Curcumin, for 0 to 120 minutes or 24 hours (c,d) Western blots showing p65 protein expression in cytoplasmic and nuclear extracts of HT29 cells after treatment with OXA (10 μM) or OXA + Curcumin (10 μM each) for short-time exposure (0 to 30 min) or 24 h (e). TNFα was used as positive control at 50 ng/ml. Msh2 and α-tubulin were used as nuclear- and cytoplasmic-specific protein controls, respectively. Images are representative of at least 3 independent experiments. NT: Non-treated cells.
Figure 5
Figure 5. Gene expression patterns associated with OXA resistance and Curcumin + OXA synergism.
(a) Hierarchical clustering of genes using pearson correlation as distance and average linkage with leaf order optimization. Cluster analysis was perfomed with TMEV version 4.8.1 using normalized expression values (mean subtracted log2 intensities divided by the standard deviation of the log2 intensities for each gene) (b) Table showing the top 10 up and down-regulated genes ranked by basal fold change between basal levels between HTOXAR3 and HT29 with regulation reversed by concomitant treatment.
Figure 6
Figure 6. CXCL1, CXCL8 and CXCL2 gene expression and CXCL1 and CXCL8 secreted protein levels after treatment with OXA, Curcumin or both.
(a) Bar graphs illustrating relative gene expression levels (mean ± SEM) of the indicated chemokines in non-treated (NT) and after OXA or OXA plus Curcumin (CURC) treatment at IC50 doses in HT29 and HTOXAR3 cells. Gene expression levels of β-actin were used as endogenous control. *p-value < 0.05 relative to NT, #p-value < 0.05; ##p-value < 0.01, relative to HT29. ** p-value < 0.05 relative to OXA. (b) Changes in chemokines’ gene expression after treatment with Curcumin at indicated doses. (c) Graph bars showing levels of secreted chemokines (mean ± SEM) measured by enzyme-linked immunosorbent assay (ELISA) in the supernatants of treated cells as indicated. *p-value < 0.05; **p-value < 0.01; ***p-value < 0.001 relative to NT. ##p-value < 0.01, ###p-value < 0,001 relative to OXA. Results were obtained from at least 3 independent experiments.
Figure 7
Figure 7. Effect of CXCL8 and CXCL1 siRNA-mediated gene silencing on OXA cytotoxicity and NF-kB signalling pathway activation in HTOXR3 cells.
(a) Dose-response curves for HTOXAR3 cell line, after CXCL8 and (b) CXCL1 gene silencing, treated with 0-100 μM OXA for 24 hours (mean ± SEM). Insets show siRNA-mediated gene silencing efficiency at 48 h post-transfection. IC50 values are indicated as mean (95% CI). (c) Representative western blot images showing changes in phosphorylated IκBα (p-IκBα Ser32/36), phosphorylated Akt (p-Akt Ser473), Survivin, Bcl-2 and Cyclin D1 protein expression in HTOXAR3 cells under control (siNTC) and CXCL8 (siCXCL8) or (d) CXCL1 (siCXCL1) gene silencing. All results were obtained from at least 3 independent experiments.
Figure 8
Figure 8. CXCL1 gene expression in explant cultures of patient-derived tissues after treatment with OXA or OXA + Curcumin.
(a) Bar graph illustrating CXCL1 expression levels in 8 FFPE samples from explant cultures of CRC patients-derived liver metastases, that were treated with DMSO (NT), OXA or OXA plus Curcumin (CURC) for 24 h. (b) Scattergram reporting the expression levels of CXCL1 in NT, OXA or OXA plus Curcumin treated tissue explants. Horizontal lines represent mean values. (c) Table showing significative (S) or not significative (NS) changes in ki-67 (green) and cleaved caspase 3 (C3, blue) staining. Score 2 meant that ki-67 decreased and cleaved caspase increased significantly after the indicated treatment; score 1 meant that ki-67 decreased or cleaved caspase increased and score 0 meant that neither of them was changed. CXCL1 gene expression changes after NT, OXA or OXA + Curcumin treatment are also shown. (d) Scatter plot showing CXCL1 expression according to score values. Horizontal lines represent mean values. *p-value < 0.05 relative to NT (Wilcoxon test).

Similar articles

Cited by

References

    1. Fakih M. G. Metastatic colorectal cancer: current state and future directions. J Clin Oncol 33, 1809–1824, JCO.2014.59.7633 (2015). - PubMed
    1. Grothey A. & Goetz M. P. Oxaliplatin plus oral fluoropyrimidines in colorectal cancer. Clin Colorectal Cancer 4 Suppl 1, S37–42 (2004). - PubMed
    1. Kelland L. The resurgence of platinum-based cancer chemotherapy. Nat Rev Cancer 7, 573–584, 10.1038/nrc2167 (2007). - DOI - PubMed
    1. Holohan C., Van Schaeybroeck S., Longley D. B. & Johnston P. G. Cancer drug resistance: an evolving paradigm. Nat Rev Cancer 13, 714–726, 10.1038/nrc3599 (2013). - DOI - PubMed
    1. Martinez-Balibrea E. et al. Tumor-Related Molecular Mechanisms of Oxaliplatin Resistance. Mol Cancer Ther 14, 1767–1776, 10.1158/1535-7163.MCT-14-0636 (2015). - DOI - PubMed

Publication types

MeSH terms