. 2016 May 2;213(5):697-713.
doi: 10.1084/jem.20151876. Epub 2016 Apr 18.

Oxidized mitochondrial nucleoids released by neutrophils drive type I interferon production in human lupus

Affiliations

Oxidized mitochondrial nucleoids released by neutrophils drive type I interferon production in human lupus

Simone Caielli et al. J Exp Med. .

Abstract

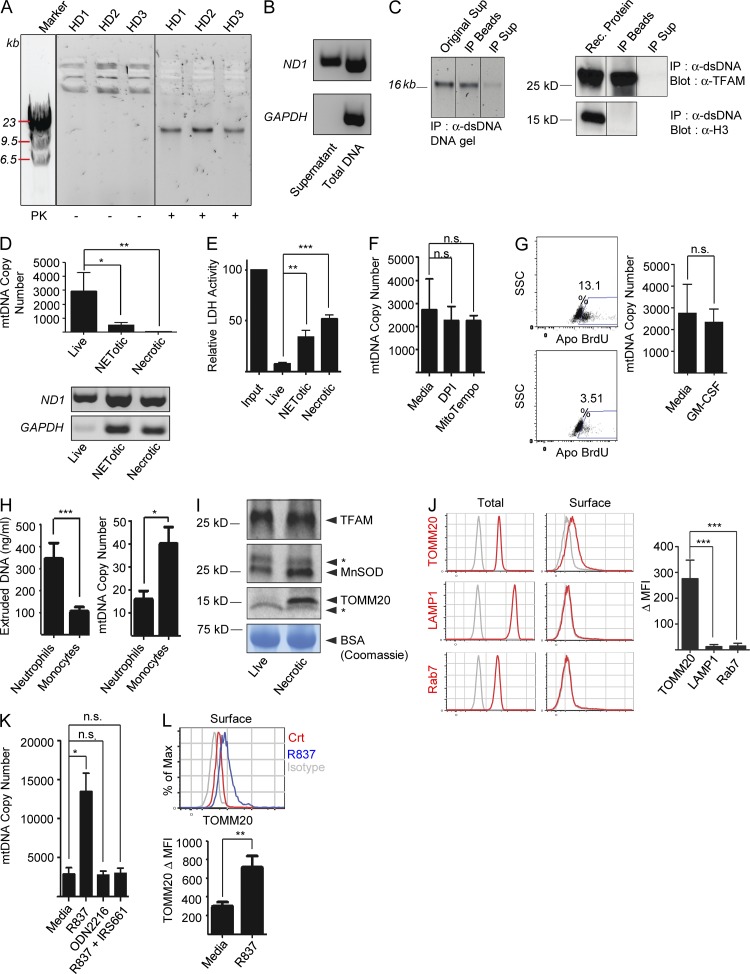
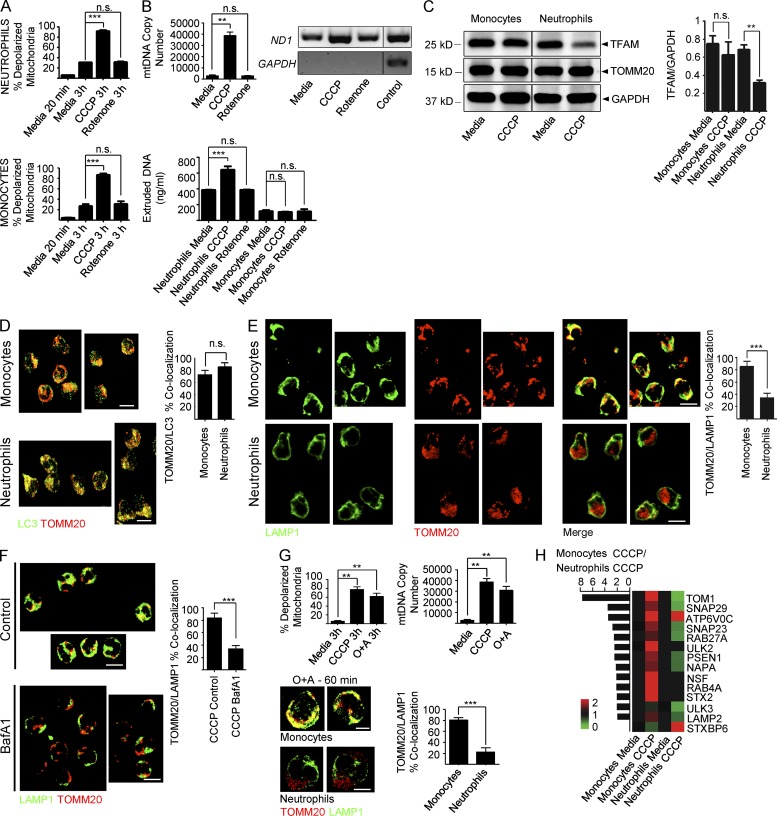
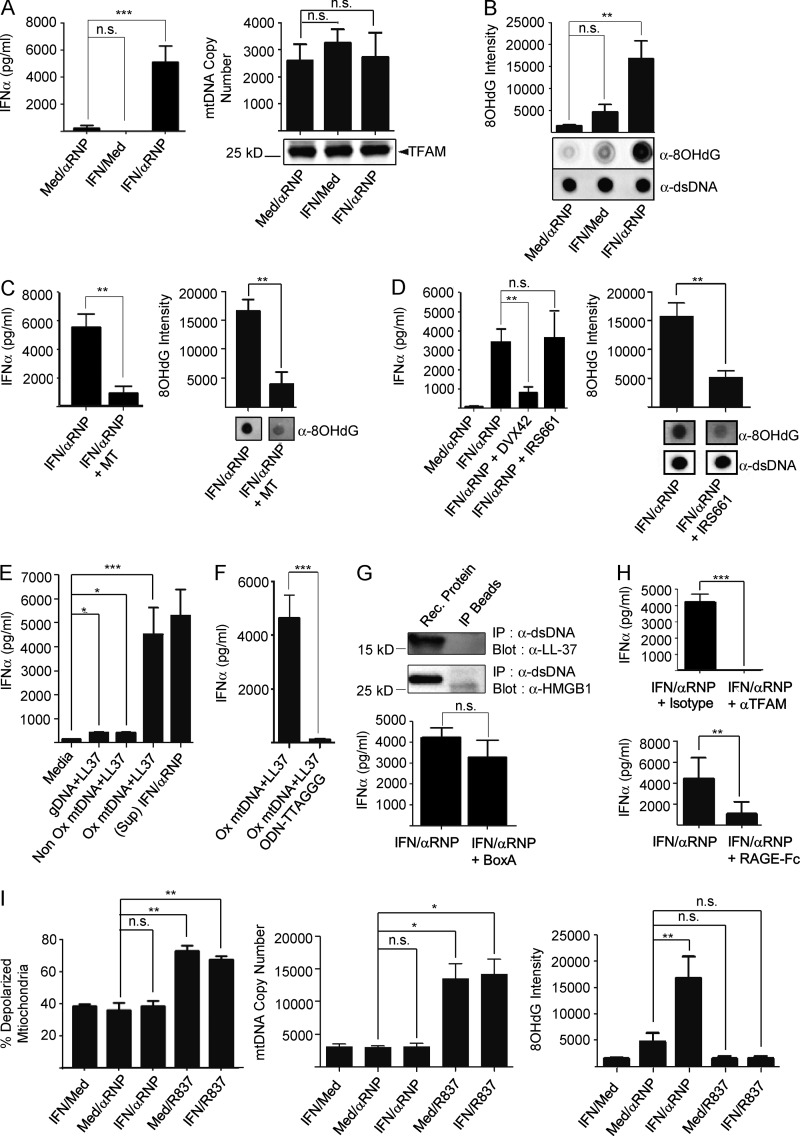
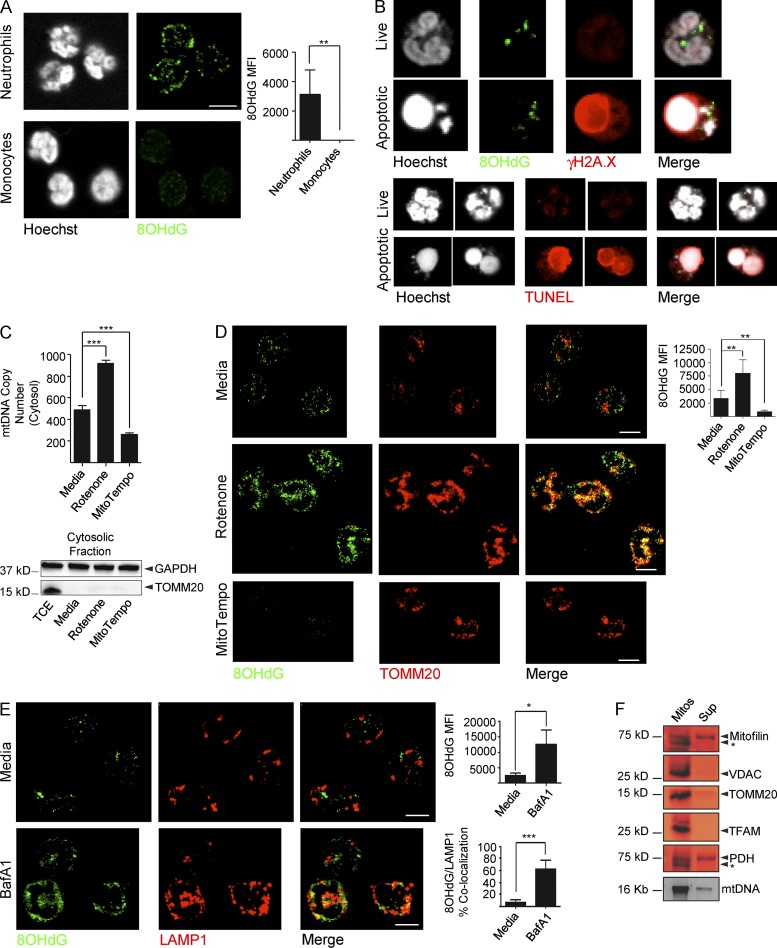
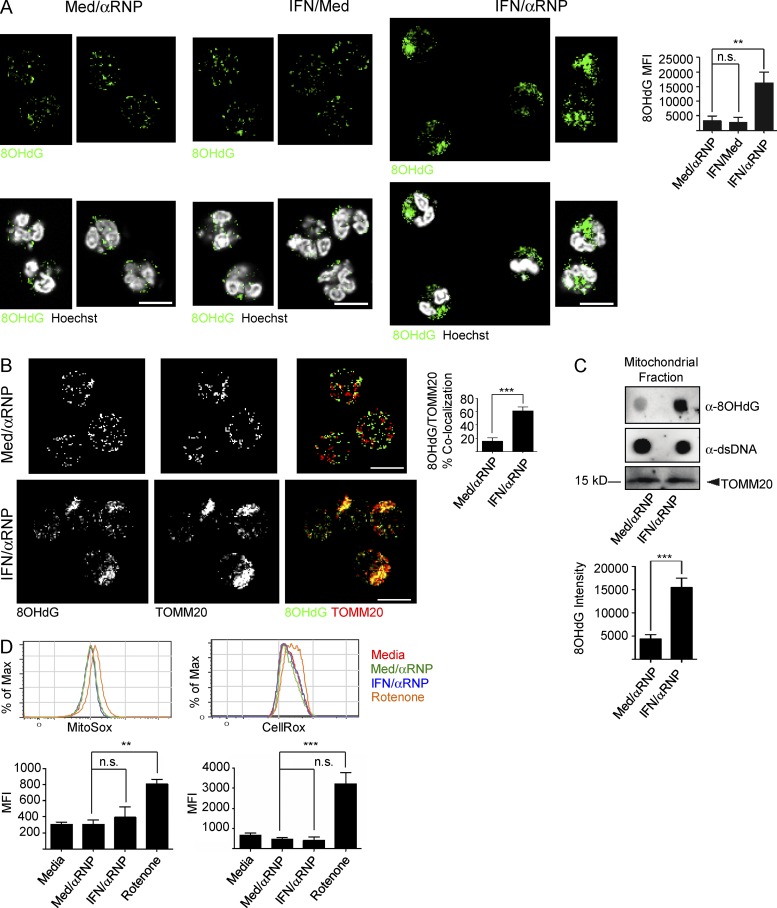
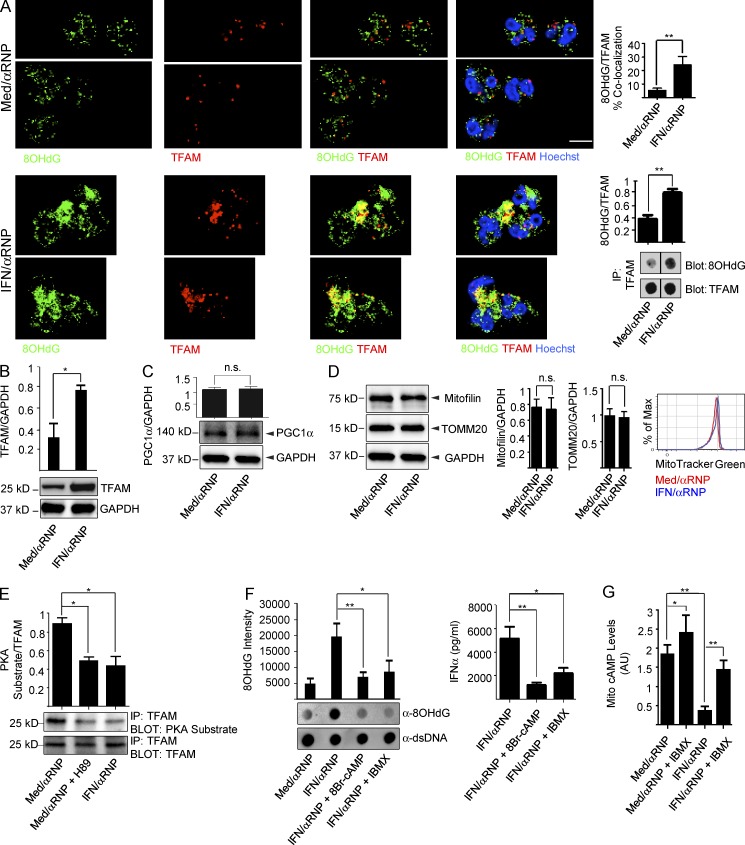
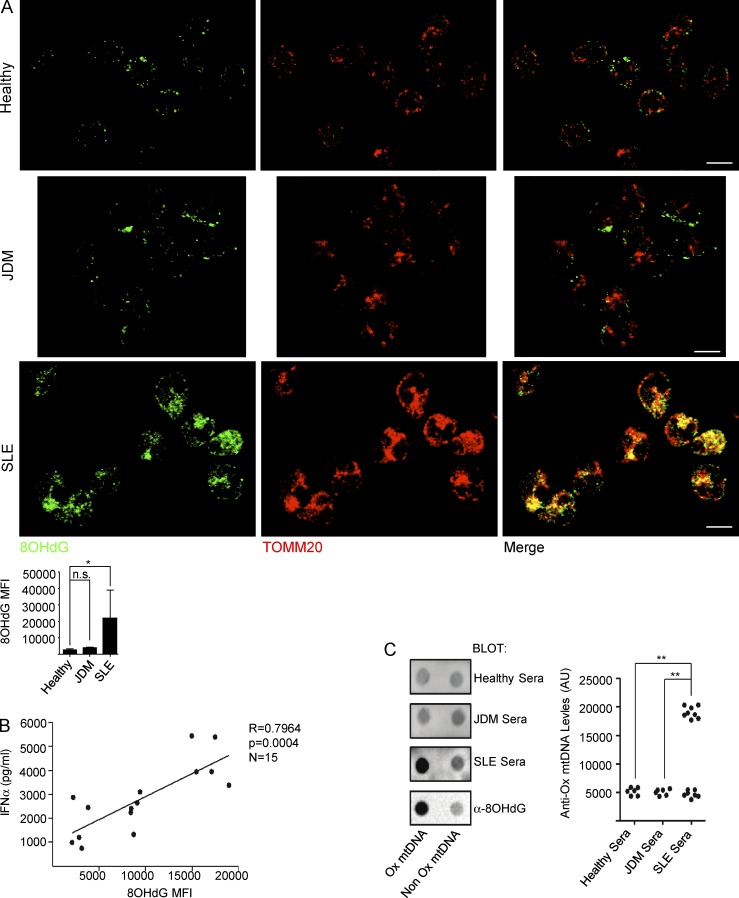
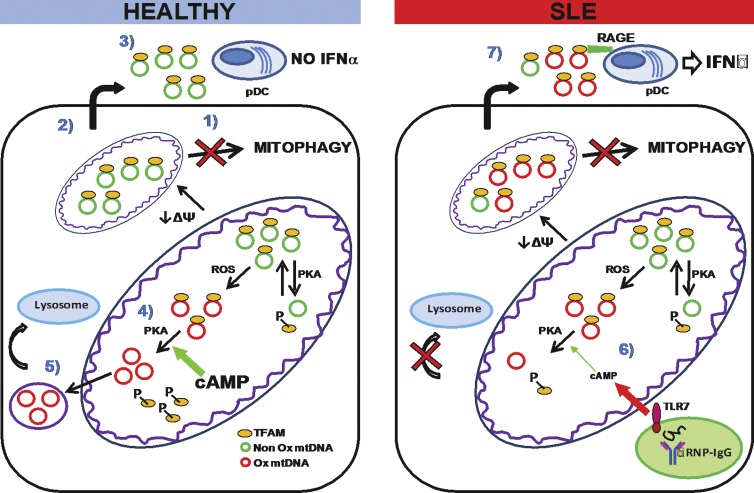
Autoantibodies against nucleic acids and excessive type I interferon (IFN) are hallmarks of human systemic lupus erythematosus (SLE). We previously reported that SLE neutrophils exposed to TLR7 agonist autoantibodies release interferogenic DNA, which we now demonstrate to be of mitochondrial origin. We further show that healthy human neutrophils do not complete mitophagy upon induction of mitochondrial damage. Rather, they extrude mitochondrial components, including DNA (mtDNA), devoid of oxidized (Ox) residues. When mtDNA undergoes oxidation, it is directly routed to lysosomes for degradation. This rerouting requires dissociation from the transcription factor A mitochondria (TFAM), a dual high-mobility group (HMG) protein involved in maintenance and compaction of the mitochondrial genome into nucleoids. Exposure of SLE neutrophils, or healthy IFN-primed neutrophils, to antiribonucleotide protein autoantibodies blocks TFAM phosphorylation, a necessary step for nucleoid dissociation. Consequently, Ox nucleoids accumulate within mitochondria and are eventually extruded as potent interferogenic complexes. In support of the in vivo relevance of this phenomenon, mitochondrial retention of Ox nucleoids is a feature of SLE blood neutrophils, and autoantibodies against Ox mtDNA are present in a fraction of patients. This pathway represents a novel therapeutic target in human SLE.


Figures

Figure 1.
Figure 1.
Live neutrophils extrude mtDNA–protein complexes. (A) Neutrophil supernatants from three healthy donors (HD) were run on agarose gels. High molecular weight complexes (mtC) yield a single DNA band of ∼16 Kb upon digestion with proteinase K (PK). (B) Amplification of the mitochondrial gene ND1, but not the nuclear gene GAPDH, from DNA isolated from live neutrophil supernatants. Total neutrophil DNA was used as control. (C) Neutrophil supernatant (Orig Sup) was immunoprecipitated with anti-dsDNA antibody. The beads (IP Beads) and the resulting supernatants (IP Sup) were analyzed by agarose gel (left) or by Western blot with anti-TFAM or anti-H3 antibodies (right). (D) Abundance of mitochondrial and genomic DNA was assessed on 5 ng of isolated DNA from live, NETotic, or necrotic neutrophil supernatants by Real-Time PCR (mtDNA Copy Number; top) or by conventional PCR (bottom). (E) LDH activity was measured in cell-free supernatants from live, NETotic, or necrotic neutrophil cultures. (F) Quantification of extruded mtDNA by Real-Time PCR in the presence of DPI (NADPH Inhibitor) or MT (mtROS scavenger). (G, left) Apoptosis progression in untreated or GM-CSF–treated neutrophils was assessed by TUNEL assay. The percentage of TUNEL+ cells is shown. (right) The amount of extruded mtDNA was assessed by Real-Time PCR (mtDNA Copy Number). (H, left) Extruded mtDNA was quantified by Picogreen. (right) mtDNA Copy Number in total cell DNA was quantified by Real-Time PCR. (I) The presence of TFAM, MnSOD, and TOMM20 was assessed in concentrated cell-free supernatants from live or necrotic neutrophils by Western blot. Coomassie staining of the BSA band was used as loading control. * indicates nonspecific band. (J) Surface expression of TOMM20, LAMP1, or Rab7 was assessed by flow cytometry on permeabilized (Total) or nonpermeabilized (Surface) neutrophils. Open gray histograms represent the isotype control. Δ MFI (Mean Fluorescence Intensity) = MFI antibody – MFI isotype control. (K–L) Extruded mtDNA (K) and TOMM20 plasma membrane expression (L) were measured in neutrophils treated with R837 (TLR7 agonist) in the presence or absence of IRS661 (TLR7 inhibitor) or with ODN2216 (TLR9 agonist). Data in B, C, and I are representative of three independent experiments with n = 3. Bars represent mean ± SD from at least three independent experiments, with n = 3–8. *, P < 0.05; **, P < 0.01; ***, P < 0.001.
Figure 2.
Figure 2.
Neutrophils fail to complete mitophagy in response to mitochondrial depolarization. (A) Mitochondrial depolarization was measured in neutrophils (top) and monocytes (bottom) in the presence of the protonophore CCCP or the complex I inhibitor Rotenone. (B, top) Neutrophils were treated with CCCP or Rotenone and extruded mtDNA was quantified by Real-Time PCR (mtDNA copy number) or conventional PCR. (bottom) Neutrophils or monocytes were treated with CCCP or Rotenone and extruded mtDNA was quantified by Picogreen. (C) Neutrophils or monocytes were treated with media or CCCP in the presence of 50 µM of the protein synthesis inhibitor cycloheximide. Total cell lysates were then analyzed by Western blot. TFAM/GAPDH ratio is shown on the right. (D) Neutrophils and monocytes were treated with CCCP for 60 min and immunostained with anti-TOMM20 and anti-LC3B antibodies or (E) with anti-LAMP1 and anti-TOMM20 antibodies. Bars, 10 µm. (F) Monocytes were treated with CCCP for 60 min in the presence of the lysosomal inhibitor Bafilomycin A1 (BafA1) and immunostained with anti-TOMM20 and anti-LAMP1 antibodies. Bars, 10 µm. (G) Mitochondria depolarization and extruded mtDNA levels (top) and quantification of autophagosome/lysosome fusion (bottom) in neutrophils treated with the combination Oligomycin (10 µM) and Antimycin (1 µM; O+A). Bars, 5 µm. (H) Fold up- (red) or down-regulation (green) of mitophagy-related transcripts in monocytes and neutrophils upon CCCP treatment. Transcript expression ratio in monocytes over neutrophils is shown on the left. Data were normalized to media-treated cells. Bars represent mean ± SD from at least three independent experiments with n = 3–6. **, P < 0.01; ***, P < 0.001.
Figure 3.
Figure 3.
MtDNA oxidation is required for pDC activation. (A, top) pDCs were incubated with supernatants from neutrophils treated with or without IFN ± αRNP. IFN-α levels were quantified after 18 h culture. (bottom) Extruded mtDNA or TFAM quantification (mtDNA copy number) in the supernatants from neutrophils treated with or without IFN ± αRNP. (B) Dot blot analysis, using anti-8OHdG or anti-dsDNA (loading control) antibodies, of the DNA isolated from the supernatants of neutrophils treated with or without IFN ± αRNP. Bars represent the quantification of 8OHdG intensity. (C) Neutrophils were stimulated with IFN/αRNP in the absence or in the presence of the mtROS scavenger MitoTempo (MT). Extruded mtDNA was assessed for its interferogenic effect on pDCs (top) and for its oxidation status (bottom). (D, top) Neutrophils were treated with IFN/αRNP in the presence of IRS661 (TLR7 inhibitor) or DVX42 (TLR8 inhibitor) and the corresponding supernatants were assessed for their interferogenic effect on pDCs. (bottom) The oxidation status of extruded mtDNA was assessed by dot blot. (E) IFN-α production by pDCs stimulated with LL-37 added to genomic DNA, Non-Ox, or Ox mtDNA, or with supernatants from IFN/αRNP-treated neutrophils. (F) IFN-α production by pDCs stimulated with Ox mtDNA with our without the TLR9 inhibitor ODN-TTAGGG. (G, top) DNA from IFN/αRNP activated neutrophil supernatants were immunoprecipitated with anti-dsDNA antibody. The IP was analyzed by Western blot with anti-LL37 or anti-HMGB1 antibodies. (bottom) IFN-α production by pDCs stimulated with interferogenic neutrophil supernatants in the presence or absence of the HMGB1 inhibitor BoxA. (H) IFN-α production was assessed after pDC incubation with interferogenic neutrophil supernatants in the presence or absence of anti-TFAM antibodies or recombinant RAGE-Fc chimera. (I) Neutrophils were treated as shown and mitochondrial depolarization was assessed with MitoTracker DeepRed; the amount of extruded mtDNA was assessed by Real-Time PCR and its oxidation status by 8OHdG dot blot. Bars represent mean ± SD from at least three independent experiments with n = 3–8. *, P < 0.05; **, P < 0.01; ***, P < 0.001.
Figure 4.
Figure 4.
Ox mtDNA is exported from mitochondria to lysosomes under steady-state conditions. (A) Cytoplasmic 8OHdG(+) staining in neutrophils and monocytes. Bar, 10 µm. (B) Live or apoptotic neutrophils were stained with anti-8OHdG antibody and the damaged nuclear DNA marker γH2A.X (top) or with TUNEL assay (bottom). Bar, 5 µm. (C and D) Cytosolic mtDNA copy number (C) and 8OHdG staining and quantification (D) in neutrophils treated with media, Rotenone or MitoTempo. The purity of the cytosolic fraction is also shown in (C). TCE = total cell extract. TOMM20 was used as mitochondrial marker. Bars, 10 µm. (E) Neutrophils were treated with the lysosomal inhibitor Bafilomycin A1 (BafA1) and stained with anti-8OHdG and anti-LAMP1 antibodies. Bars, 10 µm. (F) Supernatant (Sup) from the mitochondrial budding assay was subjected to Western blot analysis (top) or analyzed for mtDNA content (bottom) by agarose gel. The mitochondrial fraction (Mitos) was loaded as control. * indicates nonspecific band. Data in B–F are representative of three independent experiments, with n = 3. Bars represent mean ± SD from at least three independent experiments, with n = 3–5. *, P < 0.05; **, P < 0.01; ***, P < 0.001.
Figure 5.
Figure 5.
IFN/αRNP activation of neutrophils induces intramitochondrial retention of Ox mtDNA. (A) Cytoplasmic 8OHdG(+) staining in neutrophils treated with or without IFN ± αRNP. 8OHdG quantification is also shown. Bars, 10 µm. (B) Neutrophils were treated with or without IFN ± αRNP and co-stained with anti-8OHdG and anti-TOMM20 antibodies. Bars, 10 µm. (C) Alternatively, mtDNA was extracted and analyzed by dot blot with anti-8OHdG and anti-dsDNA antibodies. TOMM20 was used as loading control. (D) Neutrophils were treated with or without IFN ± αRNP, and the production of mtROS or total cellular ROS was quantified by MitoSox or CellRox, respectively. Bars represent mean ± SD from at least three independent experiments, with n = 3–6. **, P < 0.01; ***, P < 0.001.
Figure 6.
Figure 6.
IFN/αRNP inhibit the dissociation of Ox mtDNA and TFAM. (A) Neutrophils were treated as shown and co-stained with anti-8OHdG and anti-TFAM antibodies. Bars, 10 µm. Alternatively, cell lysates were subjected to IP with anti-TFAM antibody and the immunoprecipitates were analyzed by dot blot. (B–D) Neutrophils were treated as shown and cell lysates were analyzed by Western blot with antibodies against TFAM (B), PGC1α (C), Mitofilin or TOMM20 (D), and GAPDH as control. Total mitochondrial mass was assessed by MitoTracker Green (D). (E) Neutrophils were treated as shown and cell lysates were subjected to IP with anti-TFAM antibody. The immunoprecipitates were then blotted with antibodies against PKA-phosphorylated peptides (α-PKA sub) or TFAM (loading control). The PKA inhibitor H89 was used as a control. (F) Neutrophils were treated with αRNP ± IFN in the presence or absence of the cAMP analogue 8Br-cAMP or the PDE inhibition IBMX. Extruded mtDNA was analyzed by dot blot (left) and supernatants were assessed for their interferogenic capacity on pDCs (right). (G) Neutrophils were treated as shown and cAMP levels were measured in the enriched mitochondrial fraction. cAMP levels were normalized to the total protein content and expressed in arbitrary units (AU). Bars represent mean ± SD from at least three independent experiments, with n = 3–5. *, P < 0.05; **, P < 0.01.
Figure 7.
Figure 7.
Intramitochondrial Ox mtDNA is a feature of SLE blood neutrophils. (A) Freshly isolated neutrophils from, healthy, JDM, or SLE blood were co-stained with anti-8OHdG and anti-TOMM20 antibodies. Bars, 10 µm. Quantification of 8OHdG staining in neutrophils from healthy donors (n = 6), JDM (n = 6), and SLE (n = 14) patients is also shown. (B) Correlation between Ox mtDNA levels in SLE neutrophils and IFN-α production by pDCs upon activation with corresponding SLE neutrophil supernatants. (n = 15). (C) Healthy (n = 6), JDM (n = 6), or SLE (n = 15) sera were assessed for the presence of anti-Ox mtDNA autoantibodies. Anti-8OHdG antibody was used as a control. *, P < 0.05; **, P < 0.01.
Figure 8.
Figure 8.
Proposed effect of IFN/αRNP on neutrophil mitochondria. (left) MtDNA is normally found in complex with TFAM in the mitochondrial matrix of healthy neutrophils. In the steady state, mitochondria can undergo oxidative damage and/or depolarization (↓ΔΨ). While most cells remove damaged mitochondria through mitophagy, this process does not take place in neutrophils (1). Instead, healthy neutrophils extrude matrix components into the extracellular space (2). These include mtDNA–TFAM complexes devoid of Ox DNA. These complexes do not activate pDCs (3). MtDNA undergoing oxidation is removed through an alternative route. Thus, TFAM dissociates from it upon phosphorylation by the matrix-resident PKA (4). TFAM is then degraded and Ox mtDNA is sorted into vesicles directed to lysosomes (5). (right) In SLE, neutrophil activation with TLR7-agonist autoantibodies leads to decreased mitochondrial cAMP levels (6) and reduced matrix PKA activity. As a result, TFAM is not efficiently disassembled from Ox mtDNA. This leads to intramitochondrial retention and extrusion of Ox nucleoids. Extracellular Ox nucleoids activate pDCs in a TFAM/RAGE-dependent manner (7).

Comment in

References

    1. Acin-Perez R., Salazar E., Kamenetsky M., Buck J., Levin L.R., and Manfredi G.. 2009. Cyclic AMP produced inside mitochondria regulates oxidative phosphorylation. Cell Metab. 9:265–276. 10.1016/j.cmet.2009.01.012 - DOI - PMC - PubMed
    1. Al-Mayouf S.M., Sunker A., Abdwani R., Abrawi S.A., Almurshedi F., Alhashmi N., Al Sonbul A., Sewairi W., Qari A., Abdallah E., et al. . 2011. Loss-of-function variant in DNASE1L3 causes a familial form of systemic lupus erythematosus. Nat. Genet. 43:1186–1188. 10.1038/ng.975 - DOI - PubMed
    1. Ashrafi G., and Schwarz T.L.. 2013. The pathways of mitophagy for quality control and clearance of mitochondria. Cell Death Differ. 20:31–42. 10.1038/cdd.2012.81 - DOI - PMC - PubMed
    1. Bennett L., Palucka A.K., Arce E., Cantrell V., Borvak J., Banchereau J., and Pascual V.. 2003. Interferon and granulopoiesis signatures in systemic lupus erythematosus blood. J. Exp. Med. 197:711–723. 10.1084/jem.20021553 - DOI - PMC - PubMed
    1. Bentham J., Morris D.L., Cunninghame Graham D.S., Pinder C.L., Tombleson P., Behrens T.W., Martín J., Fairfax B.P., Knight J.C., Chen L., et al. . 2015. Genetic association analyses implicate aberrant regulation of innate and adaptive immunity genes in the pathogenesis of systemic lupus erythematosus. Nat. Genet. 47:1457–1464. 10.1038/ng.3434 - DOI - PMC - PubMed

Publication types

MeSH terms