. 2016 May 2;213(5):667-75.
doi: 10.1084/jem.20151948. Epub 2016 Apr 18.

TREM2-mediated early microglial response limits diffusion and toxicity of amyloid plaques

Affiliations

TREM2-mediated early microglial response limits diffusion and toxicity of amyloid plaques

Yaming Wang et al. J Exp Med. .

Abstract

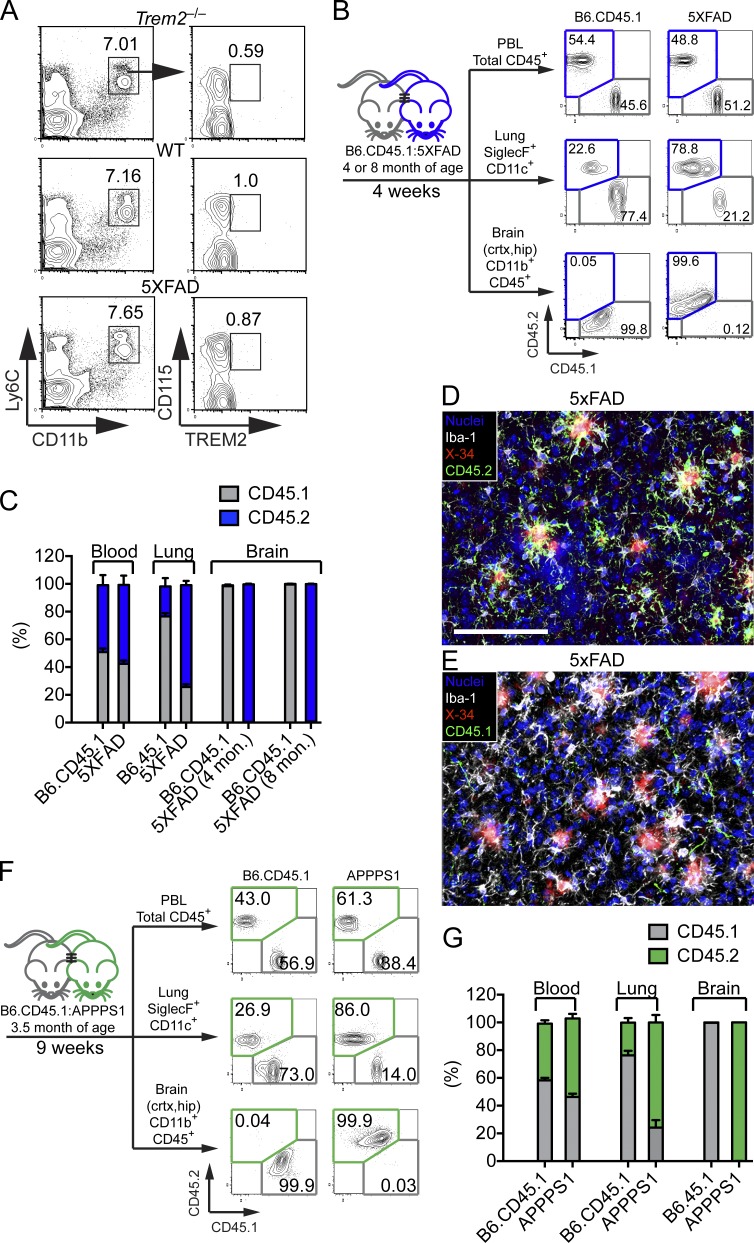
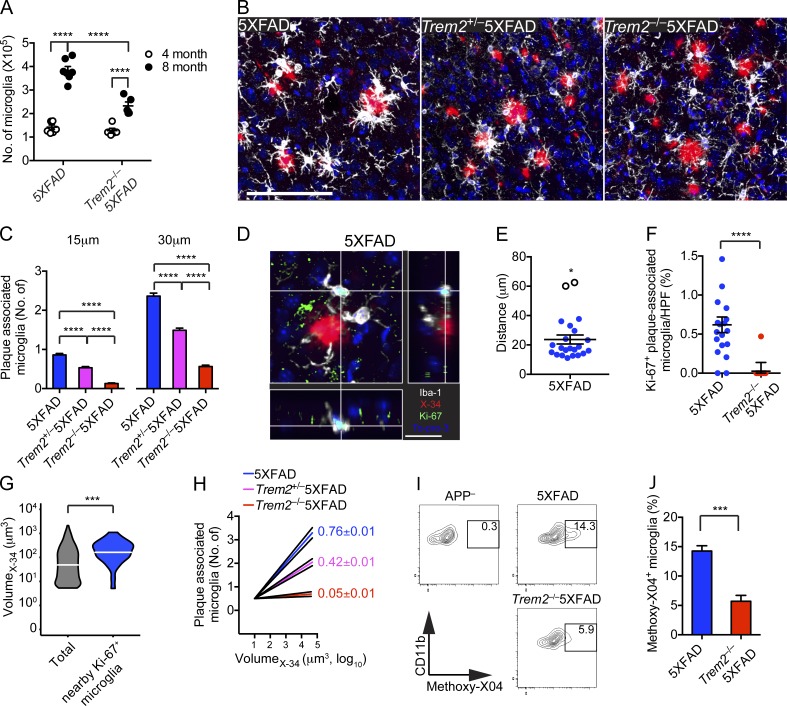
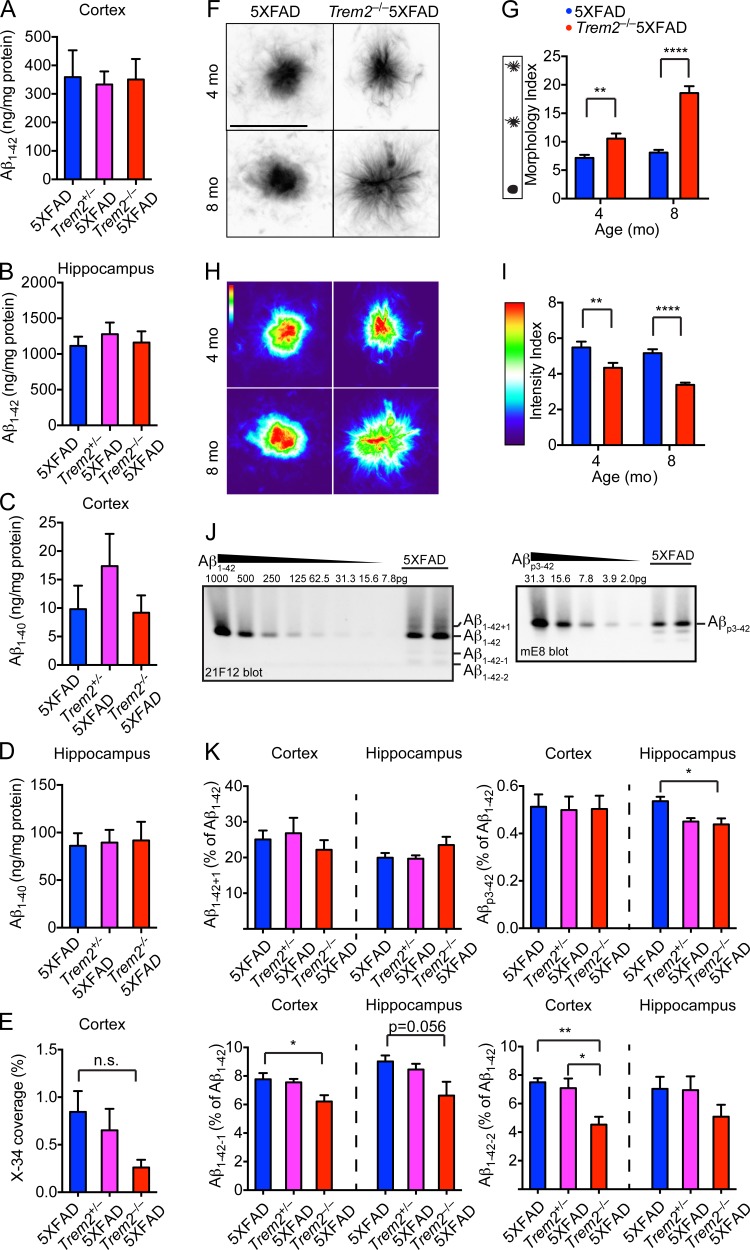
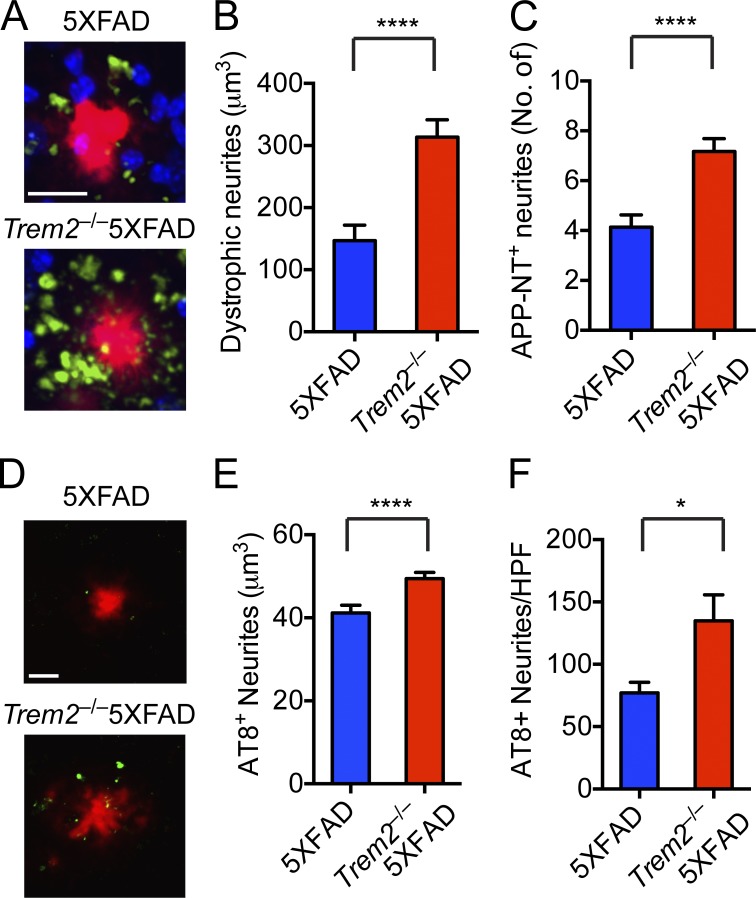
Triggering receptor expressed on myeloid cells 2 (TREM2) is a microglial receptor that recognizes changes in the lipid microenvironment, which may occur during amyloid β (Aβ) accumulation and neuronal degeneration in Alzheimer's disease (AD). Rare TREM2 variants that affect TREM2 function lead to an increased risk of developing AD. In murine models of AD, TREM2 deficiency prevents microglial clustering around Aβ deposits. However, the origin of myeloid cells surrounding amyloid and the impact of TREM2 on Aβ accumulation are a matter of debate. Using parabiosis, we found that amyloid-associated myeloid cells derive from brain-resident microglia rather than from recruitment of peripheral blood monocytes. To determine the impact of TREM2 deficiency on Aβ accumulation, we examined Aβ plaques in the 5XFAD model of AD at the onset of Aβ-related pathology. At this early time point, Aβ accumulation was similar in TREM2-deficient and -sufficient 5XFAD mice. However, in the absence of TREM2, Aβ plaques were not fully enclosed by microglia; they were more diffuse, less dense, and were associated with significantly greater neuritic damage. Thus, TREM2 protects from AD by enabling microglia to surround and alter Aβ plaque structure, thereby limiting neuritic damage.


Figures

Figure 1.
Figure 1.
Lack of monocyte contribution to amyloid-associated microglia. (A) Surface expression of TREM2 among Ly6C+CD11b+CD115+ blood monocytes in WT and 5XFAD mice. Trem2−/− mice were used as negative controls. (B–E) Parabiosis was performed by joining blood circulation of 4- or 8-mo-old 5XFAD with age matched B6.CD45.1 congenic mice for 4 wk. (B) CD45+ blood leukocytes, CD11c+SiglecF+ lung alveolar macrophages, and brain CD11b+F4/80+ microglia from parabionts were analyzed by flow cytometry. (C) Frequencies of CD45.1+ and CD45.2+ cells were compared in parabiotic partners. (D and E) Representative images of brain sections of an 8-mo-old 5XFAD parabiont stained with X-34 (red) for Aβ plaques and Iba-1 (white) for microglia. Contribution of host- and donor-derived microglia was examined using antibodies specific for CD45.2 (green; D) and CD45.1 (green; E). Nuclei were visualized with To-pro3 (blue). Bar, 100 µm (F and G) Parabiosis was performed using APPPS1-21 mice and age-matched B6.CD45.1 congenic mice for 9 wk. Parabionts were analyzed as described above. Data represent a total of five to seven mice per group in A–E and four mice per group in F and G.
Figure 2.
Figure 2.
Impaired microglial response to Aβ deposits in Trem2−/− 5XFAD mice is apparent by 4 mo. (A) Total numbers of microglia in the cortices and hippocampi of 5XFAD and Trem2−/− 5XFAD mice at 4 and 8 mo of age. (B and C) Microglial response to Aβ plaques in 4-mo-ol 5XFAD, Trem2+/− 5XFAD, and Trem2−/−5XFAD mice. (B) Representative images show matching cortical regions stained with X-34 (red) for amyloid plaques and Iba-1 (white) for microglia. Nuclei were visualized with To-pro3 (blue). (C) Numbers of microglia within 15 or 30 µm of Aβ plaques. (D–F) Microglia proliferation in 5XFAD and Trem2−/− 5XFAD mice was assessed by determining nuclear localization of Ki-67. (D) Representative sectional view of a confocal image shows expression of Ki-67 (green), microglia (Iba-1; white), and nuclei (blue). The proximity of Ki-67+ microglia to Aβ plaques (X-34, red), in cortices of 5XFAD mice is visualized. (E) Proximity of Ki-67+ microglia to the nearest plaque in cortices of 5XFAD. Unfilled circles (*) represent outliers as determined by q-test. (F) Frequencies of Ki-67+ microglia per HPF in 5XFAD and Trem2−/−5XFAD mice. (G) The volume of all observed Aβ plaques and Aβ plaques with Ki-67+ in close proximity were compared. (H) The log10-transformed volume of plaques was plotted against the number of microglia within 15 µm. Numbers represent slope ±95% confidence interval. (I and J) 5XFAD and Trem2−/− 5XFAD mice were injected with methoxy-X04 and the percentage of microglia with internalized methoxy-X04 (indicative of fibrillar Aβ) was determined by flow cytometry. (I) Representative plots show methoxy-x04 positivity of CD11b+CD45lo cells. APP transgene negative (APP) littermates were used as negative controls. (J) The frequency of methoxy-X04+ microglia was quantified. Bars: (B) 100 µm; (D) 20 µm. Error bar represents mean ± SEM. *, P < 0.05; ***, P < 0.001; ****, P < 0.0001, Mann-Whitney (A, F, and J) and q-test (E). Data represent a total of five to seven mice per group (A–F). For confocal images, a total of four random HPF were analyzed per mouse.
Figure 3.
Figure 3.
TREM2 deficiency alters physical appearance and biochemical composition of amyloid plaques. (A–D) Accumulation of insoluble Aβ1-42 (A and B) and Aβ1-40 (C and D) in the cortices and hippocampi of 4-mo-old 5XFAD, Trem2+/−5XFAD, and Trem2−/−5XFAD mice was determined by ELISA. (E) Deposition of fibrillar Aβ in the cortices determined by X-34 staining. Levels of X-34 signal in the hippocampi were below the threshold of detection. (F–I) Morphology of fibrillar plaques in 4-mo-old 5XFAD and Trem2−/−5XFAD mice. X-34–reactive fibrillar plaques were visualized using high-resolution confocal microscopy (F) and converted to heat-map images based on pixel intensity (H). Physical appearance of X-34-reactive fibrillar plaques was further quantified based on morphology (G) and pixel intensity (I). Diffuse shape and reduced density were also apparent in 8-mo-old Trem2−/−5XFAD mice (F and H). (J) Representative urea immunoblots showing the detection of Aβ1-42, Aβ1-42+1, Aβ1-42-1, Aβ1-42-2, and Aβp3-42 from insoluble fractions of hippocampi from 5XFAD mice. (K) Quantification of insoluble Aβ species by urea immunoblots in the cortices and hippocampi of 5XFAD, Trem2+/−5XFAD, and Trem2−/−5XFAD mice. Abundance of Aβ1-42+1, Aβ1-42-1, Aβ1-42-2, and Aβp3-42 relative to Aβ1-42 is shown. Amount of Aβ used for standard curves are indicated. Bar, 10 µm. *, P < 0.05; ** P < 0.01; ****, P < 0.0001, Mann-Whitney (G and I), two-way ANOVA (E and K). Data represent a total of 8–14 mice per group in A–E, eight mice per group in F–I and five mice per group in K. For confocal images, a total of four random HPF were analyzed per mouse. Error bar represents mean ± SEM.
Figure 4.
Figure 4.
Neuritic dystrophy and the amounts of phospho-tau in proximity to plaques are markedly increased in the absence of TREM2. (A–C) Neuritic dystrophy in 5XFAD and Trem2−/−5XFAD mice was visualized using 22C11 mAb against the APP N terminus (APP-NT). (A) Representative images show APP-NT+ neurites (green), Aβ plaques (X-34; red), and nuclei (To-pro3; blue). (B and C) Quantification of total volume and numbers of APP-NT+ neurites within 30 µm of Aβ plaques. (D–F) Hyperphosphorylated tau in 5XFAD and Trem2−/−5XFAD mice. Sections were stained with anti–phospho-tau antibody (AT8; green) and Aβ plaques (red; D). Total volume of AT8+ neurites (E) and the number of AT8+ spots per HPF (F) were quantified. Bar, 20 µm. *, P < 0.05; ****, P < 0.0001, by Mann-Whitney. Data represent a total of four to eight mice per group. For confocal images, a total of four random HPF were analyzed per mouse. Error bar represents mean ± SEM.

References

    1. Brendza R.P., O’Brien C., Simmons K., McKeel D.W., Bales K.R., Paul S.M., Olney J.W., Sanes J.R., and Holtzman D.M.. 2003. PDAPP; YFP double transgenic mice: a tool to study amyloid-beta associated changes in axonal, dendritic, and synaptic structures. J. Comp. Neurol. 456:375–383. 10.1002/cne.10536 - DOI - PubMed
    1. Butovsky O., Jedrychowski M.P., Moore C.S., Cialic R., Lanser A.J., Gabriely G., Koeglsperger T., Dake B., Wu P.M., Doykan C.E., et al. 2014. Identification of a unique TGF-β-dependent molecular and functional signature in microglia. Nat. Neurosci. 17:131–143. 10.1038/nn.3599 - DOI - PMC - PubMed
    1. Cannon J.P., O’Driscoll M., and Litman G.W.. 2012. Specific lipid recognition is a general feature of CD300 and TREM molecules. Immunogenetics. 64:39–47. 10.1007/s00251-011-0562-4 - DOI - PubMed
    1. Condello C., Yuan P., Schain A., and Grutzendler J.. 2015. Microglia constitute a barrier that prevents neurotoxic protofibrillar Aβ42 hotspots around plaques. Nat. Commun. 6:6176 10.1038/ncomms7176 - DOI - PMC - PubMed
    1. Daws M.R., Sullam P.M., Niemi E.C., Chen T.T., Tchao N.K., and Seaman W.E.. 2003. Pattern recognition by TREM-2: binding of anionic ligands. J. Immunol. 171:594–599. 10.4049/jimmunol.171.2.594 - DOI - PubMed

Publication types

MeSH terms