. 2016 Jun;67(6):1263-72.
doi: 10.1161/HYPERTENSIONAHA.116.07286. Epub 2016 Apr 18.

Placental Growth Factor Reduces Blood Pressure in a Uteroplacental Ischemia Model of Preeclampsia in Nonhuman Primates

Affiliations

Placental Growth Factor Reduces Blood Pressure in a Uteroplacental Ischemia Model of Preeclampsia in Nonhuman Primates

Angela Makris et al. Hypertension. 2016 Jun.

Abstract

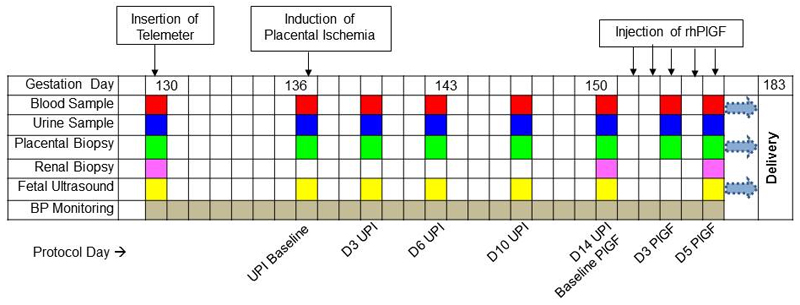
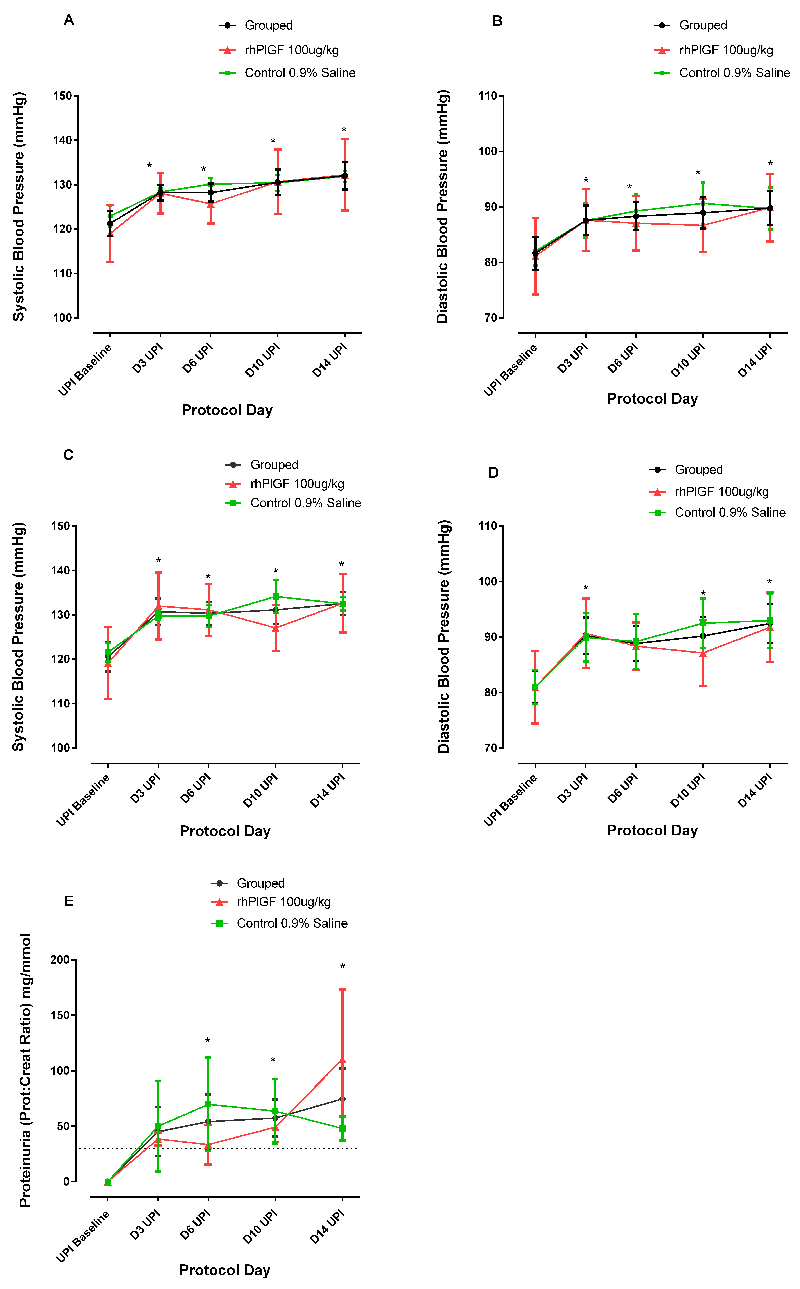
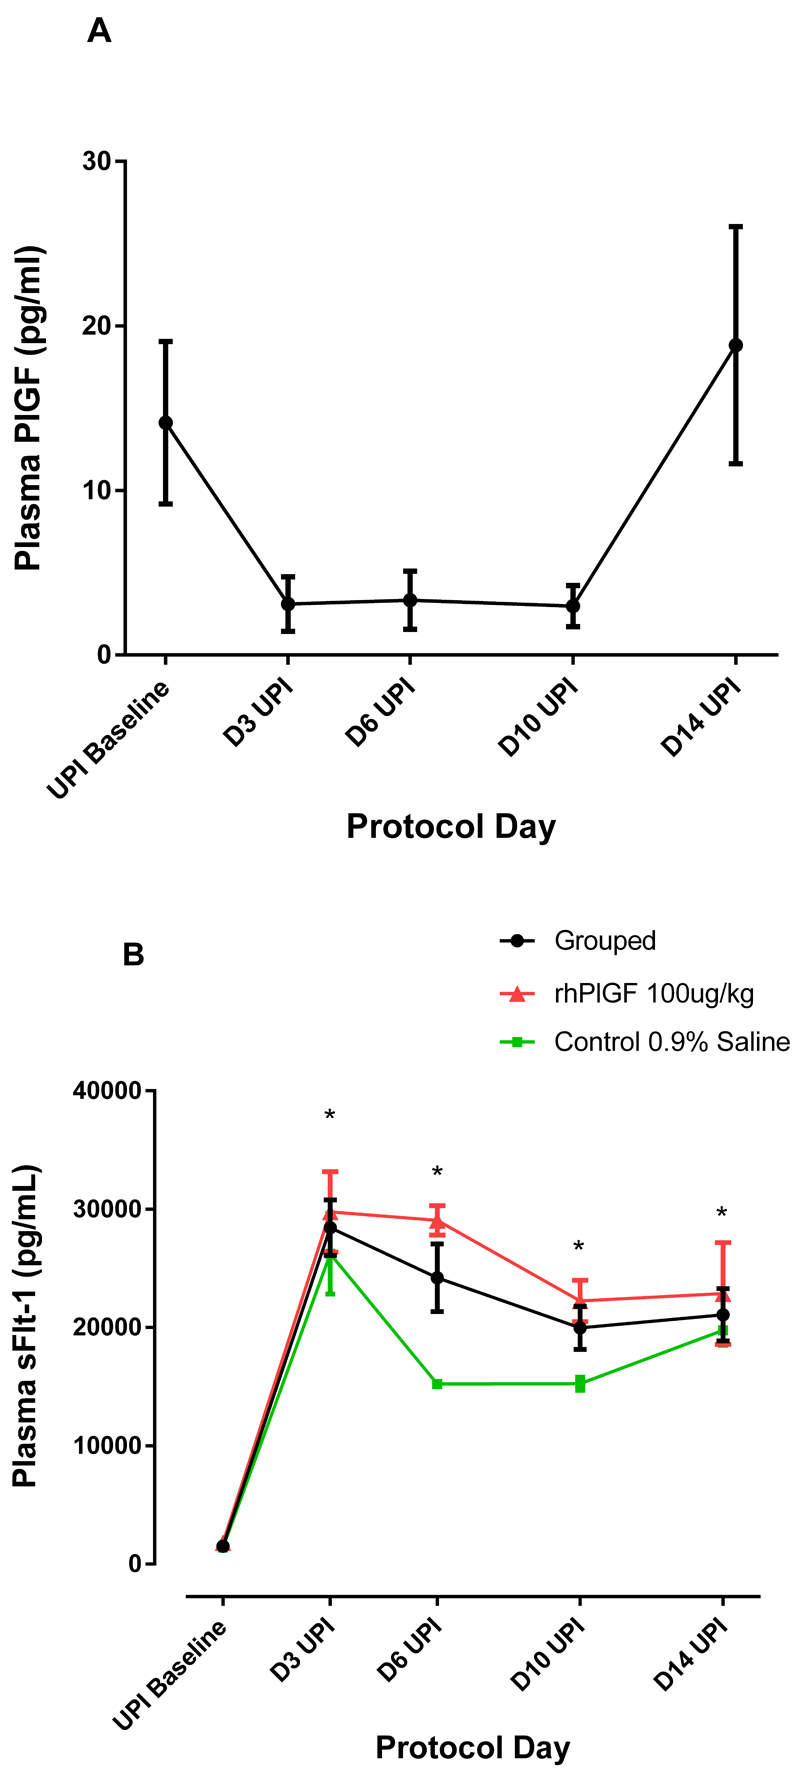
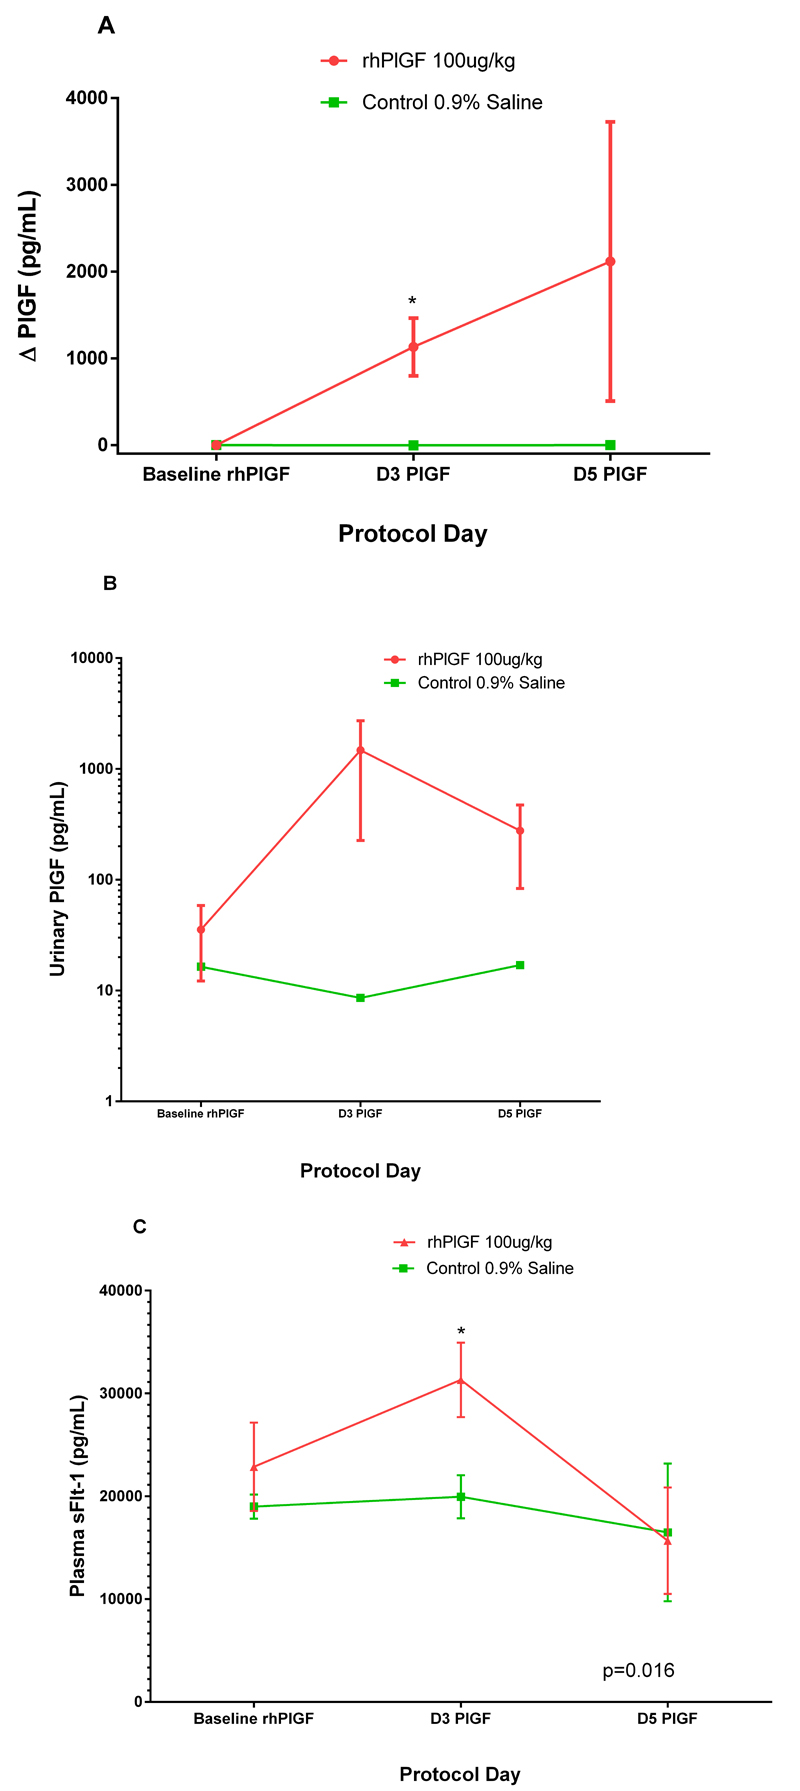
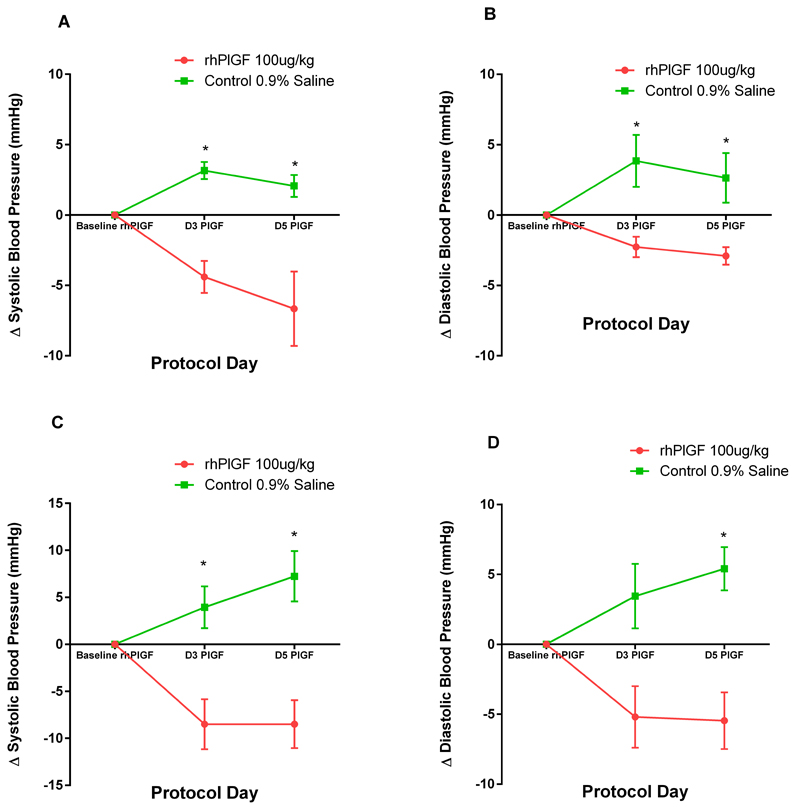
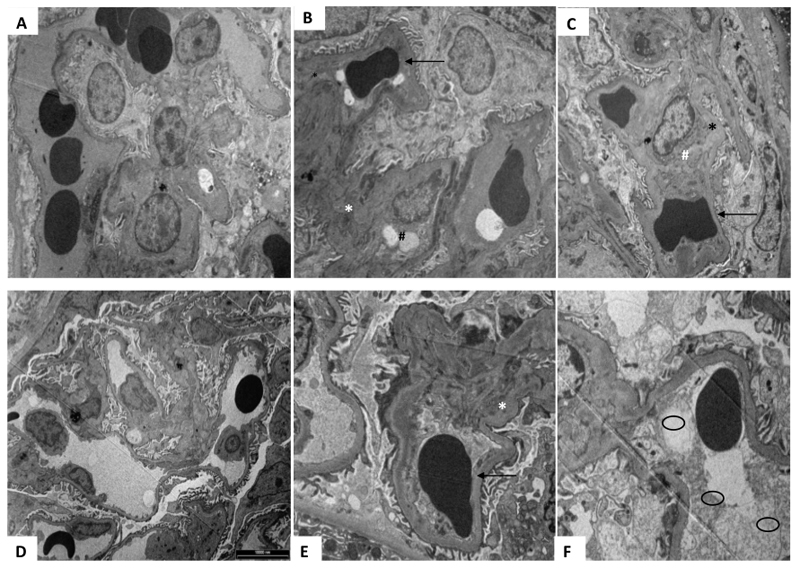
An imbalance in the angiogenesis axis during pregnancy manifests as clinical preeclampsia because of endothelial dysfunction. Circulating soluble fms-like tyrosine kinase 1 (sFLT-1) increases and placental growth factor (PlGF) reduces before and during disease. We investigated the clinical and biochemical effects of replenishing the reduced circulating PlGF with recombinant human PlGF (rhPlGF) and thus restoring the angiogenic balance. Hypertensive proteinuria was induced in a nonhuman primate (Papio hamadryas) by uterine artery ligation at 136 days gestation (of a 182-day pregnancy). Two weeks after uteroplacental ischemia, rhPlGF (rhPlGF, n=3) or normal saline (control, n=4) was administered by subcutaneous injection (100 μg/kg per day) for 5 days. Blood pressure was monitored by intra-arterial radiotelemetry and sFLT-1 and PlGF by ELISA. Uteroplacental ischemia resulted in experimental preeclampsia evidenced by increased blood pressure, proteinuria, and endotheliosis on renal biopsy and elevated sFLT-1. PlGF significantly reduced after uteroplacental ischemia. rhPlGF reduced systolic blood pressure in the treated group (-5.2±0.8 mm Hg; from 132.6±6.6 mm Hg to 124.1±7.6 mm Hg) compared with an increase in systolic blood pressure in controls (6.5±3 mm Hg; from 131.3±1.5 mm Hg to 138.6±1.5 mm Hg). Proteinuria reduced in the treated group (-72.7±55.7 mg/mmol) but increased in the control group. Circulating levels of total sFLT-1 were not affected by the administration of PlGF; however, a reduction in placental sFLT-1 mRNA expression was demonstrated. There was no significant difference between the weights or lengths of the neonates in the rhPlGF or control group; however, this study was not designed to assess fetal safety or outcomes. Increasing circulating PlGF by the administration of rhPlGF improves clinical parameters in a primate animal model of experimental preeclampsia.

Keywords: animal model; hypertension; placental growth factor; preeclampsia/pregnancy.


Conflict of interest statement

Conflicts of Interest/ Disclosures

Ravi Thadhani is co-inventor of patents related to diagnostics in the prediction of preeclampsia that have been out-licensed to diagnostic companies and has financial interest in Aggamin LLC. Ravi Thadhani also reports serving as a consultant to Roche diagnostics. S. Ananth Karumanchi is co-inventor of multiple patents related to the use of angiogenic proteins for the diagnosis and therapy of preeclampsia. These patents have been licensed to multiple companies. S. Ananth Karumanchi also reports serving as a consultant to Roche Diagnostics, Siemens and Thermofisher and has financial interest in Aggamin LLC.

Figures

Figure 1:
Figure 1:
Timeline demonstrating the gestation at which procedures were performed. The timing of blood samples (red box), urine samples (blue box), placental biopsies (green box), renal biopsies (pink box) and fetal ultrasounds (yellow box) are demonstrated. D= day, rhPlGF = recombinant human placental growth factor.
Figure 2:
Figure 2:
Effects of Uteroplacental ischemia (UPI) on blood pressure a) systolic (SBP) and b) diastolic (DBP) blood pressure (mmHg) during sleep and c) systolic and d) diastolic blood pressure during awake periods and e) proteinuria (expressed as the spot urinary protein: urinary creatinine ratio) on protocol days 3, 6, 10 and 14 after uteroplacental ischemia. Data for the control (n=4, green line), treated (n=3, red line) and total group (n=7, black line) is demonstrated on each graph. * indicates a significant difference of the grouped result compared to baseline blood pressure p<0.001.
Figure 3:
Figure 3:
Effects of UPI on a) Plasma PlGF Grouped data (n=7) plasma PlGF at protocol days 3, 6, 10 and 14 after UPI. There is a significant change over time (p=0.025). b) Plasma total sFLT-1 after UPI at protocol days 3, 6, 10 and 14 after UPI for the control (n=4, green line), treated (n=3, red line) and total group (n=7, black line) is demonstrated. * indicates a significant difference of the grouped result compared to baseline sFLT-1 concentration p<0.001.
Figure 4:
Figure 4:
Changes in PlGF and sFLT-1 after rhPlGF. a) plasma PlGF concentrations (pg/mL) in control (n=4,green line) and treated (n=3, red line) groups after the administration of rhPlGF 100μg/kg or 0.9% saline subcutaneously in equal volumes respectively. *The rhPlGF concentrations at Day 3 of injection are significantly higher in the rhPlGF group compared to the control group (p=0.027). b) urinary PlGF PlGF concentrations (pg/mL) in control (n=4,green line) and treated (n=3, red line) groups after the administration of rhPlGF 100μg/kg or 0.9% saline subcutaneously in equal volumes respectively. c) Changes in plasma sFLT-1 concentrations (pg/mL) in control (n=4, green line) and treated (n=3, red line) groups after the administration of rhPlGF 100μg/kg or 0.9% saline subcutaneously in equal volumes respectively. *The total sFLT-1 concentrations at Day 3 of injection are significantly higher in the rhPlGF group compared to the control group (p=0.016).
Figure 5:
Figure 5:
Change in a) systolic blood pressure b) diastolic blood pressure whilst asleep and c) systolic blood pressure and d) diastolic blood pressure awake (mmHg) after 3 and 5 days of rhPlGF 100μg/kg or control (0.9% normal saline) injections. The change in blood pressure in the control group (n=4, green line) and treated group (n=3, red line) is compared to the blood pressure after 14 days of UPI (Baseline PlGF). * indicates a significant difference compared to baseline PlGF, p<0.05.
Figure 6:
Figure 6:
Change in proteinuria in spot urinary protein : creatinine ratio (mg/mmol)) after 3 and 5 days of rhPlGF 100μg/kg (n=3, red line) or control (0.9% normal saline: n=4, green line) injections. The change in proteinuria is compared to the concentration after 14 days of UPI (Baseline PlGF). * indicates a significant difference compared baseline PlGF, p<0.05.
Figure 7:
Figure 7:
Electron microscopy of renal biopsies undertaken during the protocol at baseline (A + D), Day 14 of UPI (B+E) and after 5 days (C +F) of rhPlGF or control respectively. (A-C) Demonstrates the changes over time in a control animal. At baseline (A) there are no significant changes noted, importantly the vascular endothelium and vessels appear normal. After 14 days of UPI (B) there are changes consistent human- like preeclampsia such as subendothelial deposits (*), endothelial cells cytoplasmic vacuoles (#) and reduction in capillary lumen demonstrated by a compressed red blood cell (→). After 5 days of 0.9% normal saline (Control group), there is no resolution of the endothelial and other changes noted previously. (D-F) Demonstrates the changes over time in a treated animal (rhPlGF). At baseline (D) there are no significant changes noted, importantly the vascular endothelium and vessels appear normal and endothelial cells are present and appear normal. After 14 days of UPI (E) there are changes consistent with human- like preeclampsia such as subendothelial deposits (*) and reduction in capillary lumen demonstrated by compressed red blood cell (→). After 5 days of rhPlGF, there is a marked improvement in the changes noted. The capillary lumen is improved (○), although not restored, and there is a substantial reduction in subendothelial deposits.
Figure 8:
Figure 8:
Changes in chorionic villous sampling expression of sFLT-1 mRNA after 3 days of rhPlGF 100μg/kg (red bars) or control (0.9% normal saline, green bars) injections. There was a significant difference in the alteration of sFLT-1 mRNA expressed in the placenta (p<0.05).

Comment in

References

    1. Redman CW, Sargent IL, Staff AC. Ifpa senior award lecture: Making sense of pre-eclampsia - two placental causes of preeclampsia? Placenta. 2014;35(Suppl):S20–25. - PubMed
    1. Levine RJ, Maynard SE, Qian C, Lim KH, England LJ, Yu KF, Schisterman EF, Thadhani R, Sachs BP, Epstein FH, Sibai BM, Sukhatme VP, Karumanchi SA. Circulating angiogenic factors and the risk of preeclampsia. N Engl J Med. 2004;350:672–683. - PubMed
    1. Savvidou MD, Akolekar R, Zaragoza E, Poon LC, Nicolaides KH. First trimester urinary placental growth factor and development of pre-eclampsia. Bjog. 2009;116:643–647. - PubMed
    1. Thadhani R, Mutter WP, Wolf M, Levine RJ, Taylor RN, Sukhatme VP, Ecker J, Karumanchi SA. First trimester placental growth factor and soluble fms-like tyrosine kinase 1 and risk for preeclampsia. J Clin Endocrinol Metab. 2004;89:770–775. - PubMed
    1. Akolekar R, Syngelaki A, Poon L, Wright D, Nicolaides KH. Competing risks model in early screening for preeclampsia by biophysical and biochemical markers. Fetal Diagn Ther. 2013;33:8–15. - PubMed

Publication types

MeSH terms

Substances