. 2016 Jun;67(6):1321-30.
doi: 10.1161/HYPERTENSIONAHA.116.07175. Epub 2016 Apr 18.

Estrogen Receptor-α in the Medial Amygdala Prevents Stress-Induced Elevations in Blood Pressure in Females

Affiliations

Estrogen Receptor-α in the Medial Amygdala Prevents Stress-Induced Elevations in Blood Pressure in Females

Antentor Othrell Hinton Jr et al. Hypertension. 2016 Jun.

Abstract

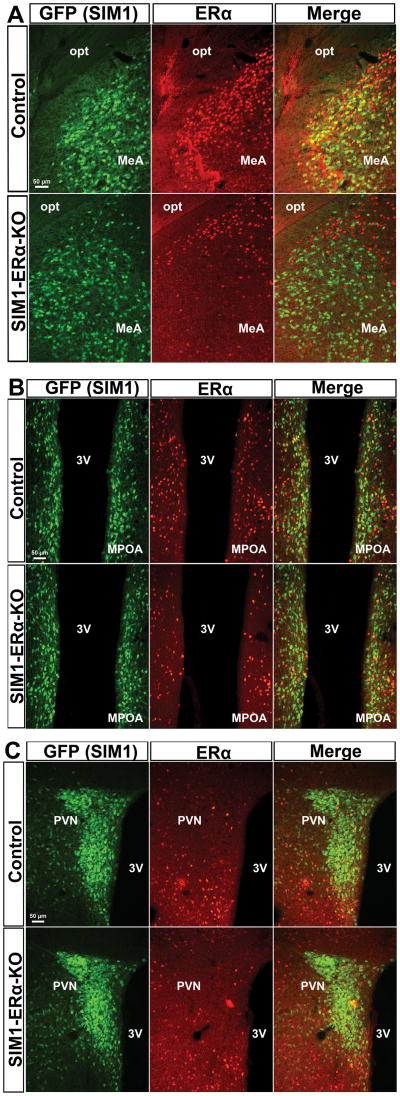
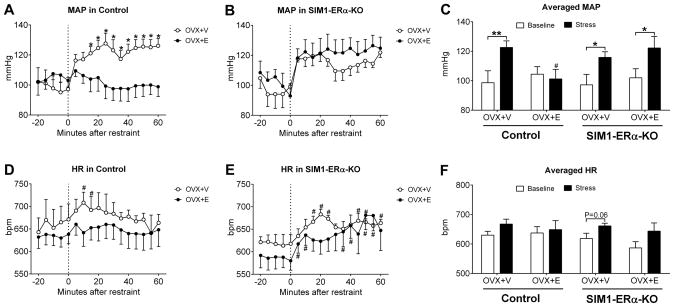
Psychological stress contributes to the development of hypertension in humans. The ovarian hormone, estrogen, has been shown to prevent stress-induced pressor responses in females by unknown mechanisms. Here, we showed that the antihypertensive effects of estrogen during stress were blunted in female mice lacking estrogen receptor-α in the brain medial amygdala. Deletion of estrogen receptor-α in medial amygdala neurons also resulted in increased excitability of these neurons, associated with elevated ionotropic glutamate receptor expression. We further demonstrated that selective activation of medial amygdala neurons mimicked effects of stress to increase blood pressure in mice. Together, our results support a model where estrogen acts on estrogen receptor-α expressed by medial amygdala neurons to prevent stress-induced activation of these neurons, and therefore prevents pressor responses to stress.

Keywords: amygdala; blood pressure; estrogen; hypertension; neurons.


Conflict of interest statement

Conflict of Interest. No potential conflicts of interest relevant to this article were reported.

Figures

Figure 1
Figure 1. Deletions of ERα in SIM1 neurons
Dual immunofluorescence for GFP (green) and ERα (red) in the MeA (A), MPOA (B) and PVN (C) in control (SIM1-Cre/Rosa26-GFP, upper panel) and SIM1-ERα-KO (Esr1f/f/SIM1-Cre/Rosa26-GFP mice, lower panel) mice. 3V, third ventricle; MPOA, medial pre-optic area; opt, optic tract. Scale bars = 50 μm.
Figure 2
Figure 2. Deletion of ERα in SIM1 neurons blunted 17β-estradiol effects on MAP and HR
(A–B) Temporal changes in mean arterial pressure in OVX+V or OVX+E-treated control (A) and SIM1-ERα-KO (B) mice at the baseline (−20 to 0 min) and the restrained condition (0 to 60 min). Data are presented as mean±SEM. N=6 to 9/group. *, P<0.05 between OVX+V and OVX+E in two-way ANOVA analysis followed by post hoc Sidak tests. (C) Averaged mean arterial pressure at the baseline or at the restrained condition in OVX+V or OVX+E-treated control and SIM1-ERα-KO mice. Data are presented as mean±SEM. N=6 to 9/group. *, P<0.05 or **, P<0.01 between baseline and stress condition within the same mice; #, P<0.05 between OVX+V and OVX+E within the same genotype in two-way ANOVA analysis followed by post hoc Sidak tests. (D–E) Temporal changes in heart rate in OVX+V or OVX+E-treated control (D) and SIM1-ERα-KO (E) mice at the baseline (−20 to 0 min) and the restrained condition (0 to 60 min). Data are presented as mean±SEM. N=6 to 9/group. #, P<0.05 vs. the baseline within the same group of mice in t-tests. (F) Averaged heart rate at the baseline or at the restrained condition in OVX+V or OVX+E-treated control and SIM1-ERα-KO mice. Data are presented as mean±SEM. N=6 to 9/group.
Figure 3
Figure 3. Deletion of ERα in the MeA blunted 17β-estradiol effects on MAP and HR
(A) Immunofluorescence for ERα in the MeA (upper panel) and the hypothalamus (lower panel) in Esr1f/f mice receiving AAV-GFP (control) or AAV-Cre-GFP (MeA-ERα-KO) injections in the MeA. 3V, 3rd ventricle; ARH, arcuate nucleus of the hypothalamus; MeA, medial amygdala; opt, optic tract; VMH, ventromedial hypothalamic nucleus. Scale bar = 100 μm. (B) Temporal changes in mean arterial pressure in OVX+E-treated control and MeA-ERα-KO mice at the baseline (−20 to 0 min) and the restrained condition (0 to 60 min). Data are presented as mean±SEM. N=5/group. *, P<0.05 in two-way ANOVA analysis followed by post hoc Sidak tests. (C) Averaged mean arterial pressure at the baseline or at the restrained condition in OVX+E-treated control and MeA-ERα-KO mice. Data are presented as mean±SEM. N=5/group. **, P<0.01 between baseline and stress condition within the same mice; #, P<0.05 between control and MeA-ERα-KO mice in two-way ANOVA analysis followed by post hoc Sidak tests. (D–E) Temporal changes in heart rate in OVX+E-treated control and MeA-ERα-KO mice at the baseline (−20 to 0 min) and the restrained condition (0 to 60 min). Data are presented as mean±SEM. N=5/group. *, P<0.05 in two-way ANOVA analysis followed by post hoc Sidak tests. (F) Averaged heart rate at the baseline or at the restrained condition in OVX+E-treated control and MeA-ERα-KO mice. Data are presented as mean±SEM. N=5/group. *, P<0.05 between baseline and stress condition within the same mice in two-way ANOVA analysis followed by post hoc Sidak tests.
Figure 4
Figure 4. Effects of ERα deletion on excitability of MeA SIM1 neurons
(A) Electrophysiological recording from an identified MeA SIM1 neuron in the brain slice from a SIM1-Cre/rosa26:tdTOMATO mouse. Illuminations for TOMATO, injected lucifer yellow dye, and the brightfield. Scale bars=20 μm. (B) Representative action potential traces in MeA SIM1 neurons from control and SIM1-ERα-KO mice. (C–D) Averaged firing frequency (C) and resting membrane potential (D). Data are presented as mean±SEM. N=9 or 16/group. *, P<0.05 in t-tests. (E) Representative mEPSC traces in MeA SIM1 neurons from control and SIM1-ERα-KO mice. (F–G) Averaged mEPSC amplitude (F) and frequency (G). Data are presented as mean±SEM. N=25 or 29/group. *, P<0.05 and ***, P<0.001 in t-tests. (H) Representative mIPSC traces in MeA SIM1 neurons from control and SIM1-ERα-KO mice. (I–J) Averaged mIPSC amplitude (I) and frequency (J). Data are presented as mean±SEM. N=17 or 14/group. (K) Relative mRNA levels of indicated genes in the amygdala from control and SIM1-ERα-KO mice. Data are presented as mean±SEM. N=7/group. *, P<0.05 in t-tests. Note that mGluR6 were undetectable in all samples and were not shown here. (I) Western blot showing protein levels of GluN1 and actin in the amygdala from control and SIM1-ERα-KO mice. (M) Summary quantification for the ratios of GluN1/actin. Data are presented as mean±SEM. N=4 or 5 in each group. *, P<0.05 in t-tests.
Figure 5
Figure 5. Effects of selective activation of MeA SIM1 neurons
(A) mCherry immunoreactivity in the MeA of SIM-Cre mice receiving stereotaxic AAV-hM3Dq–mCherry infection. (B) Electrophysiological recording from a mCherry-labelled MeA SIM1 neuron in the brain slice from a SIM1-Cre mouse receiving stereotaxic AAV-hM3Dq–mCherry infection. Illuminations for mCherry and the brightfield. Scale bars=10 μm. (C) Representative action potential traces in mCherry-labelled MeA SIM1 neurons in response to bath application of CNO (10 μM). (D–E) Firing frequency (D) and resting membrane potential (E) in each neuron at the baseline and after CNO treatment. (F–G) Temporal changes in mean arterial pressure (F) and heart rate (G) in AAV-hM3Dq-mCherry-infected SIM1-Cre mice received i.p. injections of saline or CNO (3 mg/kg). Data are presented as mean±SEM. N=7/group. *, P<0.05 in two-way ANOVA analysis followed by post hoc Sidak tests.

References

    1. Hajjar I, Kotchen JM, Kotchen TA. Hypertension: Trends in prevalence, incidence, and control. Annu Rev Public Health. 2006;27:465–490. - PubMed
    1. Spruill TM. Chronic psychosocial stress and hypertension. Curr Hypertens Rep. 2010;12:10–16. - PMC - PubMed
    1. Lehman BJ, Taylor SE, Kiefe CI, Seeman TE. Relationship of early life stress and psychological functioning to blood pressure in the cardia study. Health Psychol. 2009;28:338–346. - PMC - PubMed
    1. Rozanski A, Blumenthal JA, Kaplan J. Impact of psychological factors on the pathogenesis of cardiovascular disease and implications for therapy. Circulation. 1999;99:2192–2217. - PubMed
    1. Kario K, McEwen BS, Pickering TG. Disasters and the heart: A review of the effects of earthquake-induced stress on cardiovascular disease. Hypertens Res. 2003;26:355–367. - PubMed

Publication types