. 2016 May 3;113(18):4947-52.
doi: 10.1073/pnas.1524448113. Epub 2016 Apr 18.

Clusters of circulating tumor cells traverse capillary-sized vessels

Affiliations

Clusters of circulating tumor cells traverse capillary-sized vessels

Sam H Au et al. Proc Natl Acad Sci U S A. .

Abstract

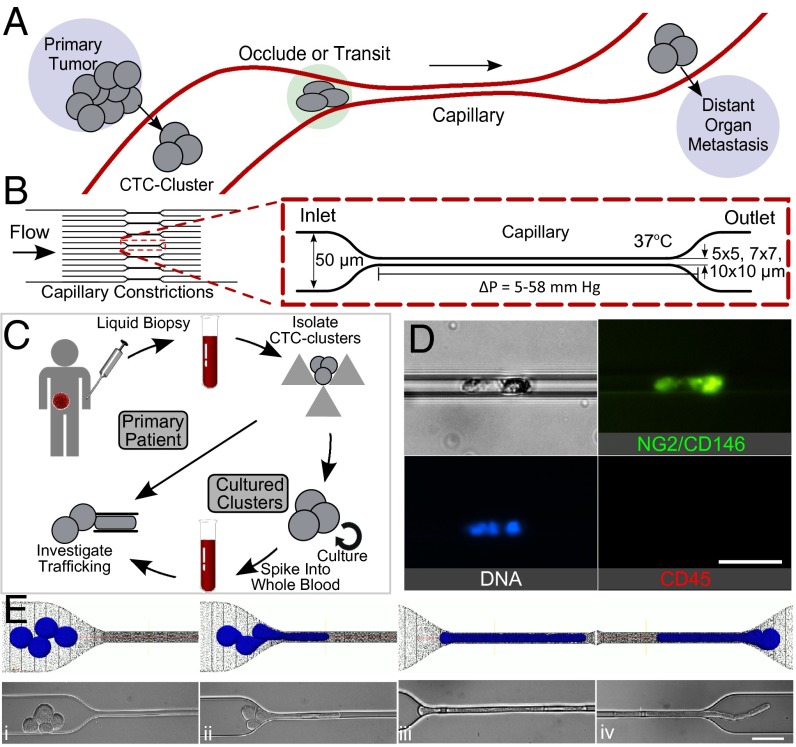
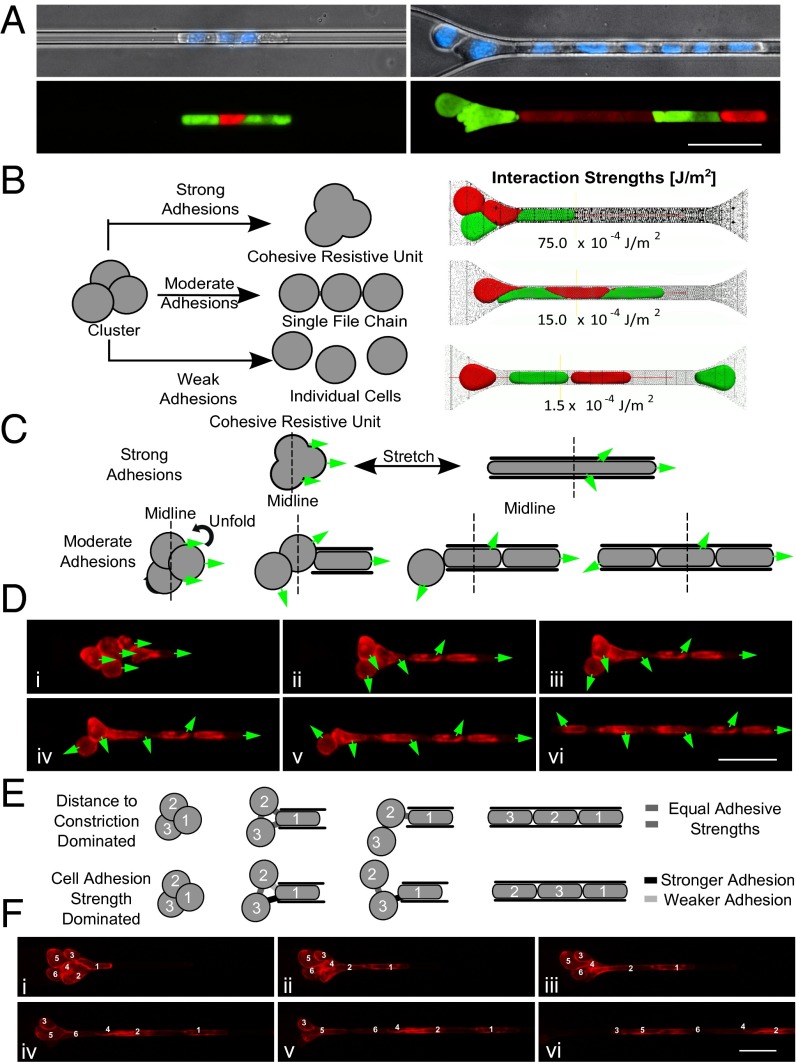
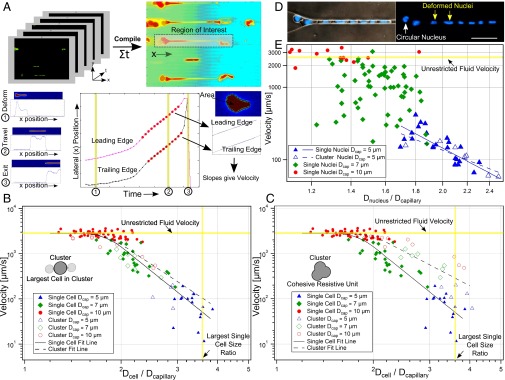
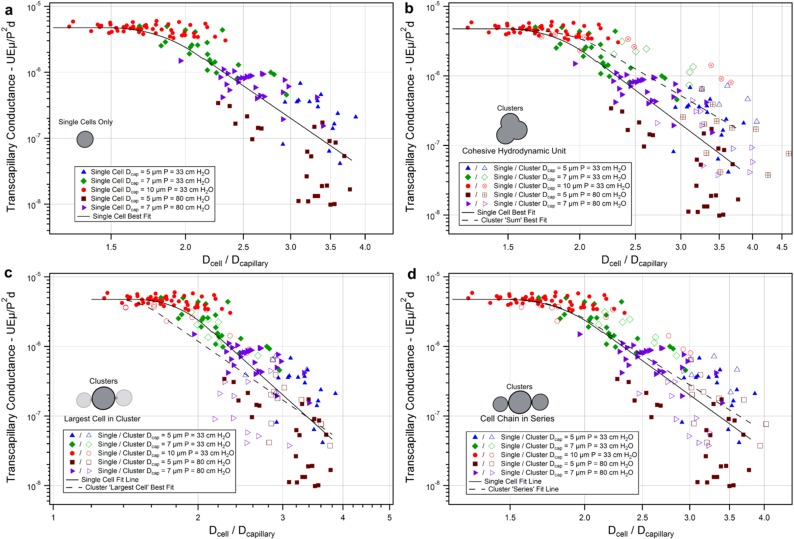
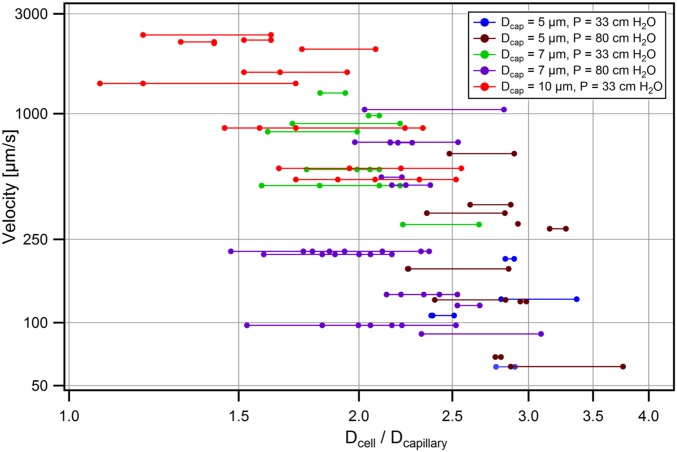
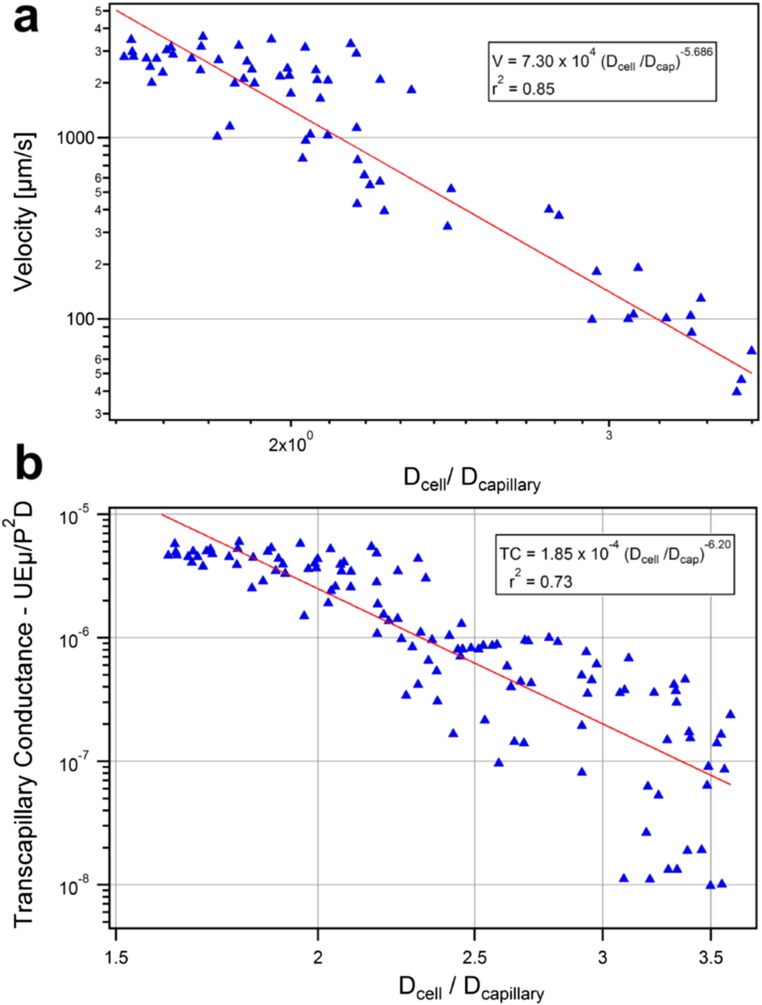
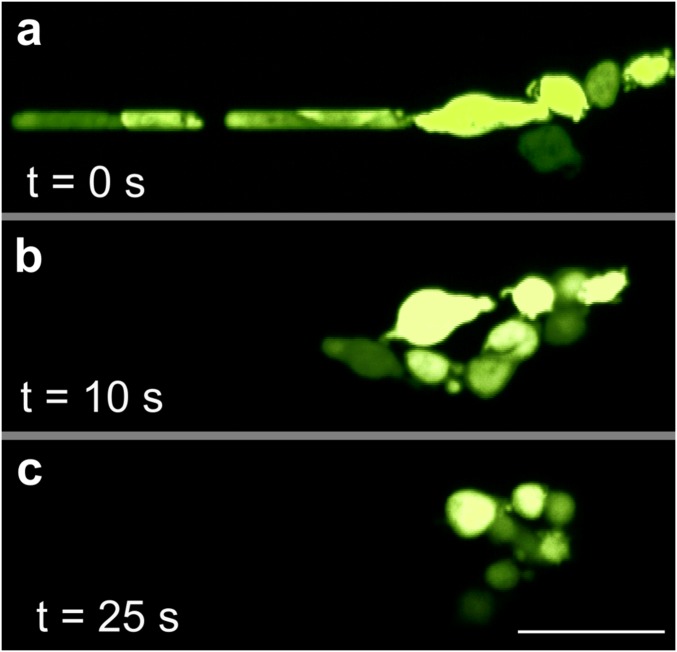
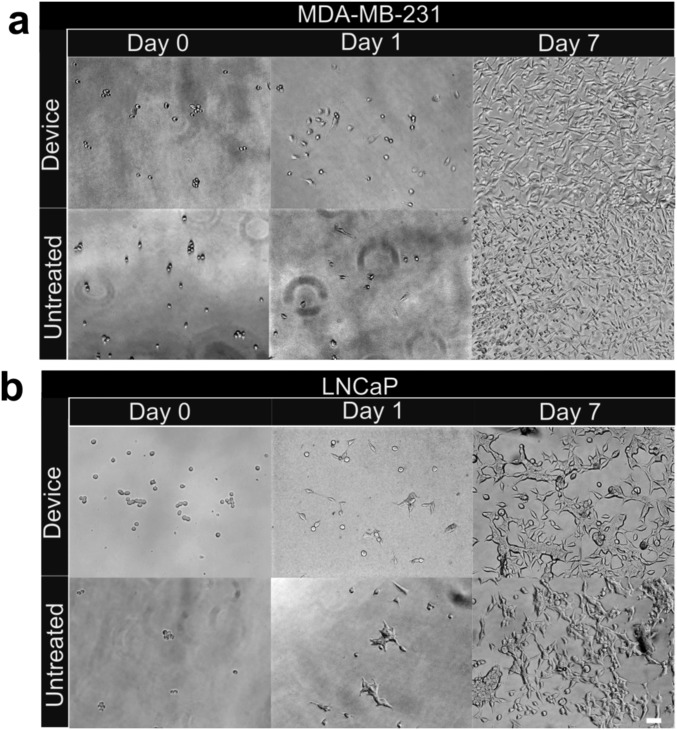
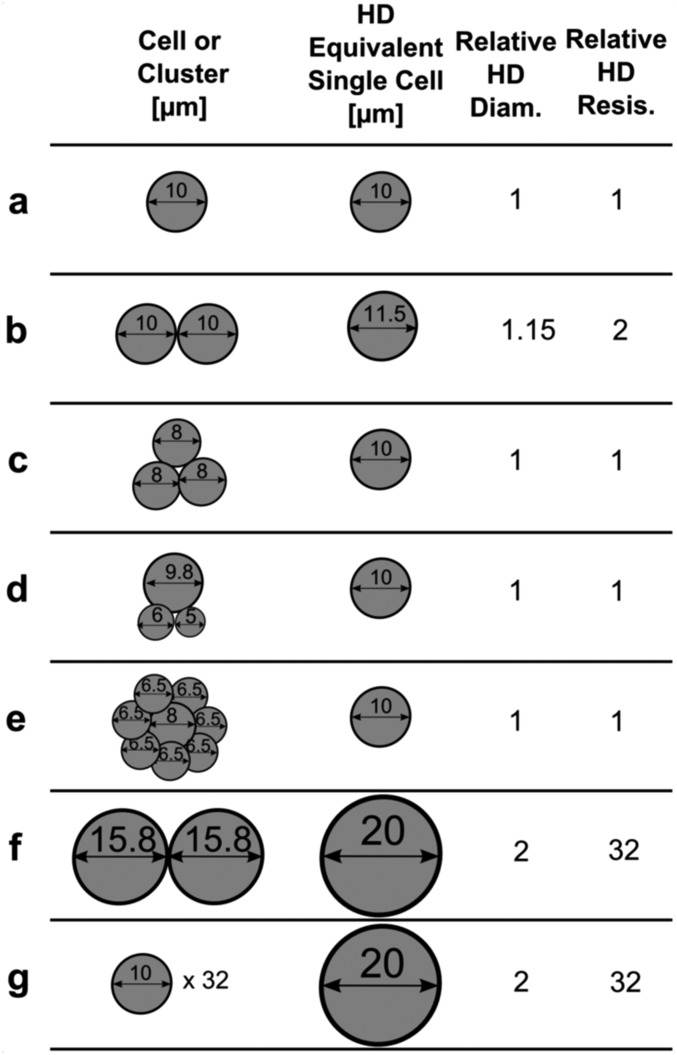
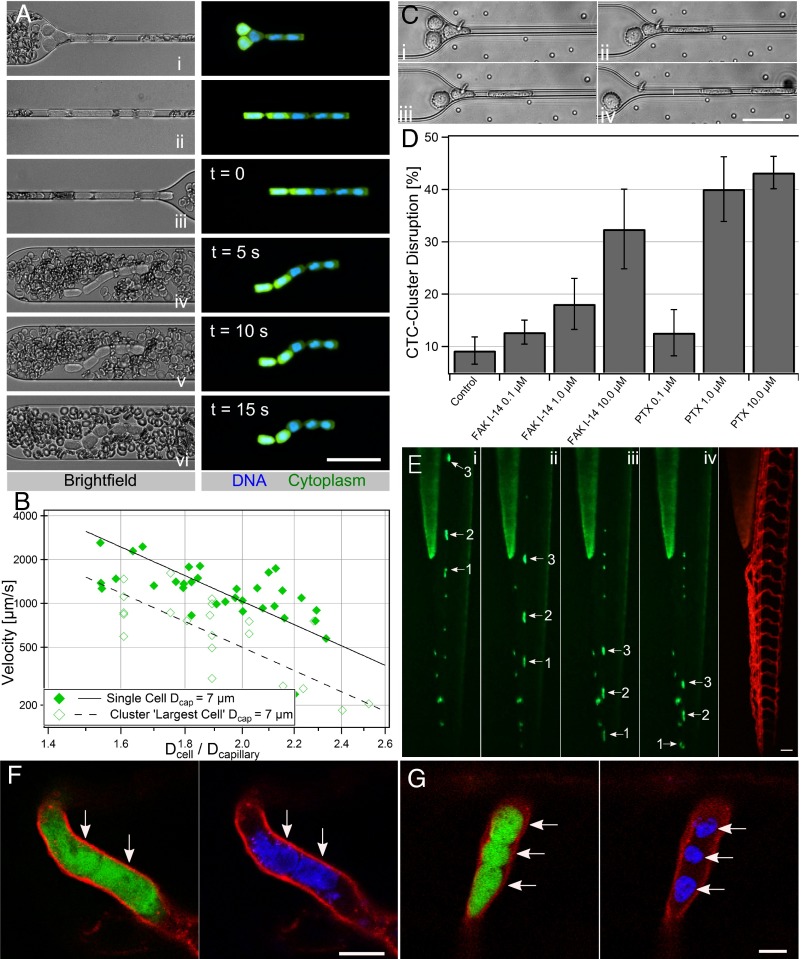
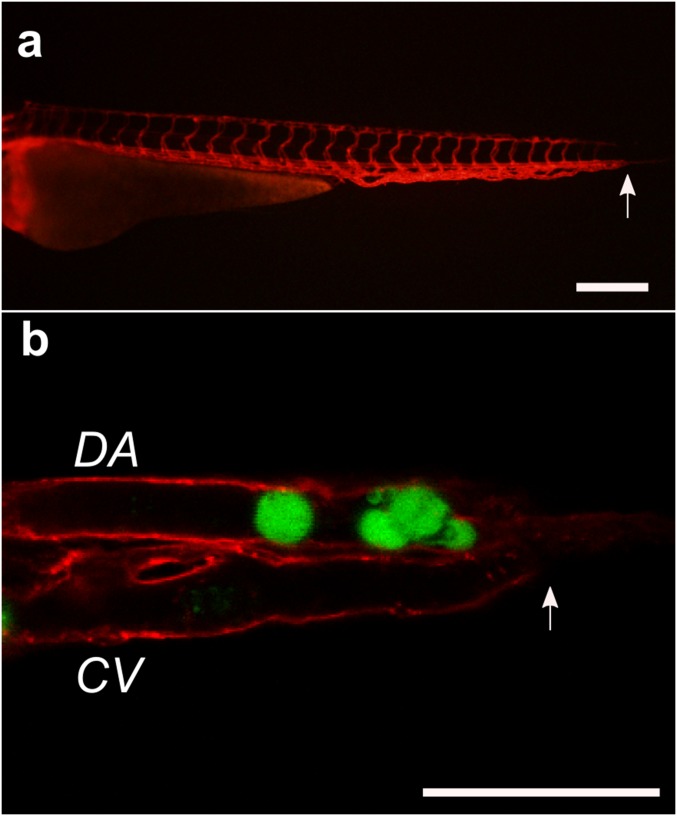
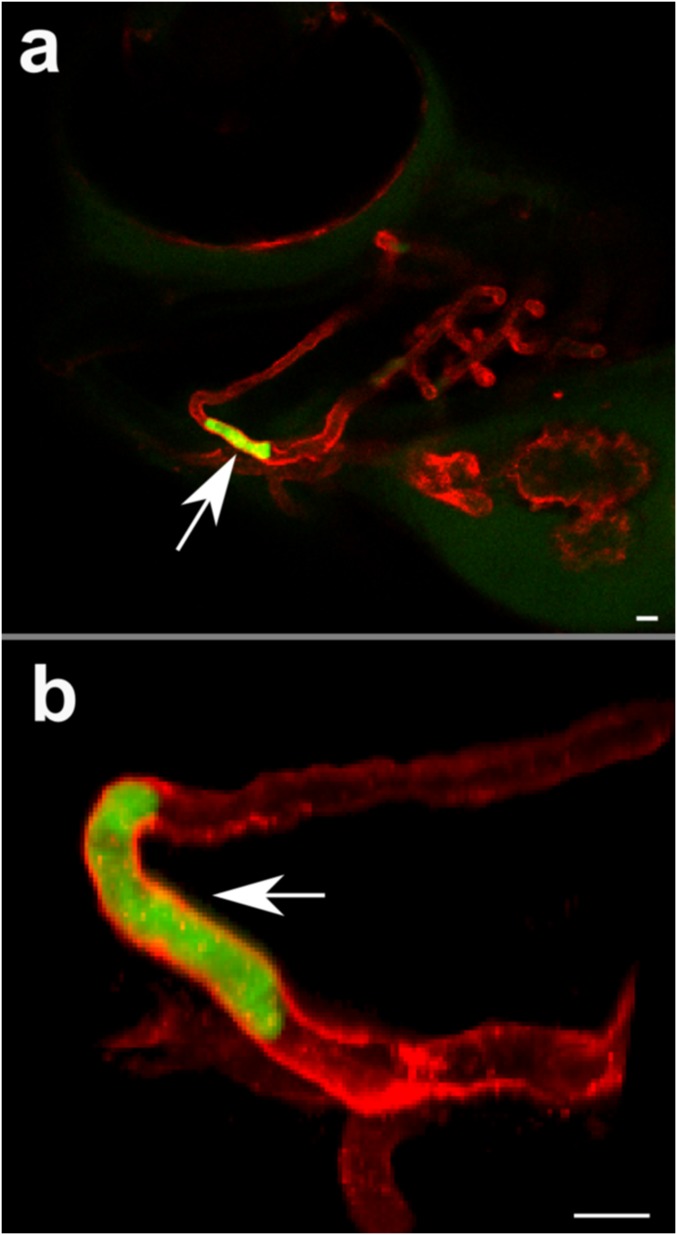
Multicellular aggregates of circulating tumor cells (CTC clusters) are potent initiators of distant organ metastasis. However, it is currently assumed that CTC clusters are too large to pass through narrow vessels to reach these organs. Here, we present evidence that challenges this assumption through the use of microfluidic devices designed to mimic human capillary constrictions and CTC clusters obtained from patient and cancer cell origins. Over 90% of clusters containing up to 20 cells successfully traversed 5- to 10-μm constrictions even in whole blood. Clusters rapidly and reversibly reorganized into single-file chain-like geometries that substantially reduced their hydrodynamic resistances. Xenotransplantation of human CTC clusters into zebrafish showed similar reorganization and transit through capillary-sized vessels in vivo. Preliminary experiments demonstrated that clusters could be disrupted during transit using drugs that affected cellular interaction energies. These findings suggest that CTC clusters may contribute a greater role to tumor dissemination than previously believed and may point to strategies for combating CTC cluster-initiated metastasis.

Keywords: CTC clusters; cancer metastasis; capillary microhemodynamics; circulating tumor cell cluster microemboli; microfluidics.


Conflict of interest statement

The authors declare no conflict of interest.

Figures

Fig. 1.
Fig. 1.
(A) Diagram of CTC clusters occluding or transiting through capillary to seed metastases. (B) Microfluidic device schematic, 16 parallel microchannels of 5 × 5, 7 × 7, or 10 × 10-µm square cross-sections, designed to mimic capillary flow conditions (not to scale). (C) Experimental workflow: CTC clusters were isolated from breast or melanoma patient liquid biopsies (30). Patient clusters introduced into capillary devices directly or after ex vivo culture and spiking into whole blood. (D) Primary patient CTC cluster isolated from melanoma patient transiting through 10-µm capillary constriction under 7 cm H2O at 37 °C. (E) Computational simulation (Top) and micrographs (Bottom) of four-cell LNCaP cluster in transit: (i) approach, (ii) unfold/elongate, (iii) travel, (iv) exit/reform through a 5-µm capillary constriction. (Scale bars: 50 µm.)
Fig. 2.
Fig. 2.
Cluster organization. (A) Micrographs of three-cell (left) and eight-cell (right) MDA-MB-231 GFP or mCherry tagged cells in clusters stained with Hoechst 33342 transiting through 5-µm capillary constriction. (B) Conceptual cluster behavior (left) and computational transit simulations (right). Strong intercellular adhesions (75.0 × 10⁻⁴ J/m2)—cluster occludes; moderate adhesions (15.0 × 10⁻⁴ J/m2)—single-file transit; weak adhesions (1.5 × 10⁻⁴ J/m2)—dissociation. (C) Conceptual responses: strong adhesions—minimal cell rotation; moderate adhesions—unfolding and cellular rotation. Greens arrows indicate leading edges of cells in the flow direction in frame i. (D) Time-lapse images of six-cell LNCaP cluster membrane stained with CellMask DeepRed. (E) Conceptual transit depends on distance to constriction (equal strength adhesions) or somewhat independent (heterogeneous adhesions). (F) Time-lapse images of six-cell LNCaP cluster demonstrating transit order. Cells numbered by distance to constriction in frame i. Experiments were conducted under 33 cm H2O at 37 °C. (Scale bars: 50 µm.)
Fig. S1.
Fig. S1.
Cellularized microchannels. Photomicrophotographs of rounded PDMS microchannels coated with human umbilical vein endothelial cells in bright field (A) and viability stained with calcein-AM (B). (Scale bar: 50 µm.)
Fig. 3.
Fig. 3.
Hydrodynamic analysis. (A) Size and velocity determination. (B and C) Velocities of singlet MDA-MB-231 cells traversing 5-µm (blue triangle, n = 18), 7-µm (green diamond, n = 23) or 10-µm (red circle, n = 52) microchannels vs. the ratios of cell-to-constriction diameters (Dcell/Dcapillary). Cells exhibited three transit regimes: Dcell/Dcapillary < 1.5—unrestricted fluid velocity; Dcell/Dcapillary >3.6—cells occluded; 1.5 ≤ Dcell/Dcapillary ≤ 3.6—transit under power law relation. Clustered MDA-MB-231 cells plotted assuming (B) cluster sizes equivalent to largest constituent cells or (C) cell volumes summed. Clusters match the color/shape of individual cells (above) but are hollow (n = 5, 7, 10, respectively). Single cells (solid lines) and clusters (dashed lines) were best fit to log-log transformed data. (D) Micrographs of eight-cell Hoechst 33342 stained MDA-MB-231 cluster in 5-µm capillary constrictions. Nuclei changed from circular (white arrow) to elongated (yellow arrows) upon entering. (Scale bar: 50 µm.) (E) MDA-MB-231 nuclear velocity vs. ratio of nuclear diameter to constriction size for single cells traversing 5-µm (n = 23), 7-µm (n = 59) and 10-µm (n = 14) capillary constrictions. Clusters traversing 5-µm constrictions (n = 6) were plotted as their largest constituent nuclei.
Fig. S2.
Fig. S2.
Cluster transit hydrodynamic analysis. Transcapillary conductance was calculated to normalize cells and clusters transiting under different pressures for comparison (SI Text). (A) Single cells only. Cluster diameters were plotted assuming the following: (B) cohesive resistive unit behavior where total cluster volumes were summed to equivalent larger single cells, (C) largest cell within cluster dictated total cluster conductance, or (D) single-file series behavior where individual cell resistances were summed to an effective spherical hydrodynamic diameter. MDA-MB-231 GFP cells, individually (solid symbols) or clustered (hollow symbols), were transited through 5-µm capillaries at 33 cm H2O [blue triangles; n = 18, 5 (singles, clusters)], 7 µm at 33 cm H2O (green diamonds; n = 23, 7), 10 µm at 33 cm H2O (red circles; n = 52, 10), 5 µm at 83 cm H2O (burgundy squares; n = 28, 15), or 7 µm at 83 cm H2O (purple arrowheads; n = 27, 11) at 37 °C. Clusters plotted assuming a single-file cell chain in series conductance most accurately matched single-cell data.
Fig. S3.
Fig. S3.
Compositions of clusters. Velocities vs. diameter ratio for individual cells within clusters of MDA-MB-231 cells transiting through capillary constriction devices analyzed in Fig. S2. Each dot represents an individual cell. Lines connect individual cells within clusters. A series of lines and dots together represent a single cluster.
Fig. S4.
Fig. S4.
Power law exponent determination. Linear best fit of log-log transformed MDA-MB-231 single-cell (A) velocities vs. cell-to-capillary diameter ratio of cells transiting at 33 cm H2O (n = 70) (for Fig. 3) and (B) transcapillary conductance vs. diameter for cells transiting at 33 or 83 cm H2O (n = 121) (for Fig. S2). All transiting single cells with Dcell/Dcap ratios between 1.6 and 3.6 were included in analysis. Least-squares estimates provided power law exponents of −5.69 and −6.10, respectively.
Fig. S5.
Fig. S5.
Reorganization and viability. Fluorescent photomicrographs of MDA-MB-231 L2 GFP cells traversing a 7-µm capillary under 33 cm H2O at 37 °C. Once cell began to exit the constriction, applied pressure was set to 0 to stop the flow and timer begun. (A) At time 0, cluster exited channel in a single-file chain. (B) After 10 s, cells within the cluster have begun to return to rounded morphology. (C) After 25 s, cells have returned to rounded morphology and have begun to reform lost multiple cell–cell adhesions.
Fig. S6.
Fig. S6.
Cell proliferation posttransit. (A) Representative photomicrographs of MDA-MB-231 L2 and (B) LNCaP clusters transited through capillary device (top panels) or untreated controls (bottom panels) were seeded into 48-well plates at approximately equal numbers and grown in RPMI-1640 media supplemented with 10% FBS at 37 °C/5% CO2. Photomicrographs were taken 1 h (left column), 1 d (middle column), and 7 d (right column) after transit. (Scale bars: 50 µm.)
Fig. S7.
Fig. S7.
Implications of hydrodynamic transiting parameters. Clusters (far left column), their equivalent single-cell hydrodynamic (HD) resistance (middle left column), relative HD diameter (middle right), and relative HD resistance (far right) assuming (i) a fifth-degree power law relation between cell diameter and hydrodynamic resistance (Fig. S4) and (ii) chain in series transit behavior of clusters where resistances are summed in series (Fig. S2). (A) Standard case of a single 10-μm diameter cell. (B) Two cells of 10-μm diameters. (C) Three cells of 8-μm diameter. (D) One 9.8-μm cell with one 6- and one 5-μm cell. (E) One 8-μm cell with seven 6.5-μm cells. (F) Two 15.8-μm cells. (G) Thirty-two 10-μm cells. Note the dominance that the largest cell within the cluster has on resistance (D), insensitivity to numerous relatively small cells (E and G) and dramatic 32-fold increase in hydrodynamic resistance by doubling single-cell diameter (F and G). Analysis is theoretical and assumed that cells are large enough in relation to the constriction to provide significant resistance to the flow while not being too large to fully occlude the constriction.
Fig. 4.
Fig. 4.
Transit, disruption, and transplantation of cultured CTC clusters. (A) Micrographs of Hoechst 33342 stained, GFP tagged breast cancer patient cultured CTC clusters (BRx-50) surrounded by red blood cells in whole blood traversing 7-µm capillary constriction under 20 cm H2O (Left) bright-field and (Right) nuclear and cytoplasmic. Time stamps for iii–vi show recovery after exit. (B) Plot of velocities vs. diameter ratios of individual (diamonds, n = 33) and cultured CTC clusters (hollow diamonds, n = 22) assuming largest cell represents cluster resistance. (C) Time-lapse sequence of three-cell Brx-50 cluster treated with 10.0 µM focal adhesion kinase inhibitor 14 dissociating into single cells within 7-µm channel at 20 cm H2O. (D) Constriction disruption efficiency of Brx-50 clusters preincubated with 0.1, 1.0, or 10 µM focal adhesion kinase inhibitor 14 (FAK I-14) or paclitaxel (PTX) for 24 h vs. vehicle controls. At least three device replicates were conducted per case with 15 or more clusters per replicate. (E) Time-lapse images (Left) showing transplanted Brx-50 cluster transiting through dorsal aorta of 3-d postfertilization Tg(kdrl:mCherry) zebrafish with fluorescently labeled vasculature of a different, but representative, animal (right). Numbers and arrows indicate three clusters in transit; cluster 1 transitions from dorsal aorta to caudal vein in frame iv. (F and G) Cytoplasmic (Left) and nuclear (Right) stained Brx-50 clusters in single file: (F) two-cell cluster in mandibular arch vessel and (G) three-cell cluster in intersegmental vessel (arrows indicate distinct cells or nuclei). (Scale bars: 50 µm in frames A, C, and E; 10 µm in frames F and G.)
Fig. S8.
Fig. S8.
(A) Sagittal view of 3-d postfertilization Tg(kdrl:mCherry) transgenic zebrafish before transplantation. Arrows indicates where sharp “U turn” of blood occurs. (Scale bar: 250 μm.) (B) Xenotransplanted GFP-tagged Brx-50 cultured CTC cluster and singlet (green) occluding at the caudal end of the zebrafish where the dorsal aorta (DA) terminates and the caudal vein (CV) begins. (Scale bar: 50 μm.)
Fig. S9.
Fig. S9.
(A) Sagittal view of head of 3-d postfertilization Tg(kdrl:mCherry) transgenic zebrafish showing transplanted human CTC cluster (white arrow) transiting through mandibular arch. (B) Close-up image of same transplanted CTC cluster (white arrow) showing displacement of cluster over time. Photomicrographs were captured less than 10 min apart. (Scale bar: 50 μm.)
Fig. S10.
Fig. S10.
(A) Definition sketch for scaling analysis of cell transit velocity through capillaries. (B) Side-view and top-view schematics of droplet constrained in the entrance region of devices before entering capillaries. Parameters used to determine unconstrained cell and nuclear spherical volumes.

References

    1. Yu M, Stott S, Toner M, Maheswaran S, Haber DA. Circulating tumor cells: Approaches to isolation and characterization. J Cell Biol. 2011;192(3):373–382. - PMC - PubMed
    1. Hong B, Zu Y. Detecting circulating tumor cells: Current challenges and new trends. Theranostics. 2013;3(6):377–394. - PMC - PubMed
    1. Krebs MG, et al. Molecular analysis of circulating tumour cells—biology and biomarkers. Nat Rev Clin Oncol. 2014;11(3):129–144. - PubMed
    1. Paterlini-Brechot P, Benali NL. Circulating tumor cells (CTC) detection: Clinical impact and future directions. Cancer Lett. 2007;253(2):180–204. - PubMed
    1. Hou JM, et al. Clinical significance and molecular characteristics of circulating tumor cells and circulating tumor microemboli in patients with small-cell lung cancer. J Clin Oncol. 2012;30(5):525–532. - PubMed

Publication types