. 2016 May 3;113(18):5018-23.
doi: 10.1073/pnas.1604365113. Epub 2016 Apr 18.

Tissue-specific DNA demethylation is required for proper B-cell differentiation and function

Affiliations

Tissue-specific DNA demethylation is required for proper B-cell differentiation and function

Shari Orlanski et al. Proc Natl Acad Sci U S A. .

Abstract

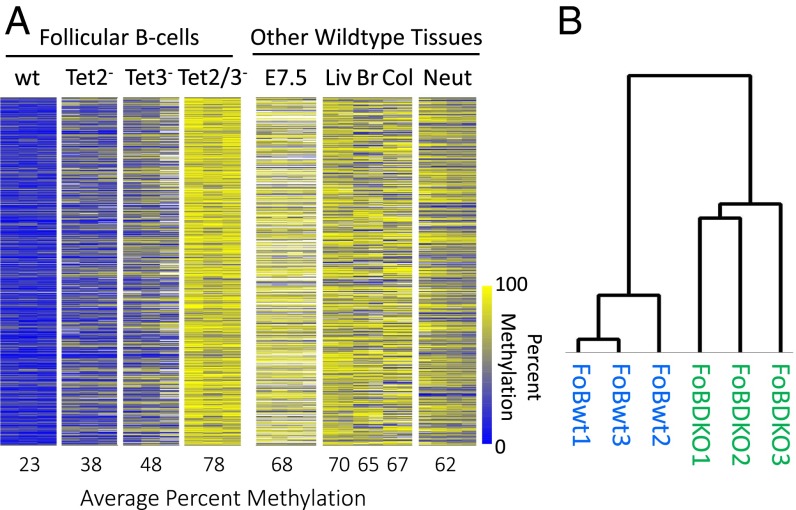
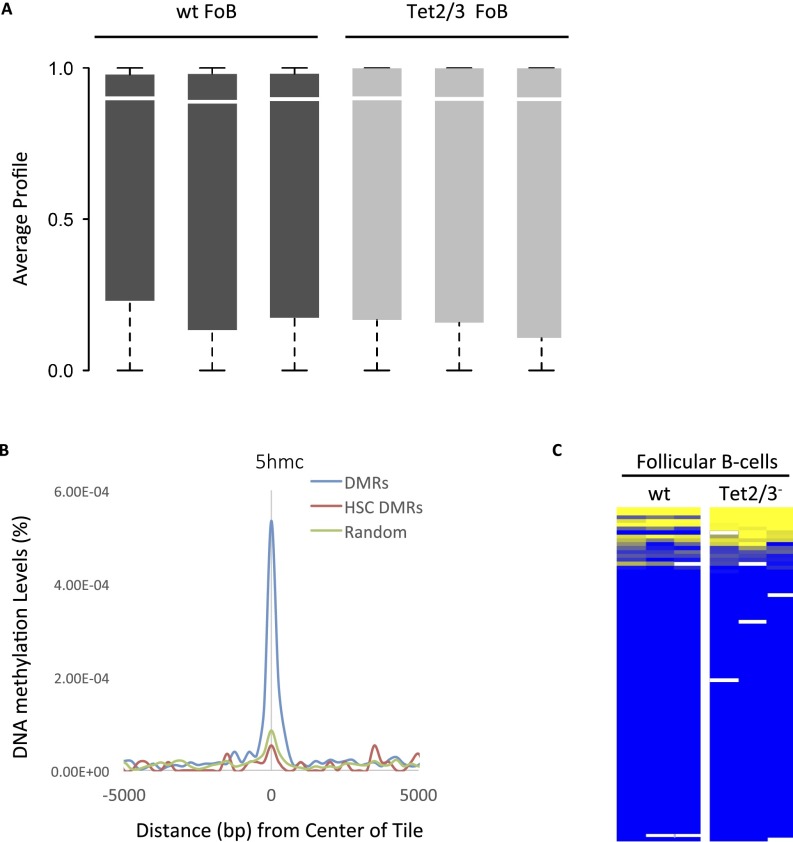
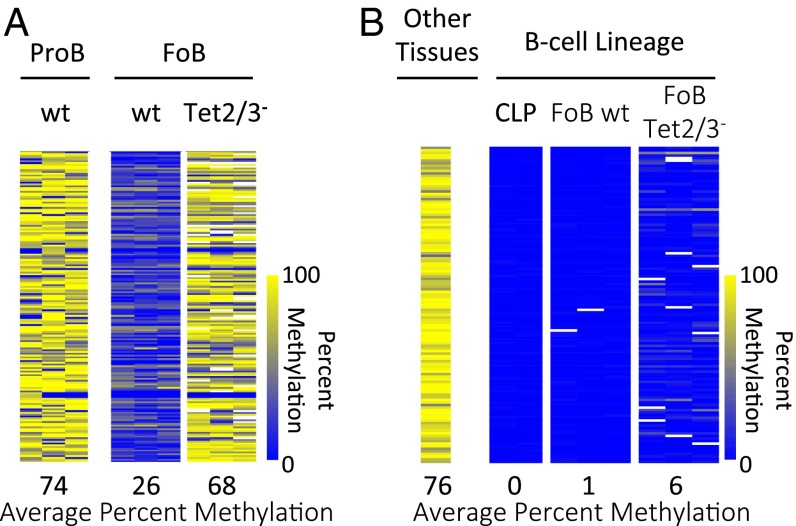
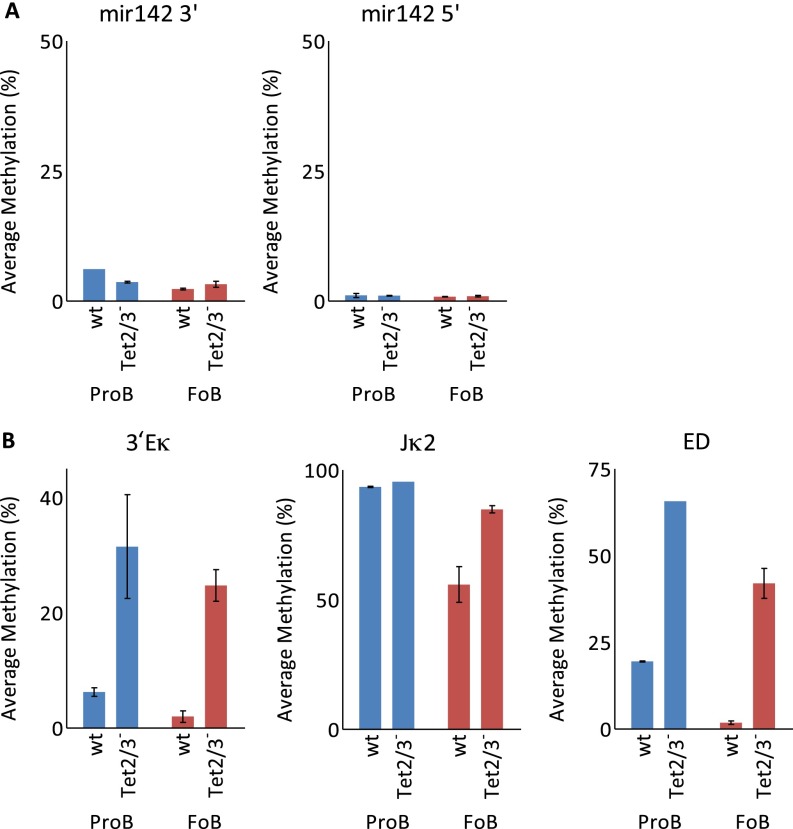
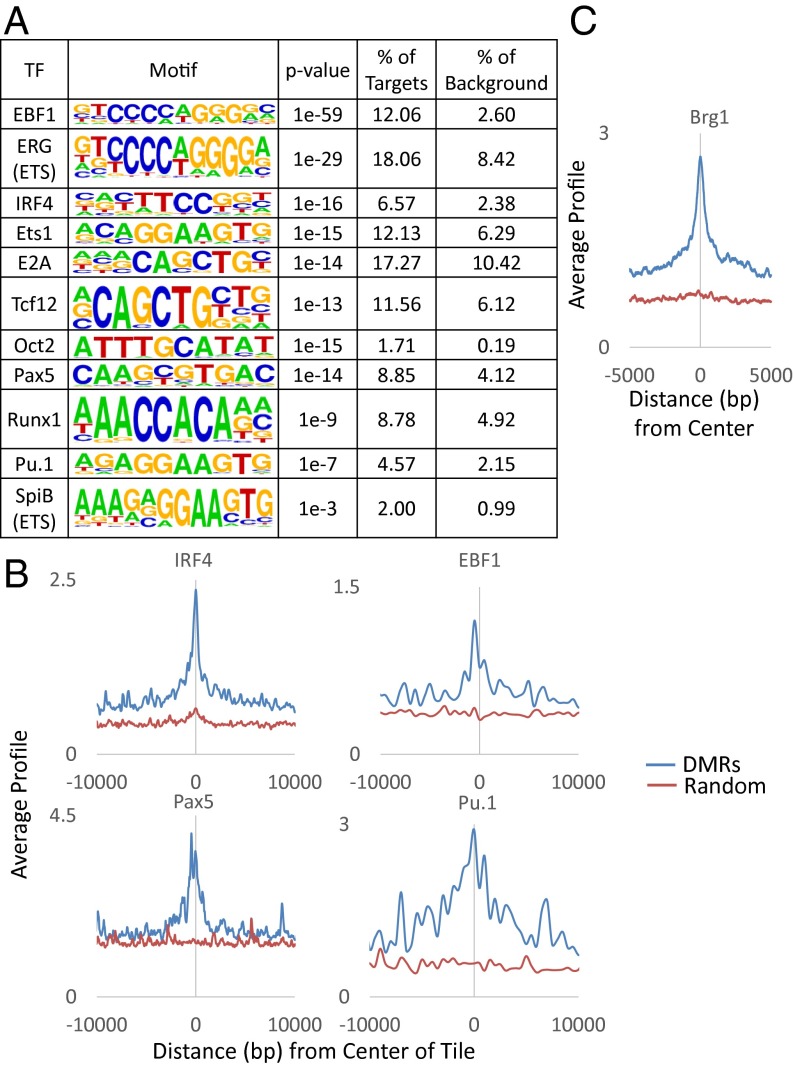
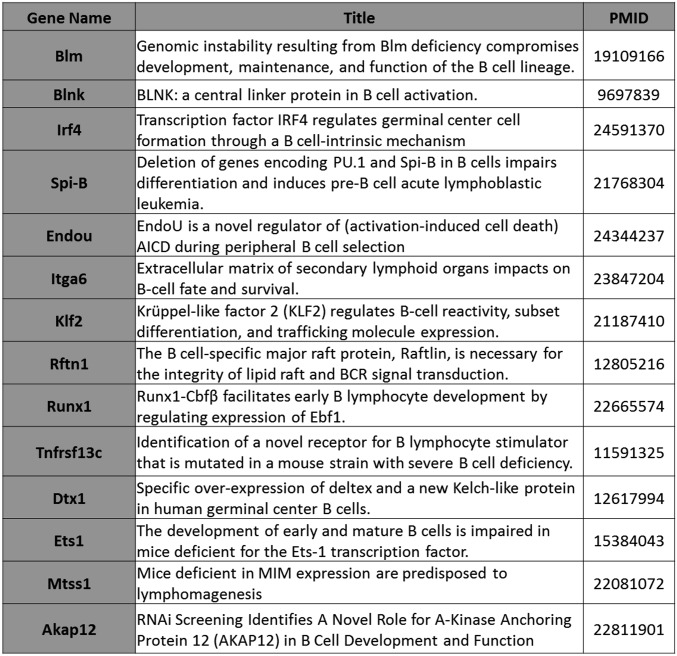
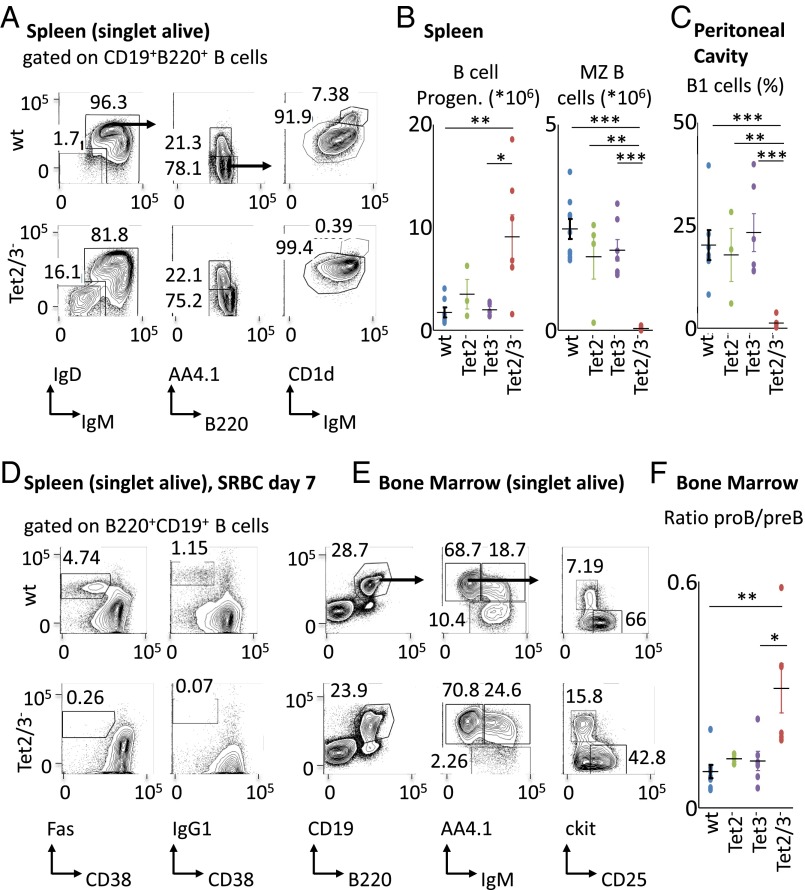
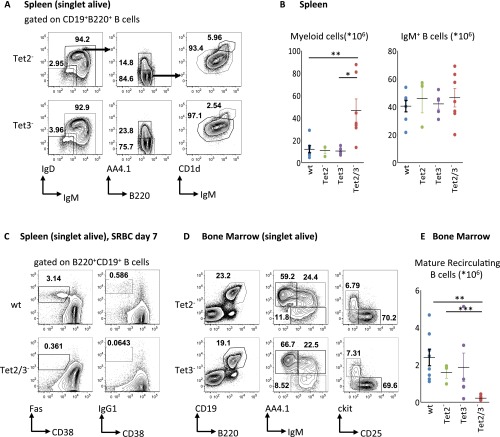
There is ample evidence that somatic cell differentiation during development is accompanied by extensive DNA demethylation of specific sites that vary between cell types. Although the mechanism of this process has not yet been elucidated, it is likely to involve the conversion of 5mC to 5hmC by Tet enzymes. We show that a Tet2/Tet3 conditional knockout at early stages of B-cell development largely prevents lineage-specific programmed demethylation events. This lack of demethylation affects the expression of nearby B-cell lineage genes by impairing enhancer activity, thus causing defects in B-cell differentiation and function. Thus, tissue-specific DNA demethylation appears to be necessary for proper somatic cell development in vivo.

Keywords: DMRs; Tet2/Tet3; chromatin; differentially methylated regions.


Conflict of interest statement

The authors declare no conflict of interest.

Figures

Fig. 1.
Fig. 1.
Effect of Tet knockouts on B cell-specific DNA demethylation. (A) Heatmap of 1,399 tiles comparing DNA methylation levels in follicular B cells (FoB) from wild-type (wt), Tet2, Tet3, and Tet2/3 (DKO) samples (n = 3) for each with a difference of at least 40% (P < 10−300, permutation test; Materials and Methods) between the wt and DKO samples (11 tiles showed the opposite methylation ratio). Samples are compared with other wild-type somatic tissues, embryonic day 7.5 (E7.5), liver (Liv), brain (Br), colon (Col),; and neutrophils (Neut) (n = 2–4) (39). Yellow represents high and blue represents low DNA methylation levels. (B) Hierarchical clustering analysis was performed on RRBS tiles from wild-type and Tet2/3 follicular B cells.
Fig. S1.
Fig. S1.
The 5mC and 5hmC methylation distribution. (A) Box plots of global RRBS methylation values for all replicates of wild-type and Tet2/3 follicular B-cell samples. (B) Enrichment of 5hmc in hematopoietic progenitor cells (GSE65895) as a function of distance from the center of each DMR (Fig. 1), compared with a random control. Tiles specifically unmethylated in HSCs are not enriched. The 5hmC levels were determined by HELP-GT (HpaII tiny fragment enrichment by ligation-mediated PCR with β-glucosyl transferase) in Tel1+/+ as opposed to Tet1−/− hematopoietic progenitor cells (70). Average coverage was 10–15× per base. (C) DNA methylation levels of the promoter regions for genes that harbor differentially methylated tiles (n = 356). Only 11 (3%) show a significant difference between wt and DKO. Yellow represents high and blue represents low DNA methylation levels.
Fig. 2.
Fig. 2.
Tet2/3-mediated stage-specific demethylation. (A) Heatmap of 174 tiles comparing DNA methylation levels between wt Pro-B cells and wt FoB cells which undergo DNA demethylation (>40%) during lineage specification. These tiles fail to undergo demethylation in Tet2/3 FoB cells. (B) Heatmap of 123 tiles specifically unmethylated in common lymphoid progenitor cells (CLPs) compared with average DNA methylation levels from a number of somatic tissues (fat, liver, brain, and heart) (39). These tiles remain unmethylated in the Tet2/3 FoB cells (n = 3) as well. Yellow represents high and blue represents low DNA methylation levels.
Fig. S2.
Fig. S2.
DNA methylation at specific sites. (A) DNA methylation of miR-142 regulatory regions in both Pro-B and FoB wt and DKO cells as determined by single-molecular bisulfite analysis (Miseq). Note that the knockout is initiated after this region has already undergone demethylation demonstrating that the demethylase is not necessary to maintain the undermethylated state. (B) DNA methylation of Igk regions in both Pro-B and FoB wt and DKO cells. Note that in this case, the knockout is initiated before the normal demethylation that occurs at these sites.
Fig. 3.
Fig. 3.
Characterization of DMRs. (A) Genome distribution of regions demethylated in wt compared with Tet2/3 FoB cells. (B) Left and Center show ChIP-seq of demethylated regions (n = 1,399) as a function of distance from their center for H3K4me1 and H3K27Ac in hematopoietic stem cells (HSC), common lymphoid progenitors (CLP), B cells, and T cells (GSE60103). Right shows ATAC-seq in CLP, pro-B (GSE66978), and B cells (GSE59992). It should be noted that this accessibility marker is not present at early stages of hematopoiesis and only appears in cells that have undergone demethylation at these sites.
Fig. 4.
Fig. 4.
Effect of DNA methylation on expression. (A) Percentage of tiles (n = 814) located in genes with decreased (blue) and increased (red) expression (Tet2/3 < wt FoB cells) associated with DMRs compared with random tiles (P < 10−27, z-test of proportions). (B) Heatmap of relative expression levels (RNA-seq) for genes (n = 111) that harbor putative enhancer sequences. Each column shows average data for three biological replicates. (C) Gene ontology of all DMRs (n = 814) by GREAT analysis (40).
Fig. S3.
Fig. S3.
Correlation between DNA methylation and expression. (A) DNA methylation levels (blue) and relative expression levels (red) of selected genes in both wild-type and Tet2/3 FoB cells. (B) RRBS profiles of DNA methylation and RNA-seq analysis at two select loci containing DMRs (highlighted in red) in FoB cells that are associated with genes displaying decreased gene expression in the DKO (average of three replicate experiments).
Fig. S4.
Fig. S4.
DMR–gene interactions by Hi-C analysis. Genes that interact with distal DMRs whose expression is down-regulated in the DKO. These DMR–promoter contacts were identified from a Hi-C dataset originating from CH12 cells. The table shows the distance of each DMR from its interacting promoter. Some genes interact with more than one DMR. Genes known to be involved in B-cell development or function are noted in bold. Nine of these genes are also associated with intragenic DMRs.
Fig. 5.
Fig. 5.
Correlation with expression. (A) Motif analysis of unselected DMRs (n = 1,399) by HOMER (41) showing percent enrichment of target sequences for transcription factors (TFs) compared with background. ChIP-seq of (B) lymphoid transcription factors (IRF4, EBF1, Pax5, and Pu.1) (GSE53595 and GSE38046) and (C) chromatin remodeler Brg1 (GSM1635413) as a function of distance from the center of each DMR compared with a random control.
Fig. S5.
Fig. S5.
DMR-associated genes that affect B-cell development as determined by genetic analysis.
Fig. 6.
Fig. 6.
Population analysis of B cells in Tet2/3 knockouts. Tet2/3 DKO mice display abnormalities during B-cell development. (A) Representative flow cytometry analysis of splenocytes from the indicated genotypes. Numbers adjacent to outlined areas indicate % cells in each plot, and arrows indicate gating strategy. Gates depict IgM+ B cells (B220+CD19+IgM+IgD+/−), IgM B-cell progenitors (B220+CD19+IgMIgD), immature IgM+ B cells (B220+CD19+IgM+AA4.1+), mature B cells (B220+CD19+IgM+AA4.1), follicular (Fo) B cells (B220+CD19+IgM+AA4.1CD1dlo), and marginal zone (MZ) B cells (B220+CD19+IgM+AA4.1CD1dhi). (B) Graphs depict total cell numbers of selected splenic subpopulations as shown in A (n = 4–7). (C) Graph depicts % of B1 cells (B220loCD19+CD5+) among lymphocytes in the peritoneal wash (n = 3–7). (D) Representative flow cytometry analysis of splenocytes from SRBC immunized mice of the indicated genotypes. Numbers adjacent to outlined areas indicate % cells in each plot. Gates depict germinal center B cells [B220+CD19+CD95(Fas)+CD38lo] and class switched IgG1+ B cells (B220+CD19+IgG1+CD38lo). (E) Representative flow cytometry analysis of bone marrow cells from the indicated genotypes. Numbers adjacent to outlined areas indicate % cells in each plot, and arrows indicate gating strategy. Gates depict total B cells (B220+CD19+), mature recirculating B cells (B220+CD19+IgM+AA4.1), immature IgM+ B cells (B220+CD19+IgM+AA4.1+), pro-B/pre-B cells (B220+CD19+IgMAA4.1+), pre-B cells (B220+CD19+IgMAA4.1+CD25+, ckit), and pro-B cells (B220+CD19+IgMAA4.1+CD25, ckit+). (F) Graph depicts the ratio of pro-B/pre-B cells in bone marrow (n = 3–7). All plots are gated on live singlets. Graphs depict mean values and SDs of the respective populations. Significance was calculated by the two-tailed Student t test (*P < 0.05; **P < 0.01; ***P < 0.001).
Fig. S6.
Fig. S6.
Tet2/3 DKO mice display abnormalities during B-cell development. (A) Representative flow cytometry analysis of splenocytes from the indicated genotypes. Numbers adjacent to outlined areas indicate % cells in each plot, and arrows indicate gating strategy Gates depict IgM+ B cells (B220+CD19+IgM+IgD+/−), IgM B-cell progenitors (B220+CD19+IgMIgD), immature IgM+ B cells (B220+CD19+IgM+AA4.1+), mature B cells (B220+CD19+IgM+AA4.1), follicular (Fo) B cells (B220+CD19+IgM+AA4.1CD1dlo), and marginal zone (MZ) B cells (B220+CD19+IgM+AA4.1CD1dhi). (B) Graphs depict total cell numbers of myeloid cells (CD11b+) and IgM+ B cells (B220+CD19+IgM+IgD+) in the spleen (n = 3–7). (C) Representative flow cytometry analysis of splenocytes from SRBC immunized mice of the indicated genotypes. Numbers adjacent to outlined areas indicate % cells in each plot. Gates depict germinal center B cells [B220+CD19+CD95(Fas)+CD38lo] and class switched IgG1+ B cells (B220+CD19+IgG1+CD38lo). (D) Representative flow cytometry analysis of bone marrow cells from the indicated genotypes. Numbers adjacent to outlined areas indicate % cells in each plot, and arrows indicate gating strategy Gates depict total B cells (B220+CD19+), mature recirculating B cells (B220+CD19+IgM+AA4.1), immature IgM+ B cells (B220+CD19+IgM+AA4.1+), pro-B/pre-B cells (B220+CD19+IgMAA4.1+), pre-B cells (B220+CD19+IgMAA4.1+CD25+, ckit), and pro-B cells (B220+CD19+IgMAA4.1+CD25, ckit+). (E) Graph depicts the total cell number of mature recirculating B cells (B220+CD19+IgM+AA4.1) in the bone marrow (n = 3–7). All plots are gated on live singlets. Graphs depict mean values and SDs of the respective populations. Significance was calculated by the two-tailed Student t test (*P < 0.05; **P < 0.01; ***P < 0.001).
Fig. S7.
Fig. S7.
Effect of Tet2/3 DKO on the Igκ rearrangement repertoire. Vκ contribution to the Igκ repertoire was analyzed from RNA-seq data on follicular B cells from three wt and three Tet2/3 mice. RPKM of each Vκ segment was normalized to the sum of all Vκ reads to give a percent of the repertoire. Vκ segments which contribute less than 0.4% of the repertoire in all samples were removed from the analysis to overcome outlier effects of lowly expressed genes. The ratio between the wt and Tet2/3 contribution to the repertoire for each Vκ segment is presented. Error bars represent SEM. The distal V segments (blue) are down-regulated in Tet2/3, whereas the proximal Vs (red) are up-regulated (P < 10−5).

References

    1. Tahiliani M, et al. Conversion of 5-methylcytosine to 5-hydroxymethylcytosine in mammalian DNA by MLL partner TET1. Science. 2009;324(5929):930–935. - PMC - PubMed
    1. Ito S, et al. Role of Tet proteins in 5mC to 5hmC conversion, ES-cell self-renewal and inner cell mass specification. Nature. 2010;466(7310):1129–1133. - PMC - PubMed
    1. Wu H, Zhang Y. Reversing DNA methylation: Mechanisms, genomics, and biological functions. Cell. 2014;156(1-2):45–68. - PMC - PubMed
    1. Guo F, et al. Active and passive demethylation of male and female pronuclear DNA in the mammalian zygote. Cell Stem Cell. 2014;15(4):447–458. - PubMed
    1. Shen L, et al. Tet3 and DNA replication mediate demethylation of both the maternal and paternal genomes in mouse zygotes. Cell Stem Cell. 2014;15(4):459–470. - PMC - PubMed

Publication types

Substances